
ABSTRACT
A Measles-Rubella (MR) vaccination campaign was launched in India in a phased manner in February 2017 to cover children aged 9 months to 15 years. As evidence on campaign vaccine delivery costs is limited, the delivery cost for MR campaign from a government provider perspective was estimated in four Indian states, namely, Assam, Gujarat, Himachal Pradesh, and Uttar Pradesh. Costs were calculated in top-down and bottom-up approaches using data collected from 84 sites at different administrative levels and immunization partners in the study states from August 2019 to March 2020. All costs were presented in 2019 US$ and Indian Rupee (INR). The financial cost per dose of the MR campaign including all partner support ranged from US$0.16 (INR 10.95) in Uttar Pradesh to US$0.34 (INR 24.13) in Gujarat. In Uttar Pradesh, the full economic cost per dose was US$0.87 (INR 61.39). The key financial cost drivers were incentives related to service delivery and supervision, the printing of reporting formats for record-keeping, social mobilization, and advocacy. The financial delivery cost per dose estimated was higher than the government pre-fixed budget per child for the MR campaign, probably indicating an insufficient budget. However, the study found underutilization of MR budget in two states and use of other sources of funding for the campaign indicating the need for proper utilization of the campaign budgets by the states. Unit cost information generated from this study will be useful for planning, cost projections, and economic analysis of future vaccination campaigns in India.
Introduction
Measles is one of the most common vaccine-preventable diseases among children under the age of five in India.Citation1 In 2014, India’s routine immunization coverage was 90% for the first dose of measles and only 66% coverage for the second dose, which was far lower than the global target of 95% coverage needed for measles elimination.Citation2,Citation3 Rubella transmission is also highly prevalent in communities across India, which can affect pregnant women and may lead to Congenital Rubella Syndrome in children.Citation4,Citation5 In 2014, the National Technical Advisory Group on Immunization (NTAGI) recommended the introduction of Measles-Rubella (MR) vaccine in the routine immunization program in India, after a nationwide MR campaign.Citation2 Following the recommendation, an MR campaign was launched in February 2017 in a phased manner, aiming to cover about 405 million children in the age group of 9 months to 15 years. Estimating vaccination program costs, including the cost of vaccine delivery, is essential information needed in planning and budgeting such a campaign.
Despite its importance, the evidence on campaign vaccine delivery costs is very limited. The Immunization Delivery Cost Catalog (IDCC) compiled global evidence on the cost of delivering vaccines across different low- and middle-income countries. Only 5% of the 666 unit costs in the IDCC are for campaigns and outbreak responses.Citation6 Only two of the studies covered measles campaigns and none costed an MR campaign.
Due to the dearth of campaign costing evidence, countries, donors, and partners have mostly relied on estimates reported in Comprehensive Multi-Year Plans (cMYPs). A review of data for 2004 to 2011 from cMYPs from 38 countries estimated the average operational cost per person per dose of a campaign with a measles-containing vaccine at US$0.81 (ranging from US$0.27 to US$3.73) in 2010 US$.Citation7 The Measles & Rubella Initiative (M&RI) estimated the cost of the measles or measles-rubella campaign at US$1.00 per child vaccinated.Citation8 Gavi, the Vaccine Alliance, assumes US$0.80 per person in the target population as the operational cost.Citation9
In India, only one previous campaign costing study exists. The micro-costing study of the delivery cost for oral cholera vaccine (OCV) in Odisha State yielded an estimate of U$0.49 per dose (in 2011 US$).Citation10
To fill the gap on campaign costing evidence both in India and globally, this study has estimated the cost of India’s MR campaign in four states.
Methods
The MR campaign
The MR vaccination campaign covered most states and districts of the country over two years from 2017 to 2019. The campaign in each state started with a state-level MR workshop involving district officials, followed by a planning process to form a core group. District-level planning started with district task force meetings involving the Department of Education, Integrated Child Development Services (ICDS), the media, police, transport, Panchayati raj institutions, and other partner organizations.
District level microplanning, as well as training workshops, were conducted with the involvement of block (sub-district) level medical officers and other staff. At the block and sub-block level, workshops were conducted to develop a microplan for the campaign as well as to train all vaccination teams, supervisors, and volunteers on the operational aspects of the campaign.
The Auxiliary Nurse Midwives (ANMs) who are posted at the most peripheral health centers (known as sub-centers) prepared the microplan for their respective areas following the operational guidelines of vaccinating 200 children per team per day in schools and 150 children per day per team through outreach. They visited each school in their areas to sensitize them about the campaign and to request the list of children enrolled at each school. The list of target children for outreach sessions was prepared by combining house-to-house survey reports, existing lists of children in Anganwadi centers (part of the ICDS program), as well as existing lists managed by the ANMs. The micro-plans prepared by ANMs were reviewed and compiled at the block level, and subsequently, the block micro-plans were collated at the district level.
The MR vaccine was administered through session sites at educational institutes, outreach, and hard-to-reach areas. The vaccination team comprised one vaccinator (ANM or nurse), one Accredited Social Health Activist (ASHA), and one Anganwadi worker (AWW). The sessions at schools were attended by one or two nodal teachers. All teams were supervised by block, district, and state-level supervisors.
After completion of the campaign in each area, data were collated from coverage reports, supervisors’ reports, and monitors’ feedback to identify areas with low coverage. The identified low-coverage areas were targeted separately for a mop-up activity to immunize the missed children at designated vaccination sites.
Study design
The cost of the MR campaign vaccine delivery was estimated using a government health system perspective. Data were retrospectively collected from national, state, district, block, and from World Health Organization (WHO), and United Nations International Children’s Fund (UNICEF) India offices for the financial costing in four states. In addition to the above, for the economic costing in one state, data were also collected from the sub-center level. Data were collected by a two-member team using a pre-tested structured questionnaire between August 2019 and March 2020. All costs were presented in 2019 United States Dollars (US$) and Indian Rupee (INR). An average exchange rate of 2019, US$1 = INR 70.394 was used throughout the paper.
Sample
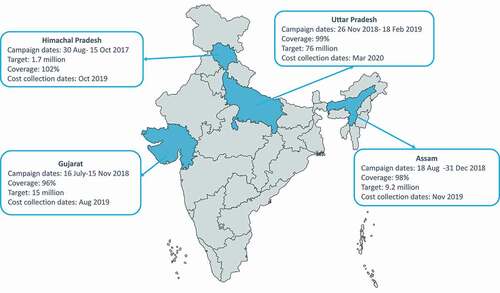
Four states were purposely selected for this study representing different regions of the country: Assam, Gujarat, Himachal Pradesh, and Uttar Pradesh (). Assam is situated in the North-East of India and is the largest northeastern state in terms of the population, while second in terms of area. It shares two international borders and seven state borders. As per the 2011 census, the total population of Assam was about 31.2 million with a population density of 398 per square km, higher than the national average of 382 per square km.Citation11 Gujarat is a state on the western coast of India with a population of about 60.4 million as per the 2011 census and a density of 308 per square km. Himachal Pradesh is a northern hilly state of India with 6.9 million people and a population density of 123 per square km. Uttar Pradesh, a northern Indian state, with 199.6 million inhabitants, is the most populous state in the country. The population density of the state is 829 persons per square km.Citation11
Figure 1. States selected for MR delivery cost collection.
Within each state, three districts were selected based on the following indicators: vaccination coverage, location (rural/urban/mixed), prevalence of vaccine hesitancy and refusal, and geographic challenges. Vaccine hesitancy was identified based on the duration of the campaign, with the assumption that the longer it took the district to complete the campaign, the more likely it was that the district had to deal with campaign hesitancy issues and refusals. The sampling approach ensured that each cluster of districts included one each with easy (defined by mostly urban area, highest vaccination coverage, and lowest vaccine hesitancy), difficult (defined by lowest share of the urban population, lowest vaccination coverage, highest vaccine hesitancy, and difficult terrain), and average (defined by median rural/urban population balance, median vaccination coverage, and the median level of vaccine hesitancy) accessibility. Three blocks (sub-districts) within each district were sampled following the same method. For economic costing, data were also collected through interviews with the ANMs posted at the sub-center level in one state – Uttar Pradesh. Three sub-centers per sampled block were randomly selected for this study.
The government financed the operational cost of the MR campaign based on a fixed and pre-determined budget, which was INR 12.6 (US$0.20 in 2019 US$) for small states and Union Territories and INR 11.6 (US$0.18 in 2019 US$) for large states per child targeted. The National Operational Guidelines stipulated financial norms for operational funds under MR campaignCitation2 which was referred to and adhered to at all levels. Gavi, the Vaccine Alliance, financed the procurement cost of the vaccine (196.92 million doses) for the campaign, and in addition, provided around US$8.5 million in operational cost supportCitation12 which was channeled through WHO and UNICEF. Therefore, data were also collected from the national and state offices of WHO and UNICEF. The final data collection sites of this study are presented in .
Table 1. Data collection sites in Measles-Rubella vaccine delivery costing study
While Community Health Centers (CHCs) were the planning units for MR campaign in three states, they were Primary Health Centers (PHCs) in Gujarat. Since PHCs were the planning units, instead of CHCs, data were collected from PHCs in the sampled blocks in Gujarat.
Rural public health care in India is a three-tier system where sub-centers (SCs) are the most peripheral and the first contact point between the primary health-care system and the community and provide services concerning maternal and child health, family welfare, nutrition, immunization, and others.Citation13 It caters to 5000 population in plains and 3000 in hilly and other hard-to-reach areas. As per the norm, each SC is staffed by one auxiliary nurse midwife (ANM) and a multi-purpose worker (MPW). There is also a provision of one additional ANM on a contractual basis.Citation13 Primary health centers (PHCs) are the referral units of 5–6 SCs with 4–6 inpatient beds and are the first contact point between the community and a medical officer. A PHC generally caters to a population of 30000 in plains and 20000 in hills and other hard-to-reach areas. PHCs provide health-care promotion and curative services. CHCs are the referral units of 4–5 PHCs with 30 inpatient beds and staffed by specialists, paramedics, and other staff (Ref). A CHC has a population coverage of 120 000 in plains and 80000 in other areas.
Costing methodology
Costs were grouped according to cost activities and line items following standard methodologies adapted to the Indian context.Citation14,Citation15 The activities included at each level of the four sampled states and the associated cost-line items are described in detail in Annex 1. The electricity charges, building, vehicle costs, and the capital cost of office equipment (such as printers) were excluded. Two different methodologies were deployed for estimating the cost of the MR campaign: top-down and bottom-up. For the bottom-up approach, quantities of inputs required for each activity, unit prices, and a share of the inputs for the MR campaign (wherever applicable) were used to calculate the unit costs for the activities. Data for the bottom-up approach were collected through interviews with various staff involved in the campaign and a review of available records. In the top-down method, expenditures for the campaign (both from the designated MR budget and any other budget heads) were collected from the financial reports at each level.
For the financial costing, the cost of training, vaccine collection, distribution and storage, transport, and program management were calculated using a bottom-up approach. For service delivery, monitoring, and supervision, while the fuel and vehicle maintenance costs were calculated using a bottom-up approach, per diems and travel allowances were taken from the MR campaign financial reports. The maintenance cost of a vehicle used for the MR campaign was calculated by apportioning the annual maintenance cost of the vehicle to the total number of days the vehicle was used for the MR campaign. Printing of reporting forms, supplies required for waste management, and the cost of freezing ice was taken from actual expenditure reports. Actual spending on contingencies was taken from the MR financial report and reported under “Others” (Annex 1).
Average price and useful life of cold-chain equipment and vehicle were taken from the cMYP for 2018–22.Citation16 Cold chain equipment usage was calculated using the annualized value of the cold-chain equipment, storage capacity, percentage of the equipment used for the MR campaign, and the number of days the equipment was used for the campaign. The use of generators as a running cost for the cold chain was calculated using a bottom-up approach. The number of days of MR vaccine storage was multiplied by the hours of generator use per day, fuel usage per hour, and unit price of fuel. Since the usage of the generator is a shared cost, the calculated usage cost was further apportioned using the area of the cold room and the total area of the building.
For economic costing, the number of hours spent for each activity related to the MR campaign was multiplied by the respective hourly wage to calculate the time cost of each activity. The monthly gross salaries of each staff involved in the MR campaign were collected from the payroll divisions. Monthly working hours and the monthly gross salary were used to calculate the hourly wage. Time spent on each MR campaign-related activity was collected through face-to-face interviews with respective staff involved in the activity.
MR campaign used 10-dose vials with lyophilized MR vaccine. For reconstitution, a 5 ml mixing syringe was used, and for the injection, an auto-disable syringe was used. Data on the number of vaccine vials and syringes used at each level were collected from the MR campaign final report at the respective levels. As the number of reconstitution syringes was not included in the MR campaign report, that was calculated by dividing the number of vaccine doses delivered by 10 and assuming 10% wastage. Information on unit prices of vaccines and syringes was collected from the national level.
Total financial and economic costs were aggregated by activity and activity level (state, district, and block). The unit cost per dose at the respective levels (district, block) was estimated by calculating a weighted average delivery cost at each site weighted by the number of doses delivered. Weighted average delivery costs per dose at district and block level were summated with the state-level delivery cost per dose to obtain the total unit cost per dose at the state level. Unit costs borne by immunization partners and the Government of India were then added to obtain the total unit cost per dose.
Ethical approval
This study did not directly involve human subjects. Approval from the International Vaccine Institute’s Institutional Review Board (IRB) was obtained for this study (IVI-IRB No. 2019–002 dated 29/05/2019). The study was also approved by Sigma Institutional Review Board in India (10012/IRB/D/18-19 dated 30/09/2018). In addition, approvals were obtained from the Government of India, Ministry of Health and Family Welfare at the national level, and for each of the states involved (Assam, Gujarat, Himachal Pradesh, and Uttar Pradesh).
Results
Campaign outcomes in the sampled states
Due to the phased manner of the MR campaign, it was implemented at different time points in the sampled states, starting in August 2017 in Himachal Pradesh, July 2018 in Gujarat, August 2018 in Assam, and November 2018 in Uttar Pradesh (). Among the study states, the number of target children was the lowest in Himachal Pradesh (1,807,566) followed by Assam (9,028,321), Gujarat (14,560,089), and Uttar Pradesh (75,719,632).
MR campaign coverage and the duration of the campaign varied significantly across the study states, districts, and blocks. The reported administrative coverage at state level in Assam was 98% (ranged from 93% to 97% in sampled districts), in Gujarat, it was 96% (93% to 98% in sampled districts), in Himachal Pradesh, about 102% (97% to 101%) and in Uttar Pradesh, 99% (97% to 100%). While Himachal Pradesh took 41 days to complete the campaign activities in the whole state, Uttar Pradesh took 86 days, Gujarat 122 days, and Assam 136 days. However, the planning for the campaign started long before the actual campaign. For example, in Himachal Pradesh, planning started an average of 134 days before the campaign was conducted.
In almost all the sampled blocks in Assam, Gujarat, and Uttar Pradesh, some form of vaccine hesitancy was reported. The common forms of hesitancy were from the private or missionary schools, madrasas, and from some hard-to-reach population group. In a few blocks, vaccination was postponed because of strong protests against the campaign. Vaccine hesitancy was the lowest in Himachal Pradesh, where only two out of the total nine sampled blocks reported some hesitancy – one from a slum area and another from private schools. As hesitancy was minimal in Himachal Pradesh, the campaign there went smoothly – which is also reflected in the duration of the campaign in the state.
Financial cost
The only national level financial costs considered in this study were the vaccine and syringe costs. WHO and UNICEF also supported the campaign, mostly from funds channeled through Gavi. Costs incurred for different activities by the partners are presented in Annex 2. Most of the funding channeled through WHO was spent on the hiring of external monitors, followed by the deployment of rapid response team members. The funding channeled through UNICEF has mostly been allocated to the deployment of consultants to support the states and high priority districts, followed by funding for monitoring and supportive supervision, as well as media workshops. Given that the sample sites were not selected to be representative of the state, block, and district level costs were not extrapolated to estimate the total cost of the campaign in each state.
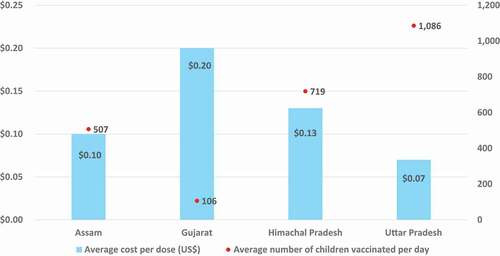
The financial cost per dose during the MR campaign, including costs incurred by the Government of India and funding channeled through WHO and UNICEF costs, is presented in . Total financial MR vaccine delivery cost per dose was highest in Gujarat (INR 24.13; $0.34) and lowest in Uttar Pradesh (INR 10.95; $0.16). compares the number of children vaccinated per day against the cost per dose at block level. It shows that Gujarat had the highest block level cost per dose, while the number of children vaccinated per day in Gujarat was the lowest. Uttar Pradesh had the lowest cost per dose at block level, and the highest number of children vaccinated per day. This is because in Gujarat, as planning units were PHCs, those were sampled for this study. PHCs have lower target children as compared to blocks that were the planning units in other states and were sampled in this study.
Table 2. Financial cost per dose of MR campaign. 2019 US$ (INR)
Figure 2. Financial cost of MR campaign delivery per dose at the block level compared to the average number of children vaccinated per day in 2019 US$.
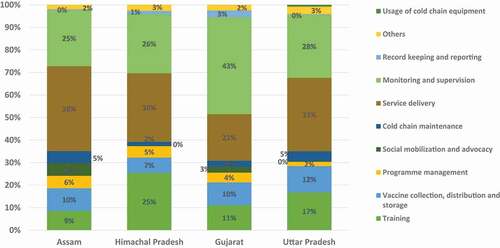
The majority of the financial cost was incurred at the block level. For the government, service delivery, monitoring and supervision, and training were the main financial cost drivers at the block level (). In Gujarat, monitoring and supervision was the biggest financial cost driver, and in other states, it was service delivery. In service delivery, the incentives for the vaccination team were the main cost component.
Figure 3. Financial cost drivers for MR delivery cost by study states.
Economic cost
The economic cost of the MR campaign estimated in one state (Uttar Pradesh) is presented in . The delivery cost per dose of MR campaign for the government was INR 61.40 ($0.87) and including partner support, the same was INR 62.30 ($0.89).
Table 3. Economic cost per dose of MR campaign in Uttar Pradesh, India. 2019 US$ (INR)
Comparison of MR budget versus MR expenditure
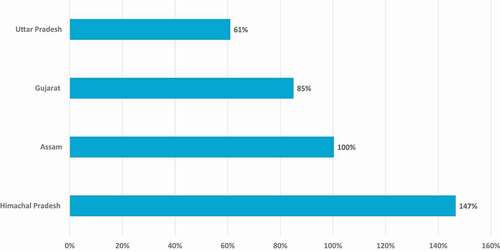
While comparing MR budget provided by the government against the actual MR financial expenditure, it was found that Himachal Pradesh used additional resources beyond the MR budget to complete the MR campaign. In Himachal Pradesh, the actual MR expenditure was 47% higher than MR budget provided by the government to the state (). Assam fully utilized the MR budget, while Gujarat utilized 85% of the budget and Uttar Pradesh utilized 61%.
Figure 4. MR campaign financial expenditures in comparison to the budget provided by government of India.
Discussion
This paper presents the financial cost of conducting MR campaign in four Indian states and the full economic cost in one state. The financial cost per dose incurred by the Government of India (without the cost of vaccine and injection supplies and partner support) ranged from US$0.14 (INR 10.06) to US$0.32 (INR 22.40). Including the Gavi funding channeled through WHO and UNICEF, financial cost per dose ranged from US$0.16 (INR 10.95) to US$0.34 (INR 24.13). The financial cost per dose was the highest in Gujarat, due to a lower denominator, as its sub-block level planning units (PHCs) covered a lower number of children per day than CHCs do in other states. One of the reasons for variations in unit costs at the block level could be because of difficult terrain. Block level unit costs in Himachal Pradesh were generally higher than in Assam and Uttar Pradesh, probably because of the hilly and difficult terrain of the state. Although Assam has hilly and tea estates areas, this may not be adequately represented in our study and true outreach costs of hilly areas may not be reflected. On the other hand, the lowest block level unit cost in Uttar Pradesh was probably because of the higher number of children vaccinated per day. The speed of vaccination and density of children may also have played a role in lowering the financial costs. However, clear reasons for variations in unit costs at different levels did not emerge from the study given the small sample size.
Financial delivery cost per dose estimated for the study states was generally higher (except for Uttar Pradesh) as compared to the government pre-fixed budget per child for the MR campaign, which may indicate that the budget was insufficient. However, the costing exercise demonstrated evidence of utilization of budget from other heads for the MR vaccination campaign in some states. The MR campaign financial guidelines had provided a budget for transportation of vaccine, and travel allowances for the supervisors, but there were other transport requirements. In every block and district, facility staff and officials made several visits to sites where vaccine hesitancy was reported. Those travel expenses were not budgeted under MR. Hence, other budget heads (e.g., routine immunization fund or Rogi Kalyan Samiti budget) were used to cover such campaign expenses. Expenses from other budget heads were not reported under MR expenses, making it underutilization. During data collection, efforts were made to collect these additional expenditure data as much as possible; however, these may not be fully captured because the facility staff did not keep any official record of such travel, and the cost estimation for such additional expenses was based on memory.
Even though the budget was underutilized in Gujarat and Uttar Pradesh, states had to spend money from other sources. Although MR financial guidelines issued by the government provided some flexibility in utilizing MR budget, the states did not use money from other budget heads within the MR budget as it requires permission from higher levels, which is often complex and takes time. Hence, instead of using unused MR fund, they used other funding sources. The process of utilizing different budget heads should be made easier at the state level so that all funds allotted for a program can be fully utilized.
The financial delivery cost per dose as estimated in this study is significantly lower than the global estimates of US$0.80-US$1.00, used by the M&RI and Gavi, though these global estimates may be relatively high as they were mostly based on projected budgets rather than micro-costing studies. The present study estimates are also lower than the unit cost per dose estimated for the cholera vaccination pilot in Odisha state in India (US$ 0.49 per dose in 2011$),Citation10 which may be because that was a pilot project with a very different implementation strategy.
The high economic cost per dose in Uttar Pradesh [$0.89 (INR 62.30)] signified the use of many existing resources to complete the MR campaign, mainly personnel and volunteer time. The campaign was tentatively planned for 4–5 weeks in each state. However, the actual campaign took much longer than the planned period, often due to vaccine hesitancy issues, and planning for the campaign started long before the actual campaign.
Although vaccine hesitancy may lead to an increase in costs, it may not be fully represented in the financial costs. The longer duration of campaigns in Gujarat and Assam did not translate into additional financial costs because incentives paid to the vaccination team or supervision team were capped based on the number of workdays planned during micro-planning, whereas the staff worked for many more days. The impact of vaccine hesitancy on unit cost may have been visible in Uttar Pradesh, the only state where economic costs were collected. However, as all sampled blocks in Uttar Pradesh indicated that they had experienced vaccine hesitancy issues, no-cost comparison could be made.
Limitations
The paper presents MR delivery cost estimates at different levels in four sampled states in India; however, the study has several limitations. First, data collection started a minimum of 1 year after the campaign was completed, and in Himachal Pradesh, it started after 2 years of campaign completion () and is subject to recall bias. Even though data collection for financial cost was mostly from records, it was often not possible to collect detailed financial data at different levels, especially expenditure supported by other budget heads because of transfer of staff. Hence, unit costs estimated in this study might be an underestimation.
Second, because of the fixed financial reporting format at different levels, it was often not possible to gather the detailed breakup of total MR expenditure. Hence, cost drivers could not be calculated at different levels.
Third, there were additional costs incurred for transportation and other purposes that were not initially budgeted. For example, to counter vaccine hesitancy, additional activities were conducted, such as meetings in private schools, and with religious leaders, and for these, additional transportation was required. Those types of costs were not recorded, perhaps partly lost in the recollection, making it an underestimation.
Finally, for estimating the economic cost, time spent was collected through interviews of different categories of staff. Data collection began 1 year after the completion of the campaign. This could have resulted in recall bias in the time spent on different activities related to the MR campaign. To minimize this, whenever possible, additional evidence was collected to verify the time spent. For example, in a few training and meeting registers, information was available on the start and end time of the event, along with the number of participants and proceedings. As we have done economic costing in Uttar Pradesh only, the cost comparison across the states is incomplete.
Conclusion
The present study estimated the delivery cost of the MR campaign in four states in India. Unit cost information generated from this study will be useful for planning, cost projections, and economic analyses of a future vaccination campaign in India. The economic costing data may serve as the foundation for potential cost-effectiveness analysis. The study will also inform the development of methodological guidance on costing immunization campaigns, particularly insights regarding the risks of recall bias, missing data, collecting data related to funding sources outside of campaign budgets, sampling procedures, and associated limitations for data analysis.
Disclosure of potential conflicts of interest
No potential conflicts of interest were disclosed.
Supplemental Material
Download MS Word (32.1 KB)Acknowledgments
We sincerely thank the State immunization officers: Dr. B Goswami (Assam), Dr. N P Jani (Gujarat), Dr. H. Banyal (Himachal Pradesh), and Dr. A P Chaturdevi (Uttar Pradesh), for their continuous support throughout the data collection period in their respective states. We are also grateful to the District Immunization Officers and their facility staff for their cooperation and support in this study. We are grateful to the World Health Organization (India office) and the Unicef India office for sharing the required data with us. We thank team members from the Immunization Technical Support Unit (ITSU) who provided inputs and support for the execution of this work. We have greatly benefitted from the inputs on study design, data analysis, and reporting by Anthony Kinghorn, Craig Burgess, and Annette Ozaltin.
Supplemental data
Supplemental data for this article can be accessed on the publisher’s website at https://doi.org/10.1080/21645515.2021.1961471.
Additional information
Funding
References
- Bassani DG, Kumar R, Awasthi S, Morris SK, Paul VK, Million Death Study Collaborators, et al. Causes of neonatal and child mortality in India: a nationally representative mortality survey. Lancet. 2010;376(9755):1853–60.
- National Operational Guidelines for Introduction of Measles-Rubella Vaccine (Campaign and Routine Immunization). New Delhi (India): Ministry of Health & Family Welfare Government of India; 2016.
- World Health Organization, Regional Office for South-East Asia. Strategic plan for measles elimination and rubella and congenital rubella syndrome control in the South-East Asia Region, 2014-2020. 2015 [cited 2020 30 May]. https://apps.who.int/iris/handle/10665/205923 .
- Murhekar M, Verma S, Singh K, Bavdekar A, Benakappa N, Santhanam S, Sapkal G, Viswanathan R, Singh MP, Nag VL, et al. Epidemiology of Congenital Rubella Syndrome (CRS) in India, 2016-18, based on data from sentinel surveillance. PLoS Negl Trop Dis. 2020;14(2):e0007982. doi:10.1371/journal.pntd.0007982.
- Muliyil DE, Singh P, Jois SK, Otiv S, Suri V, Varma V, Abraham AM, Raut C, Gupta M, Singh MP, et al. Sero-prevalence of rubella among pregnant women in India, 2017. Vaccine. 2018;36(52):7909–12. doi:10.1016/j.vaccine.2018.11.013.
- ThinkWell. Immunization Delivery Costs in Low- and Middle-Income Countries: a descriptive analysis, gap analysis, and summary of immunization delivery unit costs in the literature. 2020 [cited 2021 16 Feb]. https://static1.squarespace.com/static/556deb8ee4b08a534b8360e7/t/5e4e9418dbed0d592f94d8bf/1582208033613/1.+ICAN+Summary+Report_29January20.pdf .
- Gandhi G, Lydon P. Updating the evidence base on the operational costs of supplementary immunization activities for current and future accelerated disease control, elimination and eradication efforts. BMC Public Health. 2014;14(1):67. doi:10.1186/1471-2458-14-67.
- Measles & Rubella Initiative. South-East Asia Plans to Eliminate Measles by 2020. 2013 [cited 2020 July 15]. https://measlesrubellainitiative.org/measles-news/south-east-asia-plans-eliminate-measles-2020/ .
- Gavi. Guidelines for Applications for Measles and Rubella vaccines under Gavi’s New and underused Vaccines Support (NVS) in 2017. 2016 [cited 2020 July 17]. https://www.gavi.org/sites/default/files/temp/gavi_1570474824/English/2017%20Guidelines%20for%20applications%20for%20Measles%20Rubela_Final_Feb17.pdf .
- Kar SK, Sah B, Patnaik B, Kim YH, Kerketta AS, Shin S, Rath SB, Ali M, Mogasale V, Khuntia HK, et al. Mass vaccination with a new, less expensive oral cholera vaccine using public health infrastructure in India: the Odisha model. PLoS Negl Trop Dis. 2014;8(2):e2629. doi:10.1371/journal.pntd.0002629.
- Census of India 2011. Office of the Registrar General & Census Commissioner, India Ministry of Home Affairs, Government of India. 2011 [cited 2021 18 April]. https://censusindia.gov.in/DigitalLibrary/Archive_home.aspx .
- Gavi. India: gavi support. 2020 [cited 2020 July 15]. https://www.gavi.org/programmes-impact/country-hub/south-east-asia/india .
- Chokshi M, Patil B, Khanna R, Neogi SB, Sharma J, Paul VK, Zodpey S. Health systems in India. J Perinatol. 2016;36(s3):S9–S12. doi:10.1038/jp.2016.184.
- Vaughan K, Ozaltin A, Mallow M, Moi F, Wilkason C, Stone J, Brenzel L. The costs of delivering vaccines in low- and middle-income countries: findings from a systematic review. Vaccine: X. 2019;2:100034. doi:10.1016/j.jvacx.2019.100034.
- How to cost immunization programs: a practical guide on primary data collection and analysis: EPIC Project; 2020 [cited 2020 Nov 5]. http://immunizationeconomics.org/costingmethods .
- Universal Immunization Programme. Comprehensive Multi-Year Plan −2018-22. Ministry of Health and Family Wlefare, Government of India; 2018 [cited 2020 Jul 7]. https://nhm.gov.in/New_Updates_2018/NHM_Components/Immunization/Guildelines_for_immunization/cMYP_2018-22_final_pdf.