
ABSTRACT
In March 2020, the first pandemic caused by a coronavirus was declared by the World Health Organization. Italy was one of the first and most severely affected countries, particularly the northern part of the country. The latest evidence suggests that the virus could have been circulating, at least in Italy, before the first autochthonous SARS-COV-2 case was detected in February 2020. The present study aimed to investigate the presence of antibodies against SARS-CoV-2 in human serum samples collected in the last months of 2019 (September–December) in the Apulia region, Southern Italy. Eight of 455 samples tested proved positive on in-house receptor-binding-domain-based ELISA. Given the month of collection of the positive samples, these findings may indicate early circulation of SARS-CoV-2 in Apulia region in the autumn of 2019. However, it cannot be completely ruled out that the observed sero-reactivity could be an unknown antigen specificity in another virus to which subjects were exposed containing an epitope adventitiously cross-reactive with an epitope of SARS-CoV-2.
KEYWORDS:
Introduction
On 11 March 2020, the Director-General of the World Health Organization (WHO) declared the first pandemic caused by a coronavirus; since the end of February, the number of cases had dramatically increased worldwide, with more than 118,000 cases recorded in 114 countries and 4,291 deaths.Citation1
The initial epidemic originated in Wuhan, China, where cases of pneumonia of unknown etiology were reported to have occurred in late December 2019. On 7 January 2020, a new coronavirus was isolated and later named Severe Acute Respiratory Syndrome Coronavirus 2 (SARS-CoV-2) by the WHO, since it was genetically related to the coronavirus responsible for the 2003 SARS outbreak. The disease caused by SARS-CoV-2 was named COVID-19 (Coronavirus Disease).Citation2
SARS-CoV-2 expresses a spike (S) protein that plays an essential role in viral attachment, fusion, entry and transmission. Specifically, the S protein contains the receptor-binding domain (RBD), which is the most distinct part and an immunogenic target of the immune response against SARS-CoV-2. Antibodies that bind the RBD seem to neutralize the ability of the virus to infect cells. Another protein is the nucleoprotein (NP), which is unlikely to be involved in virus neutralization (VN); however, antibodies against the NP protein could provide information on exposure to the virus.Citation3
Infected subjects develop mainly two isotypes of specific-antibodies: IgM and IgG. IgM are usually detected before IgG, peaking between weeks two and five and decreasing over a further three to 5 weeks after symptom onset. IgG peaks between weeks three and seven after the onset of symptoms and persists for at least 8 weeks. Neutralizing antibodies are detectable from 7 to 15 days after disease onset, increase until days 14–22, reach a plateau and then decline. Antibody levels seem to be lower in asymptomatic subjects and patients with clinically mild disease.Citation4
In addition to IgM and IgG, SARS-CoV-2 infection induces the production of IgA within 2–3 weeks from onset of symptoms, representing the predominant isotype in early disease, and decline by day 28.Citation5–8
The main route of transmission is through respiratory droplets shed by infectious subjects. However, close contact with objects or surfaces contaminated with the virus may also be an occasional means of transmission. COVID-19 presents a wide range of symptoms—mainly fever, cough, lost/altered senses of taste or smell, and headache—which may appear 2–14 days after exposure to the virus.Citation9–12
The WHO reported that most SARS-CoV-2 infections (80%) are mild or asymptomatic, 15% severe and 5% critical.Citation13 The role of asymptomatic subjects is still debated. Indeed, the contribution of asymptomatic subjects to the spread of the virus remains uncertain, since it has been reported that these subjects are less likely to transmit the virus than those who are symptomatic.Citation14–17
On 22 February 2020, clusters of COVID-19 cases were reported in the Lombardy Region, Italy, by the Italian authorities; following epidemiological investigation, transmission was assumed to be local rather than being caused by people traveling to or returning from affected areas.Citation18 In the first epidemic wave, Italy was one of the first and most severely affected countries, particularly the northern part of the country, with the Lombardy Region reporting 43% of all confirmed cases, followed by Emilia-Romagna (13.9%), Veneto (9.6%) and Piedmont (7.6%).Citation19 On 9 March 2020, the Italian Government declared a national lockdown aimed at reducing the epidemic in the North and preventing the spread of the virus throughout the country, as the Central and Southern Regions were only marginally affected at the beginning of the epidemic. Nevertheless, although the social restrictions implemented in Italy proved effective in flattening the COVID-19 epidemic curve,Citation20 the second epidemic wave was only delayed.
In Italy, from 3 January 2020 to 1 July 2021, 4,259,133 cases of COVID-19 were confirmed, with 127,542 deaths, as reported by the WHO.Citation21 Currently, the virus seems to hit every age-group. At the beginning of the pandemic, most cases were recorded among the elderly; however, since the virus has spread, younger people have been affected in greater numbers.Citation22 The mortality rate is higher in the elderly, being 20.1% in people between 80 and 89 years of age, and the most commonly reported comorbidities in deceased patients are hypertension, type-2 diabetes and ischemic heart disease.Citation22,Citation23 Overall, the Italian mortality rate is higher than that registered in most countries.Citation24
Apulia is a large Southern Italian region with a population of roughly 4 million. The first case of COVID-19 was found in the Province of Taranto on 26 February 2020 and involved a 44-year-old man who had returned from a known epidemic area. During the first wave of the epidemic, between February and May 2020, Apulia was only marginally affected by COVID-19. However, during the second wave, which started roughly in September 2020, the region saw a steady increase in cases, with 5,873 deaths and a total of 234,841 cases, by April 2021.Citation25
The present study aimed to investigate the presence of antibodies against SARS-CoV-2 in human serum samples collected in the last months of 2019 in the Apulia Region, Southern Italy.
Materials and methods
Study population
Human serum samples were collected from late September to the end of December 2019 in a town with about 60,000 inhabitants in the Province of Bari. In compliance with Italian ethics law, serum samples were anonymously collected as residual samples for unknown diagnostic purposes and stored at the Molecular Epidemiology laboratory of the University of Siena, Italy. For each serum sample, the subject’s age and sex, and the month of collection were available.
As the prevalence of the disease in the population is unknown, an arbitrary prevalence of 50% was assumed. A sample size of 385 serum samples was required, assuming a precision of the estimate of 5% and a confidence interval of 95% in a large population.
A total of 455 human serum samples were collected and stratified by sex and age-group, as shown in . The mean age of the study population was 46 years, with a range of 8–95 years; 64.4% of samples were from female subjects (sex ratio 1:1.8).
Table 1. Study population: samples collected in the Province of Bari (Apulia, Southern Italy) from September to December 2019, by sex and age-group
Serological assay
Commercial ELISA
Study samples were first tested by a commercial ELISA, Enzywell SARS-CoV-2 IgA, IgM, IgG (DIESSE, Siena, Italy), for the detection of IgA, IgG, and IgM antibodies against SARS-CoV-2. According to the manufacturer, Enzywell ELISAs are based on SARS-CoV-2 inactivated native antigen and use monoclonal anti-human IgA, IgG or IgM antibody as secondary antibody. The DIESSE manufacturer ensures 93.7% sensitivity and 96.3% specificity for IgA ELISA, 92.5% sensitivity and 95.8% specificity for IgG ELISA, and 87.7% sensitivity and 97.0% specificity for IgM ELISA. According to the manufacturer’s instructions, samples were considered positive when the ratio between the optical density (OD) of the sample and that of the cutoff was >1.1, negative if the ratio was <0.9 and borderline if the ratio was between 0.9 and 1.1.
In order to further test the specificity of the commercial ELISA, 64 serum samples collected in 2018 in the Apulia Region were tested for IgG and IgM.
Study samples collected in 2019 that yielded a borderline or positive result for IgG or IgM on Enzywell ELISA were further tested by Aeskulisa® SARS-CoV-2 S1 IgM and IgG and NP IgG (Aesku. Diagnostics, Wendelsheim, Germany) for the detection of IgG and IgM against the S1 and of IgG against the NP (). According to the manufacturer, ELISA revelation is based on polyclonal anti-human IgG or IgM antibody as secondary antibody. Aesku.Diagnostics ensures 98.6% sensitivity and >99% specificity for S1 IgG ELISA, >99% sensitivity and >99% specificity for S1 IgM ELISA, and 95.2% sensitivity and >99% specificity for NP IgG ELISA. Quantitative analysis was performed by means of a 4-parameter logistic standard curve that was obtained by plotting the OD values measured for four calibrators against their antibody activity (U/ml) using logarithmic/linear coordinates. Antibody activities of the samples were evaluated from OD values by using the curve generated and were considered positive if >12 U/ml.
Figure 1. Schematic representation for down-selecting samples based on the ELISAs.
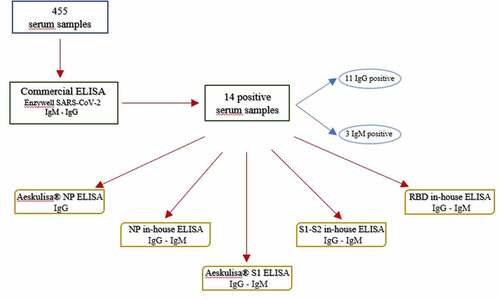
Study samples with a borderline or positive result for IgG and IgM on Enzywell ELISA were also tested by in-house ELISAs targeting the S protein, the NP, and RBD and by VN assay ().
In-House ELISAs
The in-house ELISAs were performed as previously reported by Mazzini et al.Citation26
Briefly, ELISA plates (Nunc, Maxi-Sorp) were coated with either 1 µg/mL of purified recombinant spike-RBD HEK-derived protein (Sino Biological, China), or 1 µg/mL of purified recombinant Nucleocapsid (Sino Biological, China) or 1 µg/mL of purified recombinant spike S1-S2 ECD (Sino Biological, China). Human serum samples were heat-inactivated, diluted 1:100 in TBS-0.05% Tween 20 5%; 100 µl of each serum dilution was then added to the coated plates and incubated for 1 h at 37°C. After the washing step, polyclonal goat anti-Human IgG-Fc (code A80-104P, Bethyl Laboratories Montgomery USA) or IgM μ-chain (code A80-100P, Bethyl Laboratories Montgomery USA) HRP-conjugated antibody was added and the plates were incubated at 37°C for 30 min. After the washing step, 3,3′,5,5′-Tetramethylbenzidine (TMB) substrate (Bethyl Laboratories, Montgomery, USA) was added and the plates were incubated in the dark at room temperature for 20 min.
The reaction was stopped and read at 450 nm.
A cutoff value of each plate was obtained by multiplying by three the blank OD signal derived from six micro-wells containing sample diluents and secondary HRP-antibody without the addition of analyte. The ELISA cutoff was established internally through a blind study of symptomatic and asymptomatic subjects positive on molecular swabs testing. The IgM and IgG results were calculated by relating each specimen OD value to the respective cutoff value of the plate. The results were then expressed as the OD ratio and considered positive when >1. Samples with ODs below the cutoff value were deemed negative, while samples in which ODs were above the cutoff value were deemed positive.
Samples testing positive on RBD-based ELISA were further tested with 2-fold dilutions from 1:100 to 1:1600. The RBD-ELISA titer was defined as the highest serum dilution showing positivity.
In order to further test the specificity of in-house RBD ELISA (hereafter referred to as RBD ELISA), we tested the following samples (): 64 serum samples collected in 2018 in the Apulia region, 18 human samples provided by BioIVT (West Sussex, United Kingdom) that had tested positive to different human coronaviruses (CoVs) (229E, HKU, OC43 and NL63) and in which non-SARS-CoV-2 virus cross-reactivity had been confirmed, 17 serum samples from asymptomatic subjects positive for SARS-CoV-2 on rhino-pharyngeal swab testing and collected as part of the UNICORN projectCitation27 and 8 human samples from COVID-19 convalescent patients provided by Cambridge Bioscience.
Table 2. Samples tested by in-house RBD ELISA
Virus neutralization assay
The VN assay was performed as previously reported.Citation28 Briefly, serum samples were heat-inactivated for 30 min at 56°C then mixed in a 1:5 ratio with a SARS-CoV-2 viral solution containing 100 Tissue Culture Infective Dose 50% (TCID50) or 25 TCID50 of virus (final volume 120 µl). After 1 h of incubation at 37°C 5% CO2, 100 µl of each virus-serum mixture was added to a 96-well plate containing an 80% confluent Vero E6 cell monolayer. Plates were incubated for 3 days at 37°C 5% CO2 in a humidified atmosphere, then inspected for the presence/absence of cytopathic effect (CPE) by means of an inverted optical microscope. A CPE higher than 50% indicated infection. The viral titer was calculated using the Reed-Muench method.
Statistical analysis
The median age of both the study population and positive subjects was calculated, and samples were stratified by age-group and sex. Age- and sex- prevalence rates were calculated, together with their corresponding 95% confidence intervals (95% CI). Comparison for age- and sex-prevalence rates as well as 2018, 2019, and positive to other CoVs samples was performed by use of Yates’ corrected chi-square test or Fisher’s exact test. Statistical significance was set at p < 0.05, two-tailed.
All statistical analyses were performed by means of GraphPad Prism 6 software.
Results
Of 455 human serum samples collected from September to December 2019 in the Apulia region, Southern Italy, and tested by commercial Enzywell ELISA, 11 (2.4%, 95% CI 1.3–4.3) were positive for IgG, 3 (0.7%, 95% CI .2–2.0) for IgM, and 3 (0.7%, 95% CI .2–2.0) for IgA.
Samples were not further tested for IgA.
The 14 IgG/IgM-positive samples were further tested; the results are shown in .
Table 3. Information on sex, age, and month of collection of samples collected from September to December 2019 in Apulia and positive to commercial Enzywell ELISA by antibody class (IgG/igM). These samples were further tested by commercial Aeskulisa® NP- and S1-based ELISAs and by in-house NP-, S1-S2, and RBD-based ELISAs. A serum titration was further performed for samples positive to in-house RBD-based ELISA. Serological results for commercial Aeskulisa® and in-house ELISAs by antigen and by antibody class are presented
For the purpose of this study, only samples that tested positive on RBD ELISA were considered positive as the RBD is the most distinct part and an immunogenic target of the immune response against SARS-CoV-2.
Eight (8) samples (1.8%, 95% CI .9–3.4) tested positive on RBD-ELISA; 5 (1.1%, 95% CI .45–2.6) for IgG and 3 (0.7%, 95% CI .2–1.9) for IgM.
RBD ELISA-positive samples showed antibody titers ranging from 1/200 to 1/800 for IgG and from 1/100 to 1/200 for IgM. One (1) sample was collected in September, 2 in October, 2 in November, and 3 in December ().
All samples that were IgM-positive on Enzywell ELISA were confirmed positive on RBD ELISA, with a titer between 1/200 and 1/100. One of these samples, number 14, female, collected in December 2019, was also positive on Aeskulisa® NP and in-house ELISA NP for IgG, on in-house ELISA NP for IgM and on Aeskulisa® S1 ELISA for IgM.
Out of 11 samples positive on Enzywell ELISA, 5 were also positive on RBD IgG, with a titer between 1/200 and 1/800 ().
Three of 11 samples appeared to be of particular interest. One sample, number 7 (from a 38-year-old man and collected in November 2019) was also positive on in-house ELISA NP for IgM, Aeskulisa® S1 ELISA IgG and S1-S2 in-house ELISA IgG. This sample had the highest titer when tested by RBD ELISA.
Sample 5, collected in October from a 48-years-old woman, was also positive on Aeskulisa® NP ELISA and in-house NP ELISA for IgG.
Sample 2 (female, collected in October 2019), was also positive on in-house NP ELISA for IgM and IgG, and on in-house S1-S2 ELISA for IgM.
The median age of the positive subjects was 41.5 years (range 16–61 years). Two (2) samples were from male subjects (1.2%, 95% CI 0.1–4.4 of the male population) and 6 from females (2.0%, 95% CI 0.7–4.4 of the female population), with a sex ratio of 1:3.
No significant differences were observed between sexes or among age-groups.
All these samples were negative on VN assay.
Of the samples collected in 2018 and tested by Enzywell ELISA, 2 tested positive for IgG and none for IgM (data not shown). These two Enzywell ELISA IgG positive samples did not prove positive on RBD ELISA.
The results of IgG and IgM RBD ELISAs are reported in .
Figure 2. OD values of the samples tested by IgG RBD ELISA; panel 2a: samples collected in 2018 in the Apulia region (2018 samples); panel 2b: human samples positive to other human CoVs (Other CoVs);panel 2c: samples from asymptomatic subjects (Asymptomatic); panel 2d: samples from COVID-19 convalescent patients (Convalescent); panel 2e: samples collected in 2019 in the Apulia region (2019 samples). Dots indicate individual serum samples, dashed lines indicate the OD value of the cutoff. For 2018 samples, arrow indicates consecutive numbering from sample 1 to sample 64.
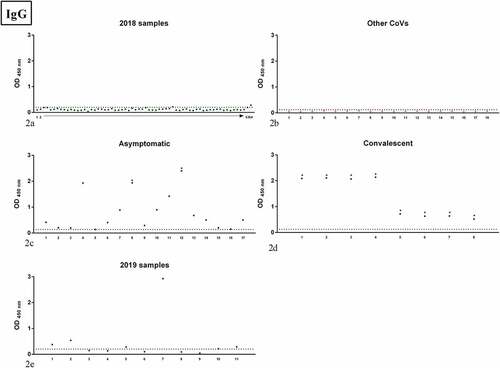
Figure 3. OD values of the samples tested by IgM RBD ELISA; panel 3a: samples collected in 2018 in the Apulia region (2018 samples); panel 3b: human samples positive to other human CoVs (Other CoVs); panel 3c: samples from COVID-19 convalescent patients (Convalescent); panel 3d: samples collected in 2019 in the Apulia region (2019 samples). Dots indicate individual serum samples, dashed lines indicate the OD value of the cutoff. For 2018 samples, arrow indicates consecutive numbering from sample 1 to sample 64.
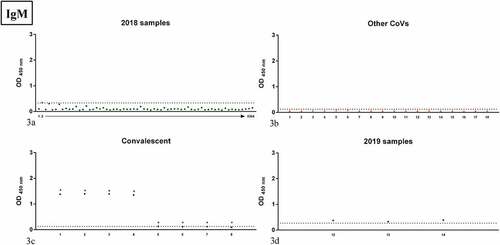
Of the samples collected in 2018, 2 proved positive for IgG and 1 for IgM on RBD ELISA (), while no positivity was detected in samples positive for other CoVs ().
Comparison of 2018 positive samples versus 2019 ones for Enzywell ELISA was not statistically significant (p = 1 for total Ig, p = 1 for IgM, and p = 0.6678 for IgG, Fishers exact test), as well as comparison of 2018 positive samples versus 2019 ones for RBD ELISA (p = 0.143 for total Ig, p = 0.4103 for IgM, and p = 0.2094 for IgG, Fishers exact test).
Comparison of 2018 samples versus samples positive to other CoVs for RBD ELISA was not significant (p = 1 Fishers exact test for either IgM or IgG), as well as comparison of 2019 samples versus samples positive to other CoVs for RBD ELISA (p = 1 Fishers exact test for both IgM and IgG).
Asymptomatic subjects who had tested positive on commercial ELISA in a previous studyCitation29 were also positive on IgG RBD ELISA (); notably, 2 of these were also positive on VN assay. All serum samples from convalescent patients positive on IgG RBD ELISA () were also positive on VN assay, with titers ranging from 10 to 320. Serum samples collected in Apulia in 2019 are reported in . Although these sera were negative on VN, the IgG RBD ELISA ODs were similar to those of sera from convalescents, with one sample well above the highest titers found in convalescents.
RBD ELISA IgM titers are shown in . In , all but 1 of the Apulia 2018 samples proved negative. Samples positive for other CoVs were all negative. Half of the convalescent patients were positive on both RBD ELISA () and VN. Samples collected in Apulia 2019 and positive on RBD ELISA are shown in .
Discussion
In this study, out of 455 serum samples collected from September to December 2019 in the Apulia region, in Southern Italy, 8 tested positive for IgG (1.1%) or IgM (0.7%) SARS-CoV-2 on RBD ELISA. These results were somewhat unexpected and can be interpreted in different ways. First, the findings of this study may suggest that SARS-CoV-2 was circulating in Apulia well before the first SARS-CoV-2 index case was reported in Italy in February 2020. Second, the possibility that we have detected, in a limited number of subjects, nonspecific antibodies able to bind the RBD of SARS-CoV-2 cannot be ruled out.
It is recognised that SARS-CoV-2 infection in humans generates a predominant antibody response mainly against the S protein and, in particular, against the RBD.Citation30–32 RBD ELISA has been used as a tool to characterize the immune response to SARS-CoV-2 in previous studiesCitation30,Citation32–38 and it is shown to correlate with neutralizing antibodies.Citation35
The fact that all the samples in our study who were positive on RBD ELISA, either for IgG or IgM, were negative on VN assay may suggest that cross-reactive antibodies were detected. However, the consideration that all samples in the panel of other human CoVs as well as all but three samples collected in Apulia in 2018 tested negative on IgG and IgM RBD ELISA reduces the possibility that the antibodies detected in this study were all cross-reactive.
In our study 3 samples seem to be of interest, in that they proved positive to other assays than RBD ELISA. Sample number 7 (positive on IgG RBD ELISA), collected in November 2019, showed IgG positivity for the S1/S2 protein (commercial and in-house ELISAs) and IgM positivity for the NP protein (in-house ELISA). As reported by the CDC,Citation39 if vaccination status is unknown—and in this case we are sure that the subject had not undergone SARS-CoV-2 vaccination—antibodies against the S and NP proteins can be ascribed to a previous infection, even though false-positive results cannot be ruled out. This sample showed the highest OD value when tested by RBD ELISA, even when compared with asymptomatic and convalescent patients. Another interesting sample is the number 5 (positive on IgG RBD ELISA), collected in October, which was positive for NP IgG when tested by commercial and in-house ELISAs. Finally, sample number 14 (positive on IgM RBD ELISA), collected in December 2019, proved positive for NP IgG (commercial and in-house ELISAs), NP IgM (in-house ELISA) and S1 IgM (commercial ELISA). Admittedly, we cannot exclude false-positive results and/or the presence of non-SARS-CoV-2 antibodies able to bind the RBD. However, the above-mentioned samples cannot completely rule out the hypothesis that the virus was circulating in Apulia region since October/November 2019. Notably, Kumar et al.Citation40 suggest that the SARS-CoV-2 progenitor was spreading worldwide months before its first detection, dating its presence to late-October 2019. We cannot completely discard the hypothesis that the RBD-reactive antibodies detected might indicate an immune response against SARS-CoV-2, perhaps a less infective progenitor that spread much more slowly than the subsequent variant responsible for the pandemic.Citation41
The further comparison of the samples included in this study with other samples tested positive for IgG or IgM RBD ELISA, in particular asymptomatic subjects and convalescent patients, can be of support to the true positivity of Apulia 2019 samples.
As reported by the WHO,Citation42 90–99% of subjects infected by SARS-CoV-2 develop neutralizing antibodies within 2–4 weeks after infection. However, for reasons yet unclear, a small proportion of subjects do not develop neutralizing antibodies after SARS-CoV-2 infection. Mild or asymptomatic infections tend to show lower antibody levels than severe disease, suggesting that the severity of the disease might play a key role in raising neutralizing antibody levels.Citation43, Citation63 It is most likely that asymptomatic subjects who do not develop any disease have an incomplete humoral response that includes neutralizing antibodies.Citation44 The lack of neutralizing antibodies, or at least at detectable levels, in our data might be explained by the fact that these subjects may be asymptomatic. Humoral response in asymptomatic subjects is still debated. Some studies have detected RBD antibodies in essentially all asymptomatic subjects, although at lower levels than in patients with more severe disease.Citation45, Citation63 In our previous study,Citation29 only 2 of 25 asymptomatic subjects with rhino-pharyngeal swab positive for SARS-CoV-2 had detectable neutralizing antibodies. In another study, 15/16 asymptomatic patients did not have neutralizing antibodies at detectable levels.Citation44 It is also important to consider that the capacity of the antibodies to bind to the RBD domain or to the S protein is required, but not sufficient, to mediate neutralization activity.Citation46 Asymptomatic and non-hospitalized subjects display highly heterogeneous responses to SARS-CoV-2 in comparison with hospitalized patients. Although, all subjects and patients can produce specific antibodies against the RBD domain after SARS-CoV-2 infection, these antibodies may have insufficient avidity or concentration for blocking the RBD binding to ACE2.Citation63
Our results are in line with those of other studies that speculated that SARS-CoV-2 virus was circulating in Italy and in other parts of the world before the first detection in China in December 2019. SARS-CoV-2 virus was isolated in some studies conducted in Italy in untreated wastewaters;Citation47, Citation48 these revealed the presence of SARS-CoV-2 in late December 2019 in the Lombardy and Piedmont Regions, in January 2020 in Emilia-Romagna and again in Lombardy in February 2020, a few days after the first Italian case was identified. Previous unnoticed circulation was also suggested by four serological studies.Citation35,Citation43,Citation49,Citation50 The first of theseCitation35 found that 11.6% of asymptomatic subjects nationwide had SARS-CoV-2 RBD-specific antibodies as early as September 2019. The other two,Citation43,Citation49 conducted in northern Italy, indicated that SARS-CoV-2 circulated in Italy before or at the start of the outbreak. Notably, Percivalle et al.Citation43 found that 2% of samples collected from 27 January to 20 February 2019 showed neutralizing antibodies against SARS-CoV-2. The third study,Citation50 which was conducted in Tuscany, central Italy, found 1.7% of positive individuals and, in particular, one positive subject in November 2019. Other evidence comes from studies performed in Lombardy; these reported SARS-CoV-2 RNA in an oro-pharyngeal swab specimen from a child in early December 2019, COVID-19-related dermatosis in a woman in November 2019 and positivity for SARS-CoV-2 RNA in a sample collected in September 2019.Citation51–53 Molecular epidemiological tracing has suggested that the virus entered Italy weeks before the first cases were identified.Citation54 Moreover, cases of pneumonia of unknown etiology were reported from November 2019 to January 2020 by local health units in northern Italy; as the new virus as yet unknown, these cases were attributed to an aggressive form of seasonal influenza.Citation55
Conversely, other studies, conducted in central (Lazio region) and southern (Apulia region) Italy, did not detect SARS-CoV-2 circulation from November 2019 to March 2020.Citation56–58 Notably, the study conducted in Apulia focused on young children (aged <5 years), an age-group not included in our study, who was less affected by this virus in the initial period of the pandemic.
International studies have also investigated the potential early circulation and/or detection of the virus. A retrospective analysis of a respiratory sample from a patient hospitalized in December 2019 in an intensive care unit in Paris showed that the patient had SARS-CoV-2 infection, suggesting that the virus was already circulating in France at the end of December 2019.Citation59 Another study found positive samples collected between November 2019 and January 2020 from a general population-based cohort.Citation60 Moreover, a study conducted in China suggested early circulation in the autumn of 2019 in Wuhan, China.Citation61 In addition, a sero-monitoring of SARS-CoV-2 in New York City suggested that the virus had probably been introduced into the city several weeks earlier than previously documented.Citation38 Finally, reactive antibodies were found in archived serum samples from some of the US States in December 2019, indicating that the virus may have already been present in the US at that time.Citation62
This study has some limitations. Firstly, owing to the nature of the study, we did not have any information on the health status and travels of the subjects involved in this study and we lacked paired samples (swab and serum). Secondly, the number of all samples tested was fairly small. Thirdly, samples were collected in a single town with 60,000 inhabitants in the Province of Bari (Apulia, Southern Italy) which may have introduced some bias. The NP is also a biomarker for infection and considering only samples tested positive on RBD ELISA could underestimate the true seroprevalence. In addition, we cannot exclude that the observed sero-reactivity could be an unknown antigen specificity in another virus to which subjects were exposed containing an epitope adventitiously cross-reactive with an epitope of SARS-CoV-2.
In conclusion, our findings might support the emerging hypothesis that SARS-CoV-2 was circulating in Italy in the last months of 2019 (October–December), before the first SARS-COV-2 case was detected in Italy (in February 2020). However, we cannot rule completely out the possibility that we detected preexisting, non-SARS-CoV-2, antibodies that were able to aspecifically bind the RBD of SARS-CoV-2 virus.
This study highlights the importance of seroepidemiological surveys as a critical approach to investigating the dynamics of emerging pathogens and provides information on antibody responses. However, further research and testing are needed in order to validate the hypothesis of an earlier emergence and circulation of SARS-CoV-2 than documented so far.
Acknowledgments
The authors thank Livia Mazzini for her technical support.
Disclosure statement
No potential conflict of interest was reported by the author(s).
Additional information
Funding
References
- World Health Organization. WHO Director-General’s opening remarks at the media briefing on COVID-19 - 11 March 2020. [accessed 2021 Nov 29]. https://www.who.int/dg/speeches/detail/who-director-general-s-opening-remarks-at-the-media-briefing-on-covid-19—11-march-2020.
- World Health Organization. Naming the coronavirus disease (COVID-19) and the virus that causes it. 2020. [accessed 2021 Nov 29]. https://www.who.int/emergencies/diseases/novel-coronavirus-2019/technical-guidance/naming-the-coronavirus-disease-covid-2019-and-the-virus-that-causes-it
- den Hartog G, Schepp RM, Kuijer M, GeurtsvanKessel C, van Beek J, Rots N, Koopmans MPG, van der Klis FRM, van Binnendijk RS. SARS-CoV-2-Specific antibody detection for seroepidemiology: a multiplex analysis approach accounting for accurate seroprevalence. J Infect Dis. 2020;222(9):1452–9. doi:10.1093/infdis/jiaa479. PMID: 32766833.
- eCDC. Immune responses and immunity to SARS-CoV-2. 2021 29/11/2021]. [accessed 2021 Nov 29]. https://www.ecdc.europa.eu/en/covid-19/latest-evidence/immune-responses.
- Zervou FN, Louie P, Stachel A, Zacharioudakis IM, Ortiz-Mendez Y, Thomas K, Aguero-Rosenfeld ME. SARS-CoV-2 antibodies: IgA correlates with severity of disease in early COVID-19 infection. J Med Virol. 2021;93(9):5409–15. doi:10.1002/jmv.27058. PMID: 3393229.
- Sterlin D, Mathian A, Miyara M, Mohr A, Anna F, Claer L, Quentric P, Fadlallah J, Devilliers H, Ghillani P et al. IgA dominates the early neutralizing antibody response to SARS-CoV-2. Sci Transl Med. 2021 PMID: 33288662;13(577):eabd2223. doi:10.1126/scitranslmed.abd2223.
- Quinti I, Mortari EP, Fernandez Salinas A, Milito C, Carsetti R. IgA antibodies and IgA deficiency in SARS-CoV-2 infection. Front Cell Infect Microbiol. 2021;11:655896. doi:10.3389/fcimb.2021.655896. PMID: 33889552.
- Blackberg A, Fernstrom N, Sarbrant E, Rasmussen M, Sunnerhagen T, Zivkovic AR. Antibody kinetics and clinical course of COVID-19 a prospective observational study. PLoS One. 2021;16(3):e0248918. doi:10.1371/journal.pone.0248918. PMID: 33750984.
- Morawska L, Cao J. Airborne transmission of SARS-CoV-2: the world should face the reality. Environ Int. 2020;139:105730. doi:10.1016/j.envint.2020.105730. PMID: 32294574.
- Zhu N, Zhang D, Wang W, Li X, Yang B, Song J, Zhao X, Huang B, Shi W, Lu R et al. A novel coronavirus from patients with pneumonia in China, 2019. N Engl J Med. 2020;382(8):727–33. doi:10.1056/NEJMoa2001017. PMID: 31978945.
- Huang C, Wang Y, Li X, Ren L, Zhao J, Hu Y, Zhang L, Fan G, Xu J, Gu X et al. Clinical features of patients infected with 2019 novel coronavirus in Wuhan, China. Lancet. 2020;395(10223):497–506. doi:10.1016/S0140-6736(20)30183-5. PMID: 3198626.
- Young BE, Ong SWX, Kalimuddin S, Low JG, Tan SY, Loh J, Ng OT, Marimuthu K, Ang LW, Mak TM et al. Singapore novel coronavirus outbreak research, epidemiologic features and clinical course of patients infected with SARS-CoV-2 in Singapore. Jama. 2020;323(15):1488–94. doi:10.1001/jama.2020.3204. PMID: 32125362.
- World Health Organization, Coronavirus disease 2019 (COVID-19) Situation Report – 46. [accessed 2021 Nov 13]. https://apps.who.int/iris/handle/10665/331443
- World Health Organization. Transmission of COVID-19 by asymptomatic cases. 2021 29 Nov]. [accessed 2021 Nov 13]. http://www.emro.who.int/health-topics/corona-virus/transmission-of-covid-19-by-asymptomatic-cases.html.
- Nogrady B. What the data say about asymptomatic Covid Infections. Nature. 2020 PMID: 33214725;587(7835):534–35. doi:10.1038/d41586-020-03141-3.
- Pollock AM. Asymptomatic transmission of covid-19. thebmj. 2020;371(m4851):1–2. doi:10.1136/bmj.m4851.
- Nikolai LA, Meyer CG, Kremsner PG, Velavan TP. Asymptomatic SARS Coronavirus 2 infection: invisible yet invincible. Int J Infect Dis. 2020;100:112–16. PMID: 32891737. doi:10.1016/j.ijid.2020.08.07.
- eCDC. Threat assessment brief: outbreak of novel coronavirus disease 2019 (COVID-19): situation in Italy. 2020.
- Istituto Superiore di Sanità, EPIDEMIA COVID-19. Aggiornamento nazionale 2 Aprile 2020. 2020.
- Vicentini C, Bordino V, Gardois P, Zotti CM. Early assessment of the impact of mitigation measures on the COVID-19 outbreak in Italy. Public Health. 2020;185:99–101. PMID: 32593056. doi:10.1016/j.puhe.2020.06.028.
- WHO. Italy: WHO Coronavirus disease (COVID-19) dashboard 2021. [ accessed 2021 Nov 29]. https://covid19.who.int/region/euro/country/it.
- Statistica. Distribution of coronavirus cases in Italy as of June 23, 2021, by age group. [2021 Nov 19]. https://www.statista.com/statistics/1103023/coronavirus-cases-distribution-by-age-group-italy/
- Statistica. Most common comorbidities observed in coronavirus (COVID-19) deceased patients in Italy as of July 22, 2020. [accessed 2021 Nov 19] https://www.statista.com/statistics/1110949/common-comorbidities-in-covid-19-deceased-patients-in-italy/.
- Statistica. Coronavirus (COVID-19) death rate in Italy as of April 21, 2021, by age group. [ accessed 2021 Nov 13] https://www.statista.com/statistics/1106372/coronavirus-death-rate-by-age-group-italy/.
- Ministero della Salute. Covid-19 - Situazione in Italia. 2020 April 12. [ accessed 2021 Nov 29]. http://www.salute.gov.it/portale/nuovocoronavirus/dettaglioContenutiNuovoCoronavirus.jsp?area=nuovoCoronavirus&id=5351&lingua=italiano&menu=vuoto
- Mazzini L, Martinuzzi D, Hyseni I, Benincasa L, Molestti E, Casa E, Lapini G, Piu P, Trombetta CM, Marchi S et al. Comparative analyses of SARS-CoV-2 binding (IgG, IgM, IgA) and neutralizing antibodies from human serum samples. J Immunol Methods. 2021;489:112937. doi:10.1016/j.jim.2020.112937. PMID: 33253698.
- Milani GP, Dioni L, Favero C, Cantone L, Macchi C, Delbue S, Bonzini M, Montomoli E, Bollati V, Consortium U. Serological follow-up of SARS-CoV-2 asymptomatic subjects. Sci Rep. 2020;10(1):20048. doi:10.1038/s41598-020-77125-8. PMID: 33208819.
- Manenti A, Maggetti M, Casa E, Martinuzzi D, Torelli A, Trombetta CM, Marchi S, Montomoli E. Evaluation of SARS-CoV-2 neutralizing antibodies using a CPE-based colorimetric live virus micro-neutralization assay in human serum samples. J Med Virol. 2020;92(10):2096–104. doi:10.1002/jmv.25986. PMID: 32383254.
- Marchi S, Viviani S, Remarque EJ, Ruello A, Bombardieri E, Bollati V, Milani GP, Manenti A, Lapini G, Rebuffat A et al. Characterization of antibody response in asymptomatic and symptomatic SARS-CoV-2 infection. PLoS One. 2021;16(7):e0253977. doi:10.1371/journal.pone.0253977. PMID: 34214116.
- Amanat F, Stadlbauer D, Strohmeier S, Nguyen THO, Chromikova V, McMahon M, Jiang K, Arunkumar GA, Jurczyszak D, Polanco J et al. A serological assay to detect SARS-CoV-2 seroconversion in humans. Nat Med. 2020;26(7):1033–36. doi:10.1038/s41591-020-0913-5. PMID: 32398876.
- Lv H, Wu NC, Tsang OT, Yuan M, Perera R, Leung WS, So RTY, Chan JMC, Yip GK, Chik TSH et al. Cross-Reactive antibody response between SARS-CoV-2 and SARS-CoV infections. Cell Rep. 2020;31(9):107725. doi:10.1016/j.celrep.2020.107725.
- Nguyen-Contant P, Embong AK, Kanagaiah P, Chaves FA, Yang H, Branche AR, Topham DJ, Sangster MY, Ellebedy A, Schultz-Cherry MY. S protein-reactive IgG and memory B cell production after Human SARS-CoV-2 infection includes broad reactivity to the S2 subunit. mBio. 2020;11(5): e01991–20. doi:10.1128/mBio.01991-20. PMID: 32978311.
- Wajnberg A, Amanat F, Firpo A, Altman DR, Bailey MJ, Mansour M, McMahon M, Meade P, Mendu DR, Muellers K et al. Robust neutralizing antibodies to SARS-CoV-2 infection persist for months. Science. 2020;370(6521):1227–30. doi:10.1126/science.abd7728. PMID: 33115920.
- Seow J, Graham C, Merrick B, Acors S, Pickering S, Steel KJA, Hemmings O, O’-Byrne A, Kouphou N, Galao RP et al. Longitudinal observation and decline of neutralizing antibody responses in the three months following SARS-CoV-2 infection in humans. Nat Microbiol. 2020;5(12):1598–607. doi:10.1038/s41564-020-00813-8. PMID: 33106674.
- Apolone G, Montomoli E, Manenti A, Boeri M, Sabia F, Hyseni I, Mazzini L, Martinuzzi D, Cantone L, Milanese G et al. Unexpected detection of SARS-CoV-2 antibodies in the prepandemic period in Italy. Tumori. 2020;107(5):446–51. doi:10.1177/0300891620974755.
- Krammer F, Simon V. Serology assays to manage COVID-19. Science. 2020;368(6495):1060–61. doi:10.1126/science.abc1227. PMID: 32414781.
- Ng KW, Faulkner N, Cornish GH, Rosa A, Harvey R, Hussain S, Ulferts R, Earl C, Wrobel AG, Benton DJ et al. Preexisting and de novo humoral immunity to SARS-CoV-2 in humans. Science. 2020;370(6522):1339–43. doi:10.1126/science.abe1107. PMID: 33159009.
- Stadlbauer D, Tan J, Jiang K, Hernandez MM, Fabre S, Amanat F, Teo C, Arunkumar GA, McMahon M, Capuano C et al. Repeated cross-sectional sero-monitoring of SARS-CoV-2 in New York City. Nature. 2020;590(7844):146–50. doi:10.1038/s41586-020-2912-6.
- CDC. Interim guidelines for COVID-19 antibody testing. [ accessed 2021 Nov 29]. https://www.cdc.gov/coronavirus/2019-ncov/lab/resources/antibody-tests-guidelines.html.
- Kumar S, Tao Q, Weaver S, Sanderford M, Caraballo-Ortiz MA, Sharma S, Pond SLK, Miura S. An evolutionary portrait of the progenitor SARS-CoV-2 and its dominant offshoots in COVID-19 pandemic. Mol Biol Evol. 2021;38(8):3046–59. doi:10.1093/molbev/msab118. PMID: 33942847.
- Kolbl O, Analysis of the information transmission chain in academic research reveals reluctance to accept early circulation of SARS-CoV-2. 2021. https://www.researchgate.net/publication/353982851_Analysis_of_the_information_transmission_chain_in_academic_research_reveals_reluctance_to_accept_early_circulation_of_SARS-_CoV-2
- World Health Organization. COVID-19 natural immunity. https://www.who.int/publications/i/item/WHO-2019-nCoV-Sci_Brief-Natural_immunity-2021.1 2021.
- Percivalle E, Cambie G, Cassaniti I, Nepita EV, Maserati R, Ferrari A, Di Martino R, Isernia P, Mojoli F, Bruno R et al. Prevalence of SARS-CoV-2 specific neutralising antibodies in blood donors from the Lodi Red Zone in Lombardy, Italy, as at 2020 April 6. Euro Surveill. 2020;2524:2001031. doi:10.2807/1560-7917.ES.2020.25.24.2001031. PMID: 32583766.
- Takeshita M, Nishina N, Moriyama S, Takahashi Y, Uwamino Y, Nagata M, Aoki W, Masaki K, Ishii M, Saya H et al.; . P. Keio Donner ; Incomplete humoral response including neutralizing antibodies in asymptomatic to mild COVID-19 patients in Japan. Virology. 2021;555:35–43. doi:10.1016/j.virol.2020.12.020. PMID: 33450669.
- Long QX, Tang XJ, Shi QL, Li Q, Deng HJ, Yuan J, Hu JL, Xu W, Zhang Y, Lv FJ et al. Clinical and immunological assessment of asymptomatic SARS-CoV-2 infections. Nat Med. 2020;26(8):1200–04. doi:10.1038/s41591-020-0965-6. PMID: 32555424.
- Ding S, Laumaea A, Benlarbi M, Beaudoin-Bussieres G, Gasser R, Medjahed H, Pancera M, Stamatatos L, McGuire AT, Bazin R et al. Antibody binding to SARS-CoV-2 S glycoprotein correlates with but does not predict neutralization. Viruses. 2020 PMID: 33114742;12(11):1214. doi:10.3390/v12111214.
- La Rosa G, Mancini P, Bonanno Ferraro G, Veneri C, Iaconelli M, Bonadonna L, Lucentini L, Suffredini E. SARS-CoV-2 has been circulating in northern Italy since December 2019: evidence from environmental monitoring. Sci Total Environ. 2021;750:141711. PMID: 32835962. doi:10.1016/j.scitotenv.2020.141711.
- La Rosa G, Iaconelli M, Mancini P, Bonanno Ferraro G, Veneri C, Bonadonna L, Lucentini L, Suffredini E. First detection of SARS-CoV-2 in untreated wastewaters in Italy. Sci Total Environ. 2020;736:139652. doi:10.1016/j.scitotenv.2020.139652. PMID: 32464333.
- Valenti L, Bergna A, Pelusi S, Facciotti F, Lai A, Tarkowski M, Lombardi A, Berzuini A, Caprioli F, Santoro L, et al. SARS-CoV-2 seroprevalence trends in healthy blood donors during the COVID-19 Milan outbreak. Blood Transfus. 2021;19(3):181–89. doi:10.2450/2021.0324-20.
- Gragnani L, Monti M, Santini SA, Marri S, Madia F, Lorini S, Petraccia L, Stasi C, Basile U, Luti V et al. SARS-CoV-2 was already circulating in Italy, in early December 2019. Eur Rev Med Pharmacol Sci. 2021;25(8):3342–49. doi:10.26355/eurrev_202104_25746. PMID: 33928622.
- Gianotti R, Barberis M, Fellegara G, Galvan-Casas C, Gianotti E. COVID-19-Related dermatosis in November 2019: could this case be Italy’s patient zero? Br J Dermatol. 2021;184(5):970–71. doi:10.1111/bjd.19804. PMID: 33410129.
- Amendola A, Bianchi S, Gori M, Colzani D, Canuti M, Borghi E, Raviglione MC, Zuccotti GV, Tanzi E. Evidence of SARS-CoV-2 RNA in an Oropharyngeal swab specimen, Milan, Italy, Early December 2019. Emerg Infect Dis. 2021 PMID: 33292923;27(2):648–50. doi:10.3201/eid2702.204632.
- Amendola A. Molecular evidence for SARS-CoV-2 in samples collected from patients with Morbilliform eruptions since Late Summer 2019 in Lombardy, Northern Italy. 2021. https://www.researchgate.net/publication/353751558_Molecular_evidence_for_SARS-CoV-2_in_samples_collected_from_patients_with_morbilliform_eruptions_since_late_summer_2019_in_Lombardy_Northern_Italy
- Zehender G, Lai A, Bergna A, Meroni L, Riva A, Balotta C, Tarkowski M, Gabrieli A, Bernacchia D, Rusconi S et al. Genomic characterization and phylogenetic analysis of SARS-COV-2 in Italy. J Med Virol. 2020 PMID: 32222993;92(9):1637–40. doi:10.1002/jmv.25794.
- ANSA. Alzano, le 110 polmoniti ‘atipiche’ al vaglio degli inquirenti. 2020. https://www.ansa.it/lombardia/notizie/2020/06/30/alzanoin-inverno-110-polmoniti-strane_4edeed5d-23b8-46a8-ab78-266f839fbb5a.html.
- Lombardi F, Belmonti S, Ricci R, Borghetti A, Fabbiani M, Ciccullo A, Cauda R, Di Giambenedetto S. No evidence of SARS-CoV-2 circulation in HIV-infected patients between December 2019 and February 2020 in Rome, Italy. Clin Microbiol Infect. 2020 PMID: 33278571;27(5):802–04. doi:10.1016/j.cmi.2020.11.026.
- Capalbo C, Bertamino E, Zerbetto A, Santino I, Petrucca A, Mancini R, Bonfini R, Alfonsi V, Ferracuti S, Marchetti P et al. No evidence of SARS-CoV-2 circulation in Rome (Italy) during the pre-pandemic period: results of a retrospective surveillance. Int J Environ Res Public Health. 2020;17(22):8461. doi:10.3390/ijerph17228461. PMID: 33207548.
- Rizzo C, Loconsole D, Pandolfi E, Ciofi Degli Atti ML, van Summeren J, Paget J, Russo L, Campagna I, Croci I, Gesualdo F et al. Sars-Cov2 not detected in a pediatric population with acute respiratory infection in primary care in Central and Southern Italy from November 2019 to Early March 2020. Front Pediatr. 2021;9:620598. PMID: 34046372. doi:10.3389/fped.2021.620598.
- Deslandes A, Berti V, Tandjaoui-Lambotte Y, Alloui C, Carbonnelle E, Zahar JR, Brichler S, Cohen Y. SARS-CoV-2 was already spreading in France in late December 2019. Int J Antimicrob Agents. 2020;55(6):106006. doi:10.1016/j.ijantimicag.2020.106006.
- Carrat F, Figoni J, Henny J, Desenclos JC, Kab S, de Lamballerie X, Zins M. Evidence of early circulation of SARS-CoV-2 in France: findings from the population-based “CONSTANCES” cohort. Eur J Epidemiol. 2021 PMID: 33548003;36(2):219–22. doi:10.1007/s10654-020-00716-2.
- Nsoesie EO, Rader B, Barnoon YL, Goodwin K. Analysis of hospital traffic and search engine data in Wuhan China indicates early disease activity in the Fall of 2019. HARVARD LIBRARY Office for Scholarly Communication. 2020;1–9. https://dash.harvard.edu/handle/1/42669767
- Basavaraju SV, Patton ME, Grimm K, Rasheed MAU, Lester S, Mills L, Stumpf M, Freeman B, Tamin A, Harcourt J et al. Serologic Testing of US blood donations to identify severe acute respiratory syndrome Coronavirus 2 (SARS-CoV-2)-reactive antibodies: December 2019-January 2020. Clin Infect Dis. 2021;72(12):e1004–e1009. doi:10.1093/cid/ciaa1785.
- Piccoli L, Park YJ, Tortorici MA, Czudnochowski N, Walls AC, Beltramello M, Silacci-Fregni C, Pinto D, Rosen LE, Bowen JE et al. Mapping neutralizing and immunodominant sites on the SARS-CoV-2 Spike receptor-binding domain by structure-guided high-resolution serology. Cell. 2020;183(4):1024–42.e21. doi:10.1016/j.cell.2020.09.037. PMID: 32991844.