
ABSTRACT
Cancer immunotherapy is a powerful tool for inducing antigen-specific antitumor cytotoxic T lymphocytes (CTLs). Next-generation strategies may include vaccination against overexpressed oncogenic tumor-self antigens. Previously, we reported vaccination against the oncogenic tumor-self antigen D52 (D52) was effective in preventing tumor growth. We recently reported that D52-vaccinated IL-10-deficient mice generated a significant memory response against tumor recurrence compared to wild-type mice and that vaccine-induced CD8+ IL-10+ T cells may possess regulatory function. Herein, we extended these studies by testing the hypothesis that D52-vaccine-elicited CD8+ IL-10+ T cells represent a distinct T cell population with a regulatory phenotype. C57Black/6J mice deficient in IL-10 or IFN-γ were vaccinated with the murine orthologue of D52; vaccination of wild-type (wt) mice served as a control for comparison. T cells were isolated from all three groups of vaccinated mice, and RNA was extracted from purified CD8+ T cells for deep sequencing and expression analysis. Chemokine receptor 8 (CCR8) and inducible co-stimulator (ICOS) were overexpressed in CD8+ T cells that produced IL-10 but not IFN-γ. These surface markers are associated with IL-10 producing CD4+ T regulatory cells thus supporting the possibility that CD8+ IL-10+ T cells elicited by D52 vaccination represent a unique regulatory T cell subset. The current phenotypic analyses of D52 vaccine elicited CD8+ T cells strengthen our premise that CD8+ IL-10+ T cells elicited by D52 tumor-self protein vaccination likely contribute to the suppression of memory CTL responses and inhibition of durable tumor immunity.
Introduction
Vaccination holds great promise in the field of cancer immunotherapy but requires further exploration of tumor antigen targets and the immune response elicited to these targets. Tumor protein D52 (D52) is an oncogenic tumor self-protein that has demonstrated efficacy as a vaccine target in preclinical studies.Citation1–6 D52 is a naturally expressed intracellular protein detectable at low levels in healthy cells and tissues where its function is not clearly understood. Forced increased expression of the murine orthologue of D52 (mD52) in normal murine fibroblast cells induced anchorage-independent growth in vitro and spontaneous lung metastasis in vivo, demonstrating an oncogenic role for D52 in the 3T3.mD52 sarcoma model.Citation7 We further demonstrated that reduction of expression of the human orthologue of D52 (hD52) with a specific RNAi resulted in increased apoptosis in human breast cancer cells, and hD52 over-expression correlated with decreased survival in human breast cancer patients.Citation8 Further supporting the role of D52 as an oncogene is the demonstration that shRNA reduction of mD52 expression abrogated spontaneous metastasis associated with murine 3T3.mD52 sarcoma cells in vivo (unpublished observation). Importantly, it has been reported in many cancers that D52 is overexpressed and required for tumor progression.Citation7–14
The murine orthologue of D52 (mD52) is 86% identical to human D52 (hD52) at the amino acid level, providing a unique opportunity to study D52 cancer vaccine approaches and immune responses to D52 in murine models of cancer. Our vaccination efforts targeting D52 have been successful in murine models without inducing autoimmunity.Citation1–5−Citation15 However, immune regulation appears to impact vaccine efficacy. Our previous studies indicated that CD4+ CD25+ T regulatory cells (Tregs) play a role in immune suppression to D52 vaccination.Citation3–5−Citation16 In addition to CD4+ Tregs there appears to be a CD8+ T cell subset that is elicited with CD8+ effector CTLs that may be negatively impacting vaccine-induced tumor immunity. In support of this is, our recent report demonstrating that CD4+ Treg cell depletion did not lead to complete tumor protection, indicating that other regulatory cells or factors may be suppressing complete immunity.Citation3,Citation5 Previous studies in our lab suggest that CD8+ T cells producing interleukin 10 (IL-10) may contribute to suppressing complete tumor immunity following D52 vaccination.Citation2–5−Citation15 These CD8+ IL-10+ T cells may behave like regulatory T cells and inhibit immunity to over-expressed tumor self-proteins in general, and to vaccine-elicited immunity to D52 specifically.Citation15,Citation16 Previously, we tested the hypothesis that the CD8+ IL-10+ T cells we observed in vaccinated wild-type mice may belong to the previously defined CD122+ hi subset of CD8+ T regulatory cells.Citation17–24 Depleting CD122+ T cells did not augment D52-vaccine-induced tumor immunity, and expression studies confirmed that the IL-10+ CD8+ T cells elicited by D52 vaccination do not expression Foxp3 that is also associated with CD122+ CD8+ T regs.Citation5,Citation16 These results suggested that CD8+ IL-10+ T cells elicited by D52 vaccination might be a different subset of suppressor cell than those previously described. It has been demonstrated that both CD4+ and CD8+ T cells possess immune suppressive properties. Although CD4+ Tregs are well characterized, there is less information defining CD8+ Tregs. The immune suppressive cytokines TGF-β1 and IL-10 clearly play roles in the functional mechanisms of suppression ascribe to both CD4+ and CD8+ Tregs. CD8+ Tregs have been described as Qa1-restricted,Citation25 CD122+,Citation24 CXCR5+,Citation26 and in some circumstances similar to CD4 Tregs that are Foxp3+, CD25+.Citation17 We do not see any of these markers associated with D52-vaccine-induced CD8+ IL-10+ T cells.
Herein, we explored the hypothesis that the CD8+ IL-10+ T cells elicited by D52 vaccination represent a phenotypically distinct T cell population with regulatory potential. The phenotypic analyses data support our premise that CD8+ IL-10+ T cells elicited by D52 tumor-self protein vaccination likely contribute to the suppression of observed memory CTL responses and durable tumor immunity and may represent a unique subset of suppressor cell.
Materials and methods
Mice and D52 vaccination
Male, 6-week-old C57Black/6J wild-type (wt), IL-10-deficient (B6.129P2-IL10tm1cgn/J, IL10KO), and IFN-γ-deficient (B6.129S7-Ifngtm1Ts/J, IFNgKO) mice were purchased from Jackson Labs (Bar Harbor, ME). All animals were cared for and treated according to institutional guidelines at Texas Tech University Health Sciences Center. Individual mice were vaccinated i.m. every 14–15 days with 50 μg of plasmid DNA containing full-length cDNA of the murine D52 orthologue (mD52-DNA) in PBS for a total of four injections as depicted in .Citation15s
Figure 1. Isolation and activation of CD8+ T cells following vaccination with mD52. (a) mD52 vaccination schedule. Each individual animal was vaccinated i.m. With 50 micrograms of purified mD52 plasmid DNA in saline every 14–15 days for a total of 4 injections. (b) Schematic depicting in vitro CD8+ T activation. Pure CD8+ T cells were isolated from D52-vaccinated IL-10-deficient, IFN-γ-deficient, and wt mice and stimulated and expanded in vitro for RNA and protein isolation.
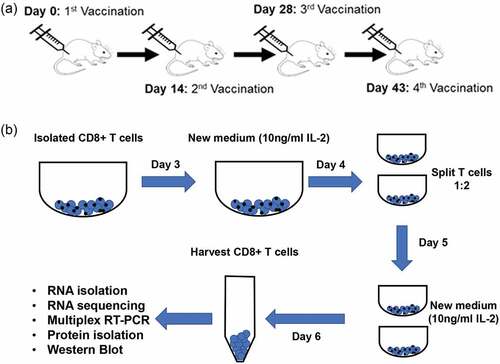
CD8 T cell activation and RNA isolation
Lympholyte-M® (Cedarlane Labs, Burlington, NC) gradient separated spleen-derived lymphocytes from D52-vaccinated mice (n = 5) were pooled within like groups, and CD8+ T cells were isolated with Dynabeads™ Untouched™ Mouse CD8 T cells magnetic beads according to manufacturer’s instructions (Thermo Fisher, Waltham, MA). Purified CD8 T cells were stimulated in vitro with Dynabeads™ mouse T cell CD3/CD28 activator beads (Thermo Fisher, Waltham, MA) in the presence of IL-2 (10 ng/ml) for 6 days. RNA was extracted using RNeasy Mini kit (Qiagen, Hilden, Germany) from 5 × 10⁶ purified activated CD8+ T cells isolated from D52-vaccinated IL-10-deficient, IFN-γ-deficient, and wt mice. Schematic depicting the CD8 T cell isolation and activation process is shown in . DNA-free RNA from each of the three distinct groups was packaged and shipped in triplicate to Novogene Corporation, Inc. (Sacramento, CA) for RNA sequencing and analysis (see below methods of details).
RNA deep sequencing
RNA quantification and qualification
RNA degradation and contamination were monitored on 1% agarose gels. RNA purity was checked using the NanoPhotometer® spectrophotometer (IMPLEN, CA, USA). RNA integrity and quantitation were assessed using the RNA Nano 6000 Assay Kit of the Bioanalyzer 2100 system (Agilent Technologies, CA, USA). Workflow is shown in (courtesy of Novogene Corporation, Inc., with permission).
Figure 2. Library preparation and transcriptome sequencing of mRNA generated from total RNA isolated from CD8 T cells as described in . (a) Workflow schematic depicting mRNA library preparation and deep sequencing. (b) Schematic depicting the process used for mRNA library generation and transcriptome sequencing (courtesy of Novogene Corporation, Inc., with permission).
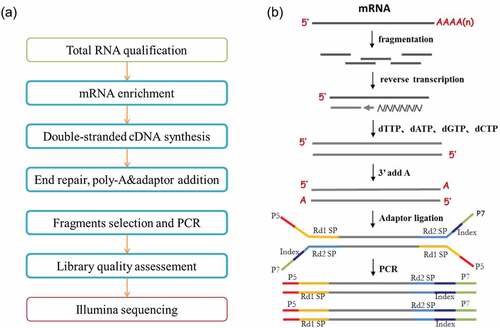
Library preparation for transcriptome sequencing
A total amount of 1 μg RNA per sample was used as input material for the RNA sample preparations. Sequencing libraries were generated using NEBNext® Ultra™ RNA Library Prep Kit for Illumina® (NEB, USA) following manufacturer’s recommendations and index codes were added to attribute sequences to each sample. Briefly, mRNA was purified from total RNA using poly-T oligo-attached magnetic beads. Fragmentation was carried out using divalent cations under elevated temperature in NEBNext First Strand Synthesis Reaction Buffer (5X). First strand cDNA was synthesized using random hexamer primer and M-MuLV Reverse Transcriptase (RNase H-). Second strand cDNA synthesis was subsequently performed using DNA Polymerase I and RNase H. Remaining overhangs were converted into blunt ends via exonuclease/polymerase activities. After adenylation of 3’ ends of DNA fragments, NEBNext Adaptor with hairpin loop structure was ligated to prepare for hybridization. In order to select cDNA fragments of preferentially 150 200 bp in length, the library fragments were purified with AMPure XP system (Beckman Coulter, Beverly, USA). Then, 3 μl USER Enzyme (NEB, USA) was used with size-selected, adaptor-ligated cDNA at 37°C for 15 min followed by 5 min at 95°C before PCR. PCR was performed with Phusion High-Fidelity DNA polymerase, Universal PCR primers and Index (×) Primer. Finally, PCR products were purified (AMPure XP system), and library quality was assessed on the Agilent Bioanalyzer 2100 system. Schematic depicting the process used for mRNA library generation and sequencing is shown in (courtesy of Novogene Corporation, Inc., with permission).
The clustering of the index-coded samples was performed on a cBot Cluster Generation System using PE Cluster Kit cBot-HS (Illumina) according to the manufacturer’s instructions. After cluster generation, the library preparations were sequenced on an Illumina platform and 125 bp/150 bp paired-end reads were generated.
Multiplex and real-time RT-PCR
Using Lympholyte-M® (Cedarlane Labs, Burlington, NC) gradient separated spleen-derived lymphocytes from vaccinated mice, CD8+ T cells were isolated using magnetic beads and in vitro stimulated with CD3/CD28 activator beads (Dynabeads, LifeTech, Thermo Fisher, Waltham, MA) in the presence of IL-2 (Peprotech) for 6 days as described above in detail. RNA was extracted using RNeasy Mini kit (Qiagen, Hilden, Germany) from 5 × 10⁶ purified CD8+ T cells as described in detail above.
For all RT-PCR reactions, cDNA was generated using 250 ng DNA-free RNA from each group of vaccinated mice and oligo-dT primer. PCR reactions were performed according to manufacturer’s instructions (Qiagen, Hilden, Germany). Primer sets were purchased from InVitrogen (Waltham, MA). Primer sequences are described in . Multiplex RT-PCR conditions for 30 cycles (in some instances, amplification at 24 and 26 cycles was compared as indicated in the appropriate figure legends) were as follows: 94°C for 1 min, 58°C or 60°C for 1 min 30 sec, and 72°C for 1 min 30 sec. All results were visualized on 1–3% agarose gels containing ethidium bromide. Amplification of glyceraldehyde-3-phosphate dehydrogenase (GAPDH) cDNA served as an internal reference control. No template was included as an additional control in all RT-PCR reactions.
Table 1. Primer sequences used for reverse transcription-polymerase chain reaction.
Real-time RT-PCR reactions were performed using Applied Bio Systems and ABI SYBR green PCR core reagents kit according to the manufacturer’s instructions (Applied Bio Systems, Foster City, CA). Real-time RT-PCR conditions for 40 cycles were as follows: 58–60°C for 2 min, 95°C for 10 min, 95°C for 15 s for all primers. Amplification of glyceraldehyde-3-phosphate dehydrogenase (GAPDH) cDNA served as an internal reference control. No template was included as an additional control in all real-time RT-PCR reactions.
Western analysis
Western blot analysis was performed to confirm the protein expression of identified CCR8 mRNA expression from RNA sequencing results and real-time RT-PCR results using individual whole cell lysates from vaccinated mice. CD8+ T cells were isolated and in vitro stimulated as described in detail above. Cells were harvested, counted, and whole cell protein lysates were prepared using Pierce Whole Cell Lysis Buffer (Pierce Biotechnology Inc., Rockford, IL) to obtain lysates of 1 × 10⁸ cell equivalents/ml. Lysates were loaded on a standard reducing SDS-PAGE (4% stacking, 12% resolving) and electrophoresed at 200 V for 1 h, followed by electrolytic transfer to nitrocellulose for immunoblotting. The nitrocellulose membranes were blocked in PBS containing 1% normal goat serum, 1% milk, and 0.02% Tween for 2 h at room temperature. After blocking, the membranes were incubated overnight at 4°C with (2 μg/ml of anti-CCR8; Invitrogen, Waltham, MA). Following incubation with anti-CCR8 Ab, the membrane was washed three times with PBS-0.02% Tween. Antibody binding was detected by the addition of goat-anti-rabbit IgG peroxidase conjugated antibody (Sigma, St. Louis, MO) at 1:2500 dilution for 2 h at room temperature. The membrane was washed three times with PBS-0.02% Tween and developed with diaminobenzidine reagent as substrate to visualize CCR8-specific antibody reactivity. Identically prepared membranes were probed with anti-GAPDH Ab (1:2500 dilution; proteintech, Rosemont, IL) to serve as a control for sample loading.
Statistical analysis and RNA sequencing data analysis
Student’s unpaired t-test using Graph Pad InStat was used to determine significant difference (p < .05) in mRNA expression of RT-PCR reactions. Differential expression analysis of the two groups sent for RNA sequencing was performed using the DESeq2 R package. P values were then adjusted using the Benjamini and Hochberg’s approach for controlling the false discovery rate. Cross-platform concordance of mRNA expression was performed using the statistical program R and the equationCitation27 by comparing significant differences in mRNA expression in IL-10-deficient and IFN-γ-deficient CD8+ T cells. Downstream analysis was performed using a combination of programs including STAR, HTseq, Cufflink, and wrapped scripts. Alignments were parsed using Tophat program, and differential expression was determined through DESeq2/edgeR. GO and KEGG enrichment were implemented by the ClusterProfiler. Gene fusion and difference of alternative splicing event were detected by Star-fusion and rMATS software.
Reads mapping to the reference genome
Reference genome and gene model annotation files were downloaded from genome website browser (NCBI/UCSC/Ensembl) directly. Indices of the reference genome were built using STAR, and paired-end clean reads were aligned to the reference genome using STAR (v2.5). STAR used the method of Maximal Mappable Prefix (MMP) that generated precise mapping result for junction reads.
Quantification of gene expression level
HTSeq v0.6.1 was used to count the read numbers mapped of each gene, and FPKM of each gene was calculated based on the length of the gene and reads count mapped to the gene. FPKM, Reads Per Kilobase of exon model per Million mapped reads, considers the effect of sequencing depth and gene length for the reads count at the same time.
Differential expression analysis
Differential expression analysis between two conditions/groups (two biological replicates per condition) was performed using the DESeq2 R package (2_1.6.3). DESeq2 provides statistical routines for determining differential expression in digital gene expression data using a model based on the negative binomial distribution. The resulting P-values were adjusted using the Benjamini and Hochberg’s approach for controlling the False Discovery Rate (FDR). Genes with an adjusted P-value <.05 found by DESeq2 were assigned as differentially expressed. The Venn diagram was prepared using the function Venn diagram in R based on the gene list for different groups.
Correlations
To allow for log adjustment, genes with 0 FPKM were assigned a value of 0.001. Correlations were determined using the correlation test function in R with options set as alternative = “greater,” and method = “Spearman.”
Results
Differential gene expression in CD8+ T cells isolated from mD52-vaccinated mice
Previously, we demonstrated protective tumor immunity ranging from 14% to 50% (mean of 30%) protection against tumor challenge following mD52 DNA vaccination formulation and schedule. In addition to vaccine-elicited effector CTLs, we routinely observed a population of CD8+ IL-10+ T cells that may be a unique undefined subset of suppressor CD8+ T cells preventing complete tumor protection following vaccination.Citation4,Citation5,Citation15 More recently, we demonstrated that D52-vaccinated mice deficient in IL-10 demonstrated a memory response in which 100% of the mice were protected from secondary tumor challenge, while wt mice had diminished recall responses (25%) against tumor recurrence, adding support to our premise that a distinct population of CD8+ IL-10+ T cells elicited by D52 tumor-self antigen vaccine contribute to the suppression of memory CTL responses and durable tumor immunity.Citation15 In the present study, in an effort to extend these results, we used the same model employing wt male mice and strain compatible male mice deficient in IL-10 or IFN-γ to test the hypothesis that D52 vaccine elicited CD8+ IL-10+ T cells represent a distinct T cell population with a definable regulatory-associated phenotype. To be certain, in this study, that the CD8+ T cell response was D52-focused and specific, we did not challenge vaccinated mice with tumor cells, thereby precluding the induction of T cells in the polyclonal response that possess specificities to additional tumor associated antigens due to cross-presentation. To this end, we vaccinated age matched groups of wt, IL-10-deficient (KO), or IFN-γ-deficient (KO) mice with mD52 plasmid DNA (i.m.) according to the schedule depicted in , and as previously reported.Citation15 Isolation and activation of CD8+ T cells from D52-vaccinated mice deficient in IL-10 (IL10KO) or IFN-γ (IFN-γKO) was performed as shown in . Prior to gene expression analysis, CD8+ T cell purity was confirmed by routine single stain flow cytometry (not shown). Library preparation and transcriptome sequencing of mRNA purified from total RNA isolated from CD8 T cells was performed as described in the workflow schematic depicting mRNA library preparation and the deep sequencing process () (courtesy of Novogene).
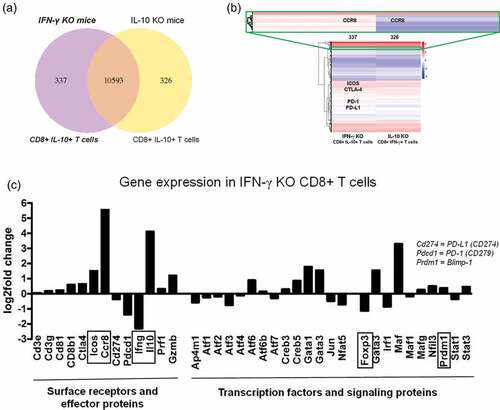
The Venn diagram illustrates that in CD8+ T cells isolated from D52-vaccinated IL-10-deficient and IFN-γ-deficient mice, the majority of expressed genes (10,593) were shared (). Interestingly, differences in gene expression were evident, with 337 unique genes in IFN-γ KO mice and 326 distinct genes in IL-10 KO mice (). The unique gene expression signatures suggest the likelihood of unique and definable phenotypes. Heat map clustering of differentially expressed genes demonstrated patterns of gene expression, where blue indicates low-expression genes and red represents high-expression genes (). IFN-γ KO mice, representing CD8+ IL-10+ T cells, showed increased expression of markers associated with regulatory T cells, such as CCR8, ICOS, and CTLA-4. Although the expression of PD-1 was observed in CD8+ T cells from vaccinated mice from both groups (red, ), there was a slight decrease in PD-1 expression in CD8+ T cells from vaccinated IFN-γ KO mice compared to IL-10 KO mice (). Among the differences in gene expression were several regulatory and transcription factors (). Of note, the IL-10-associated transcription factor Blimp-1 was increased in IFN-γ KO CD8+ T cells (CD8+ IL-10+ T cells), and the Treg transcription factor Foxp3 was decreased (). This corroborated our previous report showing a lack of Foxp3 in this unique CD8+ IL-10+ T cell population.Citation5,Citation16 Importantly, several T cell surface markers that have been shown to represent phenotypic markers were more highly expressed in CD8+ IL-10+ T cells (IFN-γ KO) including ICOS, CTLA-4, IL-10 and most notably CCR8 ().
Figure 3. Differential expression of genes in purified CD8+ T cells isolated from mD52-vaccinated mice deficient in IL-10 (IL10KO) or IFN-γ (IFN-γKO). Deep mRNA transcriptome sequencing and analysis was performed commercially by Novogene, Inc. (a) Venn diagram depicting total shared (10,593) and differentially expressed genes between CD8+ T cells from vaccinated mice deficient in IL-10 (326) or IFN-γ (337). (b) Hierarchical clustering heatmap of differentially expressed genes between CD8+ T cells from vaccinated mice deficient in IL-10 or IFN-γ. Red represents high expression genes and blue represents low expression genes. Color descending from red to blue, indicated log10 (FPKM +1) from high to low. Genes listed in colored boxes represent genes found in the region outlined in the respective color. (c) Differential expression of genes in CD8+ T cells from vaccinated IFN-γ-deficient mice against gene expression in CD8+ T cells from vaccinated IL-10-deficient mice. Increased expression of genes in IFN-γ-deficient (KO) CD8+ T cells (CD8+ IL-10+ T cells) compared to IL-10-deficient CD8+ T cells are depicted by a positive fold change. Decreased expression of a genes in IFN-γ-deficient (KO) CD8+ T cells (CD8+ IL-10+ T cells) compared to IL-10-deficient CD8+ T cells are depicted by a negative fold change.
Multiplex RT-PCR confirmation of gene expression associated with effector CTLs in CD8+ T cells isolated from mD52-vaccinated mice
Multiplex RT-PCR was used to confirm differentially expressed genes associated with effector CTLs in CD8+ T cells isolated from mD52-vaccinated IL-10-deficient (IL10KO), IFN-γ-deficient (IFN-γ KO), and wild-type (WT) mice. Isolation and stimulation of purified CD8+ T cells was achieved as described above in the methods section. Gene expression is shown as repeated RT-PCR experiments () and the resulting intensity value ratio to GAPDH expression is given as graphs in . Primer sets that targeted CD3, CD4, CD8, IFN-γ, PD-1, Blimp-1, IL-10, and GAPDH were combined in single PCR multiplex reactions to compare gene expression between the three groups of vaccinated mice. Following 30 cycles of amplification of agarose gels confirmed the CD3+ T cells were pure CD8+ T cells with no detection of CD4 in any of the three T cell samples (). CD8+ T cells from wt mice expressed both IFN-γ and IL-10, corroborating our previous reports demonstrating that two distinct populations of CD8+ T cells were elicited by mD52 vaccinationCitation2,Citation3,Citation5,Citation15,Citation16 (). Importantly, CD8+ T cells from IFN-γ KO mice (CD8+ IL-10+ T cells) did not express IFN-γ but did express IL-10, and conversely CD8+ T cells from IL-10 KO mice (CD8+ IFN-γ + T cells) did not express IL-10 but did express IFN-γ (). No significant difference (p = .7878) was observed for the expression of the IL-10 associated transcription factor Blimp-1 (), although Blimp-1 expression appeared slightly elevated in CD8+ T cells from IFN-γ KO mice (CD8+ IL-10+ T cells) ().
Figure 4. Multiplex RT-PCR confirmation of differentially expressed genes associated with CTLS in CD8+ T cells isolated from mD52-vaccinated IL-10-deficient (IL10KO), IFN-γ-deficient (IFN-γ KO), and wild-type (WT) mice. (a) Representative 30 cycle RT-PCR agarose gel showing expression of target genes expressed in CD8+ T cells from IL-10-deficient (IL10KO) and IFN-γ-deficient (IFNgKO) mice. From the left, the first two lanes are 1kb and 100 bp ladders, respectively. The H20 lane (far right of gel) represents no template controls. (b) Graphic representation of expression differences in target genes in CD8+ T cells from . (c) Representative 30 cycle RT-PCR agarose gel showing expression of target genes expressed in CD8+ T cells from wild-type (WT) mice. From the left, the first two lanes are 1kb and 100 bp ladders, respectively. The H20 lane (far right of gel) represents no template controls. d) Graphic representation of expression differences in target genes in CD8+ T cells from . Shown are target genes as a ratio of GAPDH expression (Primer/GAPDH). Individual values were calculated using intensity value ratio (IDV) of target gene to. The associated intensity ratio values shown in B and D are represented on the y-axis. Significance was determined using an unpaired t-test, p < .05.
Multiplex RT-PCR confirmation of gene expression commonly associated with regulatory T cells in CD8+ T cells isolated from mD52-vaccinated mice
Our established multiplex RT-PCR method was used to confirm the expressed genes commonly associated with regulatory T cells in CD8+ T cells isolated from mD52-vaccinated IL-10-deficient (IL10KO), IFN-γ-deficient (IFN-γ KO), and wild-type (WT) mice (). Isolation and stimulation of purified CD8+ T cells was achieved as described above in the methods section. Gene expression is shown as representative repeated RT-PCR experiments using the resulting intensity value ratio to GAPDH expression as graphs in . Primer sets that targeted ICOS, PD-1, PD-L1, CTLA-4, CCR8, and GAPDH were combined in single PCR multiplex reactions to compare gene expression between the three groups of vaccinated mice. Following 30 cycles of amplification using endpoint RT-PCR, agarose gels confirmed expression of the target genes in CD8+ T cells from mD52-vaccinated mice (). We did not observe significant differences in PD-1, PD-L1, ICOS, or CTLA-4 expression in CD8+ T cells between the three groups (). However, there was a marked difference in CCR8 expression (), with CD8+ IL-10+ T cells from IFN-γ-deficient (IFN-γ KO) mice expressing nearly as much CCR8 as ICOS (). Interestingly, CCR8 was largely not detected in CD8+ T cells from IL-10-deficient (IL10KO) and wild-type (WT) mice ). Of the surface markers identified by RNA sequencing analysis, the greatest differential expression in mD52-vaccinated CD8+ IL-10+ T cells from IFN-γ-deficient (IFNgKO) mice is CCR8 as confirmed by multiplex RT-PCR. This surface protein may define the CD8+ IL-10+ T cell subset as distinct from effector CD8+ IFN-γ+ T cells elicited following D52 vaccination.
Figure 5. Multiplex RT-PCR confirmation of differentially expressed genes associated Tregs in CD8+ T cells isolated from mD52-vaccinated IL-10-deficient (IL10KO), IFN-γ-deficient (IFN-γ KO), and wild-type (WT) mice. (a–c) are representative 30 cycle RT-PCR agarose gels showing expression of target genes expressed in CD8+ T cells from IL-10-deficient (IL10KO), IFN-γ-deficient (IFNgKO), and wild-type (WT) mice. From the left, the first lane is 1kb ladder. The H20 lane (far right of gel) represents no template controls. The genes of interest are indicated in white text within the gel image: (a) ICOS, PD-1, and PD-L1; (b) CCR8 and GAPDH; and (c) CTLA-4 and GAPDH (H20 control was negative, not shown). (d) Graphic representation of expression differences in target genes in CD8+ T cells from IL-10 KO mice and IFNg KO mice. (e) Graphic representation of expression differences in target genes in CD8+ T cells from wild-type (WT) mice. Shown are target genes as a ratio of GAPDH expression (Primer/GAPDH). Individual values were calculated using intensity value ratio (IDV) of target gene to. The associated intensity ratio values shown in d and e are represented on the y-axis. Significance was determined using an unpaired t-test, p < .05.
Real-Time RT-PCR confirmation of differentially expressed genes in CD8+ T cells isolated from mD52-vaccinated mice
Real-time RT-PCR was used to further analyze differentially expressed genes in CD8+ T cells isolated from mD52-vaccinated IL-10-deficient (IL10KO), IFN-γ-deficient (IFN-γ KO), and wild-type (WT) mice (). Stimulation of purified CD8+ T cells was achieved as described above in the methods section. Gene expression of representative repeated experiments using the Delta Rn Ratio (target/GAPDH) is shown in . To illustrate the differences in gene expression, two independent PCR cycle points are shown graphically, 24 cycles and 26 cycles (, respectively).
Figure 6. Real-Time RT-PCR confirmation of differentially expressed genes in CD8+ T cells isolated from mD52-vaccinated mice. Shown are graphic representations of expression differences in target genes in CD8+ T cells. (a–c) depict gene expression at 24 cycles of amplification, and (d–f) depict gene expression at 26 cycles of amplification. (a and d) compare expression of PD-1, PD-L1, and CTLA-4. (b and e) compare expression of Perforin 1 (Prf1) and Granzyme B (Gzmb) (c and f) compare expression of CCR8 and ICOS. Individual bars represent target genes (specific primers) as a ratio of GAPDH expression (Primer/GAPDH) from repeated experiments. Individual expression values were calculated using Delta Rn ratio of target gene to GAPDH. Significance was determined by unpaired t-test: *** p < .001, ** p < .01, and * p < .05.
Primer sets specific for PD-1, PD-L1, and CTLA-4 were used to assess their independent expression in CD8+ T cells isolated from all three groups of vaccinated mice. In contrast to endpoint PCR () the results shown in indicate differences in expression of PD-1, PD-L1, and CTLA-4 among the three vaccine groups with varying degrees of significance. The expression of the program death receptor PD-1 was fairly similar between vaccinated WT mice CD8+ T cells and IL-10-deficient IFN-γ + CD8+ T cells. However, PD-1 expression in IL-10+ CD8+ T cells from vaccinated IFN-γ-deficient mice (IFNgKO) was significantly lower than that of the other two groups of vaccinated mice (p < .001). Likewise, the expression of the ligand for PD-1, PD-L1 was similar between CD8+ T cells from vaccinated WT and IL-10-deficient mice, whereas the expression of PD-L1 in IL-10+ CD8+ T cells from vaccinated IFN-γ-deficient mice (IFNgKO) was significantly lower than that of the other two groups of vaccinated mice (p < .01). Interestingly, the differential expression pattern of CTLA-4 in CD8+ T cells from the three groups of vaccinated mice was different. Overall, the expression was similar, with CD8+ T cells from WT vaccinated mice showing the lowest expression compared to CD8+ T cells from the two groups of vaccinated IL-10- and IFN-γ-deficient mice (p < .05 and p < .01, respectively).
Using specific primer sets, we further evaluated differential expression of the CTL-associated effector proteins, perforin (Prf1) and granzyme b (gzmb) in CD8+ T cells isolated from all three groups of vaccinated mice (). Comparable to endpoint PCR (), the results shown in indicate similar levels in expression of Prf1 among the three vaccine groups. However, gzmb expression in IL-10+ CD8+ T cells from vaccinated IFN-γ-deficient mice (IFNgKO) was significantly higher than that of the other two groups of vaccinated mice (p value ranging from <0.01 to <0.001).
Given the more recent association of the surface molecules inducible co-stimulator (ICOS) and CCR8 with subsets of CD4+ T cells demonstrating regulatory function, it was of interest to corroborate the RNAseq data identifying differences in the expression of these to genes, using real-time RT-PCR and specific primer sets to further assess expression differences between CD8+ T cells from all three vaccinated groups of mice (). The expression of ICOS in CD8+ T cells from vaccinated WT and IFN-γ-deficient mice (IFNgKO) was similar. However, ICOS expression in CD8+ IFN-γ + T cells from vaccinated IL-10-deficient mice (IL10KO) was significantly lower than that of the other two groups of vaccinated mice (p < .001). Of note, there was the differential expression of the chemokine receptor CCR8 between the CD8+ T cells from vaccinated mice. Similar to the data in , CCR8 expression was slightly detected above background cutoff levels in CD8+ T cells from WT and IL-10-deficient mice (IL-10KO) (). Strikingly, CCR8 was significantly expressed in CD8+ IL-10+ T cells from vaccinated IFN-γ-deficient mice compared to CD8+ T cells from the other two groups of vaccinated mice (p < .001) (). Together, these data identify differential expression of ICOS and CCR8 in CD8+ IL-10+ T cells, via deep RNA sequencing and corroborated by real-time RT-PCR, as surface markers that may be able to identify and define a unique subset of CD8+ T cells elicited by D52 vaccination that possess immune regulatory function ().
Performing cross-platform concordance using the equation described in Toni et al.,Citation27 it was determined that there is 83.3% concordance of statistically significant mRNA expression between real-time RT-PCR and deep RNA sequencing results between PD-1, PD-L1, CTLA-4, ICOS, and CCR8. Some of the differences in results obtained between may simply be due to plateauing of expression levels at or near 30 cycles of amplification for endpoint RT-PCR, thus highlighting those expression differences that are highly significant. Although RNAseq and follow-on endpoint RT-PCR expression confirmation are powerful, it is clear that analyses using real-time RT-PCR alongside endpoint RT-PCR are important for corroboration and confirmation of gene expression differences identified by RNAseq analyses.
CCR8 protein expression in CD8+ T cells isolated from mD52-vaccinated mice
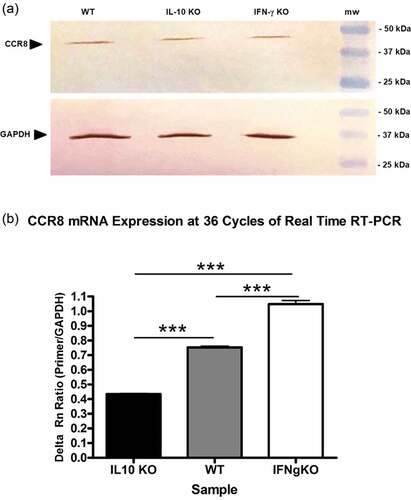
Both ICOS and CCR8 were identified as surface-markers that may define CD8+ IL-10+ T cells elicited by mD52 vaccination as regulatory. However, ICOS was differentially expressed, while CCR8 appeared to be uniquely expressed by these CD8+ T cells. Due to the strong difference in expression of CCR8 it was of interest to assess CCR8 protein expression in CD8+ T cells from vaccinated mice by using western blot analysis and commercially available antibodies with specificity for CCR8 protein. Although RNA expression studies revealed markedly different CCR8 expression levels in CD8+ IL-10+ T cells from vaccinated IFN-γ-deficient mice (IFNgKO) compared expression in CD8+ IFN-γ +T cells from vaccinated IL-10-deficient mice (IL10KO) and WT mice, protein expression was detected by western blot in CD8+ T cells from vaccinated mice from all three groups (). Expression of CCR8 in CD8+ T cells from vaccinated WT and IL-10-deficient mice was not observed using end point RT-PCR at 30 cycles of amplification (), and only slightly observed at 24 and 26 cycle data points for real-time RT-PCR. To account for the protein expression, data analysis of the expression of CCR8 at a time point of 36 cycles of real-time RT-PCR amplification was performed. CCR8 expression at 36 cycles of RT-PCR amplification was observed in all three groups of vaccinated mice (), supporting the protein expression data acquired by western blot analysis. However, expression differences were again observed, with message levels of CCR8 being significantly higher in CD8+ IL-10+ T cells from vaccinated IFN-γ-deficient mice (IFNgKO) compared to CD8 + T cells from the other two groups of vaccinated mice (p < .001) (). Given that our data illustrate significant differences in CCR8 message expression, and that CCR8 expression in CD8+ T cells from vaccinated WT and IL-10-deficient mice was only seen at very high amplification cycles indicate a difference in the amount CCR8 message expression. Western analysis may not be sensitive enough to identify differences in the amount of CCR8 protein observed due to the inherent low stringency of the technique using whole protein lysates. Future studies on surface expression and functional analysis of CCR8 protein in this model will be necessary to further explore its role on CD8+ IL-10+ T cells elicited by D52 vaccination, and to determine whether CCR8 can be used to define this potentially unique subset of CD8+ IL-10+ T cells with immune regulatory function.
Figure 7. CCR8 protein expression in CD8+ T cells isolated from mD52-vaccinated mice. (a) Western blot analysis demonstrating protein expression of CCR8 in CD8+ T cell whole protein lysates. GAPDH served as a control for protein loading. Molecular weight (mw) markers are shown on the far right. (b) Real-time RT-PCR confirmation of differential expression of CCR8 in CD8+ T cells isolated from mD52-vaccinated mice. Individual bars represent CCR8 expression differences, at 36 cycles of amplification, as a ratio of GAPDH expression (Primer/GAPDH). Significance was determined by unpaired t-test: *** p < .001.
Proposed regulatory phenotype of a unique population of CD8+ T cells elicited by vaccination with mD52
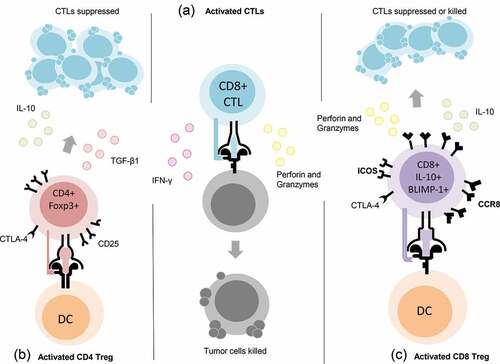
Based on our in-depth differential expression analyses, it is reasonable to speculate that vaccination with the oncogenic tumor-self protein D52 elicits together with previously reported TH1 helper T cells and anti-tumor CTLs, a unique subpopulation of CD8+ T cells that possess a phenotype consistent with that of regulatory T cells. The population of CD8+ T cells we uncovered by vaccination with a shared oncogenic tumor-self protein differs from what has been described for CD8+ Tregs, namely, the absence of Foxp3, CD122, and Qa1-restriction, and may be defined by the expression and secretion of IL-10 regulated by the transcription factor Blimp-1, as well as the differential expression of surface molecules previously ascribed to CD4+ Treg cells, CCR8, ICOS, and CTLA-4 (). Additional studies relative to function and epigenetics may reveal that expression of perforin and granzyme B could be used by these sub-population of CD8+ T cells to kill activated CTLs that possess potentially harmful self-antigen specificities.
Figure 8. Proposed phenotype of a potentially unique population of CD8+ T regulatory (Treg) cells. Center column (a) depiction of CD8+ CTLs defined by secretion of IFN-γ, Perforin and Granzymes. Left column (b) depiction of CD4+ Treg cells defined by the expression of CD25, CTLA-4 and Foxp3 and the secretion of TGF-β1 or IL-10. Right column (c) depiction of CD8+ Treg cells elicited by vaccination with the oncogenic tumor-self protein D52 and defined by the expression of CTLA-4, ICOS, CCR8, and BLIMP-1, as well as secretion of IL-10, Perforin, and Granzymes (Grzb).
Discussion
It is widely accepted that in addition to CD4+ Treg cells, several CD4+ T helper cell subsets are capable of secreting IL-10. This has been described for Th1, Th2, Th17 and CD4+ Tr1 cells.Citation28 By comparison, very little is known about CD8+ T cells and IL-10 secretion. Investigation into CD8 T cells and IL-10 secretion has increased over the last decade. In the past 5–7 years, we have focused our research on what we believe to be a unique subset of CD8+ T cells that secrete IL-10 in response to a novel tumor vaccine comprised an oncogenic self-protein that is nonmutated and overexpressed in malignant cells.
Our previous studies exploring multiple vaccination approaches with the tumor self-protein D52 demonstrated success in inducing a specific T cell response capable of rejecting tumor formation.Citation4 Importantly, although D52 is a non-mutated self-protein that is overexpressed in malignant cells, autoimmunity does not occur in mice vaccinated with D52, even when classic CD4+ CD25+ Treg cells are depleted with anti-CD25 mAb administered with D52 vaccination.Citation3,Citation5 Multiple vaccination approaches were successful at eliciting protection from tumor challenge, nonetheless complete protection (100%) from tumor challenge has not yet been achieved.Citation4 We postulate that this may be due, in part, to the self-nature of the vaccine antigen D52 eliciting a unique subset of CD8+ IL-10+ T cells with regulatory potential.Citation15,Citation16
To further explore the role of IL-10 in suppressing D52 vaccine-induced tumor immunity, IL-10-deficient mice were vaccinated with D52 followed by a tumor challenge. A significant delay in tumor growth was observed in D52-vaccinated IL-10-deficient mice following primary tumor challenge. Importantly, when mice were tested for vaccine durability by a secondary tumor challenge in the opposite flank, mice deficient in IL-10 had a 100% recall of protective immunity, while only 25% of wt mice were protected from re-challenge.Citation15 Our previous studies demonstrate that IL-10 has an impact on the suppression of memory T cell responses following vaccination with the nonmutated tumor self-protein, D52.
In the study described herein, deep RNA sequencing analyses comparing differential gene expression in CD8+ T cells isolated from D52-vaccinated IL-10-deficient (IL-10KO) and IFN-γ-deficient (IFNgKO) mice revealed many shared genes but also significant differences in expressed genes. The Venn diagram in illustrates many similarities in mRNA expression in these two populations of CD8+ T cells as well as genes that are unique for each population of CD8+ T cells. In addition, the heat map () and the graphic depiction of fold change in gene expression () define the differences between the two populations of CD8+ T cells as transcription factors and cell surface expressed proteins. Among the surface protein markers that stood out were chemokine receptor 8 (CCR8) and inducible T-cell costimulator (ICOS). This differential mRNA expression data was further verified with multiplex endpoint RT-PCR and real-time RT-PCR studies employing target-specific primers (). The results revealed a significant increase in the expression of CCR8 and ICOS in CD8+ IL-10+ T cells isolated from D52-vaccinated IFNgKO mice compared to IL-10KO mice. Comparing these differences to CD8+ T cells isolated from wt D52-vaccinated mice, CCR8 mRNA expression remained significantly higher in CD8+ IL-10+ T cells from vaccinated IFNgKO mice. These data further suggest that CCR8 and ICOS represent surface markers that could be used to isolate and define these CD8+ IL-10+ T cells from vaccinated wild-type mice. Protein expression of CCR8 was evident in all CD8+ T cell protein lysates (). Larger studies will be necessary to isolate sufficient numbers of these CD8+ T cells to assess the surface expression of CCR8 protein. These future efforts will facilitate further analysis of the role of CCR8 on CD8+ IL-10+ T cells elicited by D52 vaccination, and to determine whether CCR8 can be used to isolate and population of CD8+ IL-10+ T cells.
ICOS+ T regulatory cells have been shown to have an increased ability to survive and proliferate compared to ICOS- T regs, thus leading to increased suppressive activity of ICOS+ T regs.Citation29,Citation30 ICOS deficiency has been associated with impairment of IL-10 production and increased apoptosis of Foxp3+ T regs.Citation31,Citation32 These studies demonstrate the immunologic importance of ICOS and its role in enhancing survival and function of both effector and regulatory T cells. While there are numerous studies detailing ICOS expression on classic CD4+ T regulatory cells, little is known about ICOS and CD8+ T regulatory cells.
CD4+ CCR8+ Foxp3+ T regs have been described as master drivers of immune regulation that produce IL-10 and granzyme B, resulting in enhanced immune suppressive activity.Citation33,Citation34 Binding of CCR8 by CCL1-Ig results in the suppression of autoimmune disease in mouse models, suggesting that CD4+ CCR8+ Treg cells may prevent autoimmunity.Citation33 Conversely, neutralization of CCL1 resulting in the downregulation of CCR8 enhances antitumor immunity.Citation35 Importantly, CCR8 expression on tumor resident CD4+ T regs is often upregulated in tumors that resist treatment.Citation36,Citation37 Targeting CCR8 induces protective antitumor immunity and enhances vaccine-induced responses in models of colorectal cancer.Citation38 These results suggest that targeting CCR8 on CD8+ T regs may increase overall antitumor immunity.
In conclusion, vaccination with the oncogenic tumor-self protein D52 elicits in addition to effector CTLs a CD8+ T cell sub-population that is CCR8+ ICOShi and produces IL-10. This combination of marker expression and IL-10 production is consistent with published Treg phenotypes. It is known that chronic antigen exposure leading to CD8+ effector T cell exhaustion in viral infection, cancer, and autoimmunity is associated with increased expression of PD-1.Citation39 Our data corroborates this with increased expression of PD-1 on effector CTLs compared to CD8+ CCR8+ ICOShi IL-10+ T cells following repeat injections with D52. The focus of this study was to begin to assign a phenotype to the D52 vaccine-induced subset of CD8+ T cells that express IL-10. The tumor-self antigen vaccine elicited CD8+ IL-10+ T cells may be partially responsible for the lack of complete tumor rejection following vaccination against D52, and may also function in vaccine responses against similar self-antigens like Survivin, hTERT, or α-enolase. Targeting these CD8+ IL-10+ T cells (perhaps via anti-CCR8 mAb)Citation38 with vaccination may increase the overall antitumor immune response and lead to a more powerful immunotherapy against multiple types of cancers that share oncogenic tumor-self antigens like D52.
RNAseq studies were inconclusive from wild-type mice, thus requiring the use of strain- and gender-matched GEMs deficient in the differentiating cytokines, IL-10, and IFN-γ in a direct comparison. We used RNAseq because it requires very few cells (1 × 10⁶ total cells provided sufficient RNA and protein to perform the experiments herein, arguably this is not enough cells to properly perform flow cytometry). The absence of flow cytometry data at this early stage is a shortcoming; however, it became evident that this potential Treg population though detectable is in very low frequency in vaccinated wild-type mice, and we would not be able to acquire enough cells to properly conduct flow cytometry experiments, this with the absence of defined pMHC-I (peptide) epitopes at this early stage also prevented tetramer generation and staining experiments. Both CCR8 and ICOS are expressed by non-regulatory immune cells, it logically followed that a mandatory marker for identification must include IL-10. It is not possible to obtain viable cells when sorting based on intracellular cytokine staining. To sort enough viable cells for subsequent in vitro and in vivo functional interrogation it will require vaccinating large numbers of wild-type mice, isolation of CD8+ T cells from the mice, expanding those cells in vitro (from experience will include both IFN-γ+ and IL-10+ CD8 T cells) then sorting CCR8+, ICOShi cells (focusing on the brightest cell populations) from this dual population of CD8+ T cells and confirming IL-10 production in the absence of IFN-γ production. This will allow us to sort the CD8+ T cells that are CCR8+, ICOS+ (bright) and IL-10+ in large enough numbers to further interrogate the cells for markers to determine frequency in wild-type mice and for functional assays to include cell transfer to assess immune suppression in vivo and for the identification of TCR epitope specificities. Our data herein suggests that our current findings of a potential phenotype are a critical first step that should facilitate functional analyses based on differentiation of IL-10+ from IFN-γ+ cells in the dual population of CD8 T cells elicited by D52 vaccination.
Abbreviation
| TPD52 | = | tumor protein D52 |
| mD52 | = | murine D52 |
| hD52 | = | human D52 |
| IL-10 | = | interleukin 10 |
| IFN-γ. | = | interferon gamma |
| Treg | = | T regulatory cell |
| ICOS | = | inducible co-stimulatory |
| CCR8 | = | chemokine receptor 8 |
| wt | = | wild type |
| im | = | intra muscular |
| KO | = | knock out (gene-deficient mice) |
| CTL | = | cytotoxic T lymphocyte |
Disclosure statement
No potential conflict of interest was reported by the author(s).
Additional information
Funding
References
- Payton LA, Lewis JD, Byrne JA, Bright RK. Vaccination with metastasis-related tumor associated antigen TPD52 and CpG/ODN induces protective tumor immunity. Cancer Immunol Immunother. 2008;57(6):1–14. doi:10.1007/s00262-007-0416-y.
- Lewis JD, Sullivan LA, Byrne JA, de Riese W, Bright RK. Memory and cellular immunity induced by a DNA vaccine encoding self-antigen TPD52 administered with soluble GM-CSF. Cancer Immunol Immunother. 2009;58(8):1337–1349. doi:10.1007/s00262-009-0659-x.
- Bright JD, Schultz HN, Byrne JA, Bright RK. Injection site and regulatory T cells influence durable vaccine-induced tumor immunity to an over-expressed self-tumor associated antigen. OncoImmunol. 2013;7:e25049) 1–11.
- Bright RK, Bright JD, Byrne JA. Overexpressed oncogenic tumor-self antigens. Hum Vacc & Immunother. 2014;10(11):3297–3305. doi:10.4161/hv.29475.
- Bright JD, Aldrich JF, Byrne JA, Bright RK. Vaccination with the prostate cancer over-expressed tumor self-protein TPD52 elicits protective tumor immunity and a potentially unique subset of CD8+ T cells. Austin J Clin Immunol. 2014;1:13.
- Mirshahidi S, Kramer VG, Whitney JB, Essono S, Lee S, Dranoff G, Anderson KS, Ruprecht RM. Overlapping synthetic peptides encoding TPD52 as breast cancer vaccine in mice: Prolonged survival. Vaccine. 2009;27(12):1825–1833. doi:10.1016/j.vaccine.2009.01.089.
- Lewis JD, Payton LA, Whitford JG, Byrne JA, Smith DI, Yang L, Bright RK. Induction of tumorigenesis and metastasis by the murine orthologue of tumor protein D52. Mol Cancer Res. 2007;5(2):133–144. doi:10.1158/1541-7786.MCR-06-0245.
- Shehata M, Bieche I, Boutros R, Weidenhofer J, Fanayan S, Spalding L, Zeps N, Byth K, Bright RK, Lidereau R, et al. Nonredundant functions for tumor protein D52-like proteins support specific targeting of TPD52. Clin Cancer Res. 2008;14(16):5050–5060. doi:10.1158/1078-0432.CCR-07-4994.
- Balleine RL, Fejzo MS, Sathasivam P, Basset P, Clarke CL, Byrne JA. The hD52 (TPD52) gene is a candidate target gene for events resulting in increased 8q21 copy number in human breast carcinoma. Genes Chromosom Cancer. 2000;29(1):48–57. doi:10.1002/1098-2264(2000)9999:9999<:AID-GCC1005>3.0.CO;2-O.
- Rubin MA, Varambally S, Beroukhim R, Tomlins SA, Rhodes DR, Paris PL, Hofer MD, Storz-Schweizer M, Kuefer R, Fletcher JA, et al. Over expression, amplification, and androgen regulation of TPD52 in prostate cancer. Cancer Res. 2004;64(11):3814–3822. doi:10.1158/0008-5472.CAN-03-3881.
- Byrne JA, Balleine RL, Fejzo MS, Mercieca J, Chiew YE, Livnat Y, St Heaps L, Perters GB, Byth K, Karlan BY, et al. Tumor protein D52 (TPD52) is over expressed and a gene amplification target in ovarian cancer. Int J Cancer. 2005;117(6):1049–1054. doi:10.1002/ijc.21250.
- Largo C, Alvarez S, Saez B, Blesa D, Martin-Subero JI, Gonzalez-Garcia I, Brieva JA, Dopazo J, Siebert R, Calasanz MJ, et al. Identification of overexpressed genes in frequently gained/amplified chromosome regions in multiple myeloma. Haematologica. 2006;91:184–191.
- Hummel M, Bentink S, Berger H, Klapper W, Wessendorf S, Barth TF, Bernd HW, Cogliatti SB, Dierlamm J, Feller AC, et al. A biologic definition of Burkitt’s lymphoma from transcriptional and genomic profiling. N Engl J Med. 2006;354(23):2419–2430. doi:10.1056/NEJMoa055351.
- Loukopoulos P, Shibata T, Katoh H, Kokubu A, Sakamoto M, Yamazaki K, Kosuge T, Kanai Y, Hosoda F, Imoto I, et al. Genome-wide array-based comparative genomic hybridization analysis of pancreatic adenocarcinoma: Identification of genetic indicators that predict patient outcome. Cancer Sci. 2007;98(3):392–400. doi:10.1111/j.1349-7006.2007.00395.x.
- Elizondo CR, Bright JD, Byrne JA, Bright RK. Analysis of CD8+ IL-10+ T cell response elicited by vaccination with the oncogenic tumor-self protein D52. Hum Vaccin Immunother. 2020;16(6):1413–1423. doi:10.1080/21645515.2019.1689746.
- Bright RK, Mamula MJ. Regulation of adaptive immune responses to self-antigens in cancer and autoimmunity. Current Trends in Immunol. 2014;15:47–57.
- Kiniwa Y, Miyahara Y, Wang HY, Peng W, Peng G, Wheeler T, Thompson TC, Old LJ, Wang R. CD8+ Foxp3+ regulatory T cells mediate immunosuppression in prostate cancer. Clin Cancer Res. 2007;13(23):6947–6958. doi:10.1158/1078-0432.CCR-07-0842.
- Endharti AT, Rifa’l M, Shi Z, Fukuoka Y, Nakahara Y, Kawamoto Y, Takeda K, Isobe K, Suzuki H. Cutting edge: CD8 + CD122 + regulatory T cells produce IL-10 to suppress IFN-γ production and proliferation of CD8 + T cells. J Immunol. 2005;175(11):7093–7097. doi:10.4049/jimmunol.175.11.7093.
- Saitoh O, Abiru N, Nakahara M, Nagayama Y. CD8+CD122+ T cells, a newly identified regulatory T subset, negatively regulate Graves’ hyperthyroidism in a murine model. Encocrinol. 2007;148(12):6040–6046. doi:10.1210/en.2007-0300.
- Lee YH, Ishida Y, Rifa’i M, Shi Z, Isobe K, Suzuki H. Essential role of CD8+CD122+ regulatory T cells in the recovery from experimental autoimmune encephalomyelitis. J Immunol. 2008;180(2):825–832. doi:10.4049/jimmunol.180.2.825.
- Suzuki H, Shi Z, Okuno Y, Isobe K. Are CD8+CD122+ cells regulatory T cells or memory T cells? Hum Immunol. 2008;69(11):751–754. doi:10.1016/j.humimm.2008.08.285.
- Wang L-X, Li Y, Yang G, Pang P-Y, Haley D, Walker EB, Urba WJ, H-M H. CD122 + CD8 + Treg suppress vaccine-induced antitumor immune responses in lymphodepleted mice. Eur J Immunol. 2010;40(5):1375–1385. doi:10.1002/eji.200839210.
- Sun J, Dodd H, Moser EK, Sharma R, Braciale TJ. CD4+ T cell help and innate-derived IL-27 induce Blimp-1-dependent IL-10 production by anti-viral CTLs. Nat Immunol. 2011;12(4):327–334. doi:10.1038/ni.1996.
- Rifa’i M, Shi Z, Zhang SY, Lee YH, Shiku H, Isobe K, Suzuki H. CD8+CD122+ regulatory T cells recognize activated T cells via conventional MHC class I–αβTCR interaction and become IL-10-producing active regulatory cells. Int Immunol. 2008;20(7):937–947. doi:10.1093/intimm/dxn052.
- Lu L, Cantor H. Generation and regulation of CD8(+) regulatory T cells. Cell Mol Immunol. 2008;5(6):401–406. doi:10.1038/cmi.2008.50.
- Fousteri G, Kuka M. The elusive identity of CXCR5+ CD8 T cells in viral infection and autoimmunity: Cytotoxic, regulatory, or helper cells? Mol Immunol. 2020;119:101–105. doi:10.1016/j.molimm.2020.01.007.
- Toni LS, Carroll IA, Jones KL, Schwisow JA, Minobe WA, Rodriguez EM, Altman NL, Lowes BD, Gilbert EM, Buttrick PM, et al. Sequential analysis of myocardial gene expression with phenotypic change: Use of cross-platform concordance to strengthen biologic relevance. PLoS ONE. 2019;14(8):e0221519. doi:10.1371/journal.pone.0221519.
- Sky Ng TH, Britton GJ, Hill EV, Verhagen J, Burton BR, Wraith DC. Regulation of adaptive immunity; the role of interleukin-10. Front Immunol. 2013;4:1–13. doi:10.3389/fimmu.2013.00001.
- Burmeister Y, Lischke T, Dahler AC, Mages HW, Lam K-P, Coyle AJ, Kroczek RA, Hutloff A. ICOS controls the pool size of effector-memory and regulatory T cells. J Immunol. 2008;175:2340–2348.
- Simpson TR, Quezada SA, Allison JP. Regulation of CD4 T cell activation and effector function by inducible costimulatory (ICOS). Curr Opinion in Immunol. 2010;22(3):326–332. doi:10.1016/j.coi.2010.01.001.
- Takahashi N, Matsumoto K, Saito H, Nanki T, Miyasaka N, Kobata T, Azuma M, Lee S, Mizutani S, Morio T. Impaired CD4 and CD8 effector function and decreased memory T cell populations in ICOS-deficient patients. J Immunol. 2009;182(9):5515–5527. doi:10.4049/jimmunol.0803256.
- Redpath SA, van de Werf N, Cervera AM, MacDonald AS, Gray D, Maizels RM, Taylor MD. ICOS controls Foxp3 + regulatory T-cell expansion, maintenance and IL-10 production during helminth infection. Eur J Immunol. 2013;43(3):705–715. doi:10.1002/eji.201242794.
- Barsheshet Y, Wildbaum G, Levy E, Vitenshtein A, Akinseye C, Griggs J, Lira SA, Karin N. Ccr8+foxp3+ T reg cells as master drivers of immune regulation. Pnas. 2017;114(23):6086–6091. doi:10.1073/pnas.1621280114.
- Karin N. Chemokines and cancer: New immune checkpoints for cancer therapy. Current Opinion in Immunol. 2018;51:140–145. doi:10.1016/j.coi.2018.03.004.
- Hoelzinger DB, Smith SE, Mirza N, Dominguez AL, Manrique SZ, Lustgarted J. Blockade of CCL1 inhibits T regulatory cell suppressive function enhancing tumor immunity without affecting T effector responses. J Immunol. 2010;184(12):6833–6842. doi:10.4049/jimmunol.0904084.
- Plitas G, Konopacki C, Wu K, Bos PD, Morrow M, Putintseva EV, Chudakov DM, Rudensky AY. Regulatory T cells exhibit distinct features in human breast cancer. Immunity. 2016;45(5):1122–1134. doi:10.1016/j.immuni.2016.10.032.
- De Simone M, Arrigoni RG, Gruarin P, Randzani V, Politano C, Politano C, Bonnal RP, Provasi E, Sarnicola M, Panzeri I, et al. Transcriptional landscape of human tissue lymphocytes unveils uniqueness of tumor-infiltrating T regulatory cells. Immunity. 2016;45(5):1135–1147. doi:10.1016/j.immuni.2016.10.021.
- Villarreal DO, L’Huillier A, Armington S, Mottershead C, Filippova EV, Coder BD, Petit RG, Princiotta MF. Targeting CCR8 induces protective antitumor immunity and enhances vaccine-induced responses in colon cancer. Cancer Res. 2018;78(18):5340–5348. doi:10.1158/0008-5472.CAN-18-1119.
- Collier JL, Weiss SA, Pauken KE, Sen DR, Sharpe AH. Not-so-opposite ends of the spectrum: CD8+ T cell dysfunction across chronic infection, cancer and autoimmunity. Nature Immunol. 2021;22(7):809–819. doi:10.1038/s41590-021-00949-7.