
 ?Mathematical formulae have been encoded as MathML and are displayed in this HTML version using MathJax in order to improve their display. Uncheck the box to turn MathJax off. This feature requires Javascript. Click on a formula to zoom.
ABSTRACT
New vaccine introductions (NVIs) raise issues of value for money (VfM) for self-financing middle-income countries like Egypt. We evaluate a pediatric pneumococcal conjugate vaccine (PCV) NVI in Egypt from health payer and societal perspectives, using cost-utility and cost-benefit analysis (CUA, CBA). We evaluate vaccinating 100 successive birth cohorts with the 13-valent PCV (“PCV13”) and the 10-valent PCV (“PCV10”) relative to no vaccination and each other. We quantify health effects with a disease incidence projection model and a multiple-cohort static disease model. Our CBA uses a health-augmented lifecycle model to generate willingness-to-pay for health gains from which we calculate rates of return (RoR). We obtain parameters from the published literature. We perform deterministic and probabilistic sensitivity analysis. Our base-case CUA finds incremental cost-effectiveness ratios (ICERs) for PCV13 and PCV10 relative to no program of $926 (95% confidence interval $512–$1,735) and $1,984 ($1,186-$3,805) per quality-adjusted life year (QALY), respectively; and for PCV13 relative to PCV10 of $174 ($88-$331) per QALY. Our base-case CBA finds RoRs to PCV13 and PCV10 relative to no program of 488% (188–993%) and 164% (33–336%), respectively, and to PCV13 relative to PCV10 of 3109% (1410–6602%). Both CUA and CBA find PCV13 to be good VfM relative to PCV10.
Introduction
Streptococcus pneumoniae (SP) is a bacterial pathogen causing serious infections such as pneumonia requiring hospitalization and invasive pneumococcal diseases (IPD) such as bacteremia and meningitis. It also causes common mild infections manifesting as outpatient-treatable pneumonia and acute otitis media (AOM). Globally, SP is the major cause of lower-respiratory-infection-related mortality and morbidityCitation1 and causes more such mortality than all other etiologies combined.Citation1 Incident cases are highest in young children and the elderly.Citation2 In 2015, SP caused 317,300 deaths in young children worldwide,Citation3 approximately 6% of the 5.3 million total child deaths.Citation4,Citation5
SP has more than 90 serotypes.Citation2,Citation6 Different pneumococcal conjugate vaccines (PCVs) offer protection against different sets of serotypes:Citation6 the 7-valent PCV (“PCV7,” PrevenarTM, Pfizer) came into use in 2000 and covers seven serotypes,Citation7 the 10-valent PCV (“PCV10,” SynflorixTM, GlaxoSmithKline) was introduced in 2009 and added another three serotypes, while the 13-valent PCV (“PCV13,” Prevenar13TM, Pfizer) from 2010 added a further three, providing coverage against the most common serotypes causing IPD in young children worldwide.Citation6,Citation8
Pediatric PCVs have had substantial impact on global public health due to high SP burdens and PCVs’ direct and herd effects.Citation3,Citation9–13 Yet their value-for-money (VfM) is less well understood, which risks undervaluation and underuse. The World Health Organization (WHO) recommends all countries include pediatric PCV in their National Immunization Program (NIP).Citation2 However, as of March 2019, 40% of infants worldwide live in countries without pediatric PCV in their NIP, leaving approximately 55 million children worldwide without access.Citation14 Most of the 50 countries without such programs are developing countries with per capita incomes too high to qualify for financial support from the Global Alliance for Vaccines and Immunization (Gavi).Citation5,Citation15–17 Thus, Gavi-ineligible middle-income countries (MICs) like Egypt must self-finance and make decisions informed by VfM estimates to ensure that health payer and public sector budgets are optimally allocated.
New vaccine introductions (NVIs) implicate economic decision-making at three levels within a country. First, Ministries of Health (MoH) in tax-financed health systems often operate within fixed budgets set by Ministries of Finance (MoF) and must decide whether to accommodate NVIs at the expense of other health technologies. In turn, MoFs regularly operate within an overall public sector budget constrained by legislature-determined tax revenues and decide whether to raise MoH budgets to render NVIs affordable at the expense of non-health-related public expenditures (e.g., education and infrastructure). Finally, legislatures typically set taxes and therefore can expand or contract the public sector budget from which the MoF allocates funds to the MoH for NVIs. Thus, MoH require VfM comparisons across health technologies, MoF require such comparisons between health- and non-health-related public expenditures, and legislatures require such comparisons between the VfM of any increased health expending and the opportunity costs to households in terms of foregone disposable income. Economic evaluations require VfM measures capable of informing all three decision-makers.
Two specification choices are central to VfM calculations. First is the choice of perspective, typically between the health payer and societal perspectives. In the health payer perspective, the core value elements are health gains, typically quality-adjusted life years (QALYs), and payer net budget savings, typically vaccination costs net of averted direct medical costs. In this perspective, QALYs are implicitly valued at the MoF’s willingness-to-pay (WTP) per QALY (henceforth “policymakers’ WTP”) as reflected in the size of the payer’s budget, such WTP measured by the incremental cost-effectiveness ratio (ICER) of the marginal funded health technology. This perspective assumes the size of the payer’s budget is optimal, and thus does not produce VfM indicators that illuminate MoF and legislature decisions. According to the societal perspective, the broader socio-economic benefits of health gains matter, and should be valued along with those health gains at individuals’ rather than policymakers’ WTP.
The second choice is whether, within the societal perspective, VfM should be quantified using cost-utility analysis (CUA) or cost-benefit analysis (CBA). Societal-perspective CUA is associated with representative individuals’ WTP per QALY benchmarked at 1–3 times per capita gross domestic product (GDP) and widely used as a cost-effectiveness threshold. The theory is that if a technology’s ICER falls below this WTP per QALY, it should somehow be provided (through a mix of accommodating taxation, finance ministry, and health payer decisions) because it costs less to individuals (the ultimate funders of health spending) than its health gains are worth to them. This single WTP value applied to all QALYs reflects an equal value per QALY assumption.Citation18 For all these societal perspective CUA features to be given rigorous economic foundations, such WTP should be derived from individuals’ lifetime budget-constrained utility maximization problem. But the assumptions required for deriving such constant WTP include age-invariant consumption and non-market time and perfect capital markets, which are clearly false. There is also uncertain economic support for the benchmark value of 1–3 times per capita GDP.
We take a step toward generating WTP for health values that are more closely, if still imperfectly, tied to economic utility and welfare theory and related evidence. We generate such WTP from a health-augmented lifecycle model (HALM) and a lifetime budget constrained utility maximization model that unites two virtues. First, the HALM can reflect the complex relationships between health and a full range of economic variables like consumption, paid and unpaid work, leisure, and resource constraints over the lifecycle. Such complexity suggests the falsity of the equal value per QALY assumption because health associated with more net economic good will have higher value. Second, the HALM stays within a value framework (utility theory) with attractive axiomatic and ethical foundations (the expected utility axioms and welfarism) capable of informing policy decisions.
The only published economic evaluation of pediatric PCVs in Egypt is Sibak et al. (2015).Citation19 It was a CUA from the governmental perspective and found introducing PCV13 into the NIP to be cost-effective relative to no vaccine. A recent systematic review by Saokaew et al. (2016)Citation20 of the cost effectiveness of childhood pneumococcal vaccination in lower middle-income countries and MICs identified 22 post-2010 economic evaluations of childhood PCV in developing countries. These studies were CUAs generally from a health payer or government perspective. Studies from the societal perspective tended to consider lost productivity of caregivers but not patients. They did not estimate individual WTP per QALY, but instead compared ICERs to standard benchmarks: ICERs below three times per capita GDP were considered cost-effective and ICERs below per capita GDP were highly cost-effective. Apart from an early Thailand study,Citation21 studies in Saokaew et al.’s review found PCVs cost-effective and in some cases highly cost-effective. In the six studies that compared PCV13 to PCV10, four found that PCV10 dominates PCV13, and two found that PCV13 dominates PCV10.
We prospectively evaluate pediatric PCV NVIs in Egypt from a societal perspective using a CBA. Our analysis is a societal perspective analysis in that we value health using individual rather than policymaker WTP (and show such WTP to be a function of paid and unpaid work, consumption, and leisure). A societal perspective is more likely to produce decisions that maximally contribute to individual and societal welfare in Egypt and produce VfM measures able to inform all national decision-makers with potential roles in vaccination policy. We use CBA for its superior flexibility and conformity with economic theory and evidence. We use a HALM to generate age-varying individual WTP for health reflecting its interactions with consumption, paid and unpaid work, and leisure over the lifecycle. We express VfM in the form of a rate of return (RoR), which unlike ICERs can inform finance ministries and legislatures in addition to payers. We also compute ICERs from a traditional payer perspective CUA, which are of interest to stakeholders and facilitate benchmarking our results to the literature. Our study expands upon the literature by adopting a fuller societal perspective incorporating patient productivity, unpaid work, consumption, and leisure; and introducing a novel CBA-HALM based approach.
Methods
Overview
We prospectively evaluate pediatric PCVs in Egypt using a societal perspective CBA and payer perspective CUA. We evaluate PCV13 and PCV10 NVIs relative to no program and relative to each other. The “no program” comparator represents the status quo in Egypt. We compare PCV13 to PCV10 because these are the two most widely used and studied vaccines in the pediatric pneumococcal vaccination literature and because they are the relevant options in the Egyptian context. We evaluate a two-dose and one-booster (2 + 1) vaccination schedule for both vaccines, the schedule used in the countries from which we extrapolate vaccine impacts onto Egypt’s base-year conditions. To capture the long-term impacts of SP and PCV in Egypt, we adopt a 100-year modeling horizon, which is recommended and common in the pediatric PCV literature.Citation20 Our base year is 2016, thus our model runs from 2016 to 2115. Our analysis population consists of 100 successive birth cohorts eligible for vaccination in the year of birth, and a single age-stratified vaccine-ineligible cohort aged 1–99 years in the base year 2016 that potentially benefits from herd protection.
We choose the 100-year modeling horizon because our vaccine impact model presumes ongoing vaccination, and because it is standard to model 100-year life spans for vaccinated cohorts. Given uncertainties associated with long modeling horizons, we perform a scenario analysis that reduces the modeling horizon to 60 years (to cover the earnings benefits realized during the working ages).
We use three models in our analysis. The first is a multiple-cohort static Markov model of SP that takes incidence rates and other parameters as inputs and outputs distributions over health states. The second is a novel incidence rate projection model similar to a previously published forecasting model that projects PCV impacts on incidence rates at the serotype level.Citation22–28 The third is a health-augmented lifecycle model (HALM) that follows the specification of Murphy and Topel (2006),Citation29 which we use to derive individuals’ WTP throughout their lifetimes to reduce mortality and morbidity risks.
We parametrize these three models with local epidemiological and economic data where feasible. As a PCV naïve country (i.e., a country without a pediatric PCV NIP), there are no Egypt-specific data on PCV direct or indirect effects, therefore evidence of such effects must come from international sources. In transferring these and other missing epidemiological parameters across countries, we follow guidelines in the literature,Citation30 and apply widely used imputation and extrapolation methods. When imputing missing economic data from other countries, we select comparator countries based on geographic proximity and similarity with respect to the Socio-Demographic IndexCitation31 and per capita GDP (purchasing power parity).Citation32 To address uncertainty, we perform one-way deterministic and multivariate probabilistic sensitivity analysis on key parameter values, described below. We also assess the impact of specific modeling assumptions (e.g., indirect effect assumptions) with scenario analyses.
This section briefly describes our models, methods, and data. Supplemental Files A1-A3 provide details.
Markov model
Structure
We model disease progression with a multiple-cohort static Markov model of SP. Our use of a Markov model of SP and its specification are standard in the pediatric pneumococcal disease literature.Citation21,Citation33–35 Our Markov model’s annual cycle trees are represented in . There is one such cycle for each integer age within the possible lifespan of any member of the analysis population during the model horizon spanning the years 2016 to 2115. Therefore, there are 100 such cycles for the 2016 birth cohort, 99 such cycles for both the 2017 birth cohort (representing ages 0–99) and those aged one in 2016 (representing ages 1–100), and so on. The “Cohorts exposed” in represent the entire analysis population. All cohorts within the analysis population enter the model in the uninfected state. Birth cohorts face a one-time opportunity to vaccinate in the year of birth. Cohort members are at risk of no more than one infection per cycle. Programs A and B are the policies being compared (i.e., PCV13 vs no program, PCV10 vs no program, PCV13 vs PCV10). No individual lives beyond the 100th year of life or year 2115, whichever is first.
Figure 1. (a) Markov cycle tree of Streptococcus pneumoniae. The structure of the “Program B” branch is the same as that of the “Program A” branch. SP: Streptococcus pneumoniae; OCAP: Outpatient pneumococcal pneumonia; ICAP: Inpatient pneumococcal pneumonia; AOM: Pneumococcal acute otitis media; OCAP_TD: Temporary disability after OCAP; ICAP_TD: Temporary disability after ICAP; MEN_TD: Temporary disability after meningitis; BACT_TD: Temporary disability after bacteremia; AOM_TD: Temporary disability after AOM; NDI: Neurodevelopmental impairment after meningitis. (b) Cycle tree for at least one major sequela from inpatient pneumonia. The structures of nodes C, D, E, and F in are the same as that of node B in . (c) Cycle tree for the multiple sequelae state.
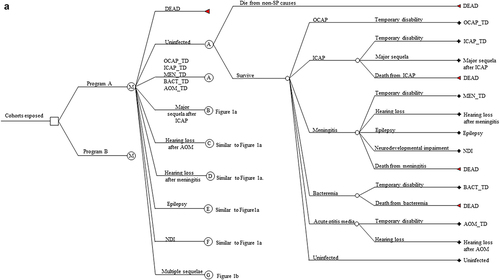
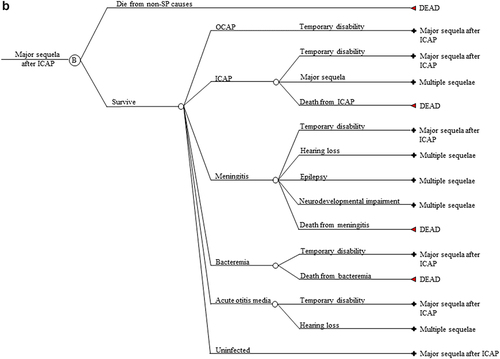
Figure 1. (Continued).
We allow five manifestations of SP: inpatient community-acquired pneumonia (CAP), outpatient CAP, bacteremia, meningitis, and AOM. There are five lifelong sequelae from these manifestations: at least one major sequela from inpatient CAP (restrictive lung disease, obstructive lung disease, or bronchiectasis); hearing loss, epilepsy, and neurodevelopmental impairment from meningitis; and hearing loss from AOM. Those in a first lifelong sequela state who become reinfected and experience a further lifelong sequela enter the lifelong multiple sequelae state. Cycle trees for a single major sequela after inpatient CAP and for multiple sequelae are shown in , respectively. The Markov cycle trees for the other four single sequela mirror that of a single major sequela after inpatient CAP in .
Each Markov state is associated with a health utility. We associate each infection with a one-time expected direct medical cost incurred during that cycle. Thus, we conservatively assume no repeat treatments per infection, even for those with multiple sequelae.
Markov model input parameters, excluding incidence rates in the presence of vaccination
reports our base-case input parameters by age for disease incidence in the no program status quo, case-fatality rates, sequelae probabilities, health utilities, and treatment costs. also reports the uncertainty bounds of the parameters we modify in sensitivity analysis, where the bounds reflect our judgment regarding the most unfavorable case (UC) and the most favorable case (FC) for the parameter values, where “favorable” means “favorable to the vaccination program.” (A high case fatality rate (CFR), for example, implies a high value for vaccination so we refer to our upper bound value for a CFR as the “FC” value).
Table 1. Markov model input parameters.
We construct the base-case incidence rates for pneumococcal bacteremia, meningitis, and inpatient and outpatient pneumonia from the mean values of the Egypt-specific estimates of incidence in young children from Wahl et al. (2018),Citation3 extrapolated to older age groups using age-specific incidence of pneumococcal meningitis (for IPD) and lower respiratory infection (for inpatient and outpatient pneumonia) from 2016 Global Burden of Disease (GBD) Institute for Health Metrics and Evaluations (IHME) data for EgyptCitation41 (see Supplemental File A1 for detail). We construct the AOM incidence rates from the mean values of the age-specific 2016 GBD IHME estimates of all-cause AOM for Egypt, converted to pneumococcal AOM using 26.4% pneumococcal derived from Ngo et al. (2016).Citation42
We derive the UC and FC values for our incidence rates for meningitis, bacteremia, inpatient pneumonia, and outpatient pneumonia from the uncertainty ranges reported in Wahl et al. (2018). We use the lower bound of the uncertainty range for the UC value and the upper bound for the FC value. For our base-year AOM incidence rates, we use the lower bound of the GBD IHME estimates for our UC value and the upper bound of the GBD IHME estimates for our FC value.
For CFRs, we use Egyptian data for children from Wahl et al. (2018)Citation3 described above and extrapolate to older ages using Malaysian age-specific CFR data from Wu et al. (2016),Citation43 whose values for children are similar to those for Egypt from Wahl et al. (2018).Citation3 We reduce our base case CFRs by 20% for our UC value and increase them by 20% for our FC value.
For our sequelae probabilities, we rely on Thai data for AOMCitation39 (hearing loss) and for meningitisCitation38 (hearing loss, epilepsy, and neurodevelopmental impairment), and on a global meta-analysisCitation40 for a major long-term sequela following inpatient pneumonia. In one-way sensitivity analysis, we change the base case values of the probabilities of hearing loss after AOM and long-term sequelae after inpatient pneumonia to the UC and FC values reported in , which we obtain from the confidence intervals for long-term sequelae after pneumonia and the standard errors for hearing loss after AOM reported in each data source.
In the absence of local health utilities, we obtain these parameters from Kulpeng et al. (2013)Citation21 for meningitis, bacteremia, and AOM sourced from Thailand, Aljunid et al. (2014),Citation37 for inpatient and outpatient pneumonia sourced from the United States, and from Sibak et al. (2015)Citation19 for multiple sequelae sourced from global estimates. We obtain or derive the UC and FC values for our health utility parameters from the uncertainty ranges or standard errors from these data sources. Our sequelae probabilities and health utilities have the advantages over alternative sources in the literature of having the necessary level of disaggregation by manifestation in addition to being relatively conservative and recent.
In our CUA and CBA, we combine the health state probabilities generated by the Markov model with the treatment costs associated with each health state to compute the expected present discounted value (EPDV) of treatment costs in each policy scenario (see equation 6.3 of Supplemental File A3), and therefore differences in such EPDV across scenarios. We use Egypt-specific direct medical costs from Sibak et al. (2015).Citation19 This study obtained treatment costs for pneumonia, meningitis and bacteremia from surveying physicians, and treatment costs for AOM were obtained from WHO-CHOICE. We adjust prices for the percent seeking treatment using the following Egypt-specific resource utilization parameters from Sibak et al.: 50% for AOM, 80% for outpatient pneumonia, 24% for inpatient pneumonia, 75% for bacteremia, and 100% for meningitis. We derive the UC and FC direct medical cost values using the lower bound and upper bound, respectively, of the Sibak et al. treatment cost and utilization parameters.
Projection model
We assume PCVs’ impact on disease outcomes is limited to incidence rates and not disease severity. As a PCV naïve country, Egypt has no local data on PCV effects on incidence rates. We must therefore extrapolate such effects from other countries. Standard approaches to extrapolating vaccine effectiveness across countries assume that either (i) vaccine effectiveness is constant across serotypes or (ii) baseline serotype distributions are similar across proxy and analysis countries. For example, one approachCitation44,Citation45 extrapolates PCV7 effectiveness to the serotypes in PCV10 not in PCV7 (“10n7” serotypes) or to those in PCV13 not in PCV7 (“13n7” serotypes) (which assumes (i)), and anotherCitation46 takes an overall vaccine effectiveness parameter from a proxy country, representing the percentage decline in overall IPD incidence (across all vaccine- and non-vaccine serotypes) caused by PCVs, and applies that parameter to overall IPD incidence (across all serotypes) in the analysis country (which assumes (ii)). But neither (i) nor (ii) holds.Citation47,Citation48 Some studies take some account of distributional differences and estimate analysis country overall vaccine effectiveness as the product of proxy country vaccine-type effectiveness and analysis country vaccine-type coverage.Citation49 But this is incomplete because distributional differences exist among individual vaccine-type serotypes.
To more fully account for failures of (i) and (ii) to hold, we go beyond the standard approaches of extrapolating PCV7 effectiveness to 10n7 and 13n7 serotypes, using a single overall vaccine effectiveness parameter, and adjusting only for coverage of vaccine-types as a whole. We instead use a non-parametric (age- and) serotype-specific incidence rate projection model that estimates serotype-specific incidence rate patterns in the proxy country and applies those patterns to only the same serotypes in Egypt, thus better accounting for serotype-specific effectiveness and serotype distribution differences. Since our approach is non-parametric, we have no explicit vaccine effectiveness parameters. Instead, vaccine effectiveness is implicit in the differences between incidence rate projections across the arms of a policy comparison (such non-parametric vaccine effectiveness measures are in below). We briefly describe our projection model below and provide full details in Supplemental File A1.
Figure 2. Incidence rate projection model results. Overall invasive pneumococcal disease (IPD) incidence rate projections. Projections under a PCV10 program (red); Projections under a PCV13 program PCV13 (blue). Horizontal axis is time (in years) since the introduction of a universal pediatric PCV program.
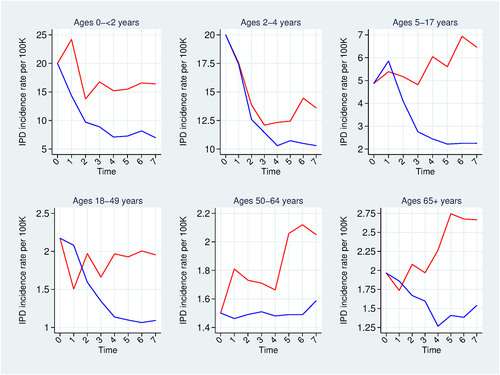
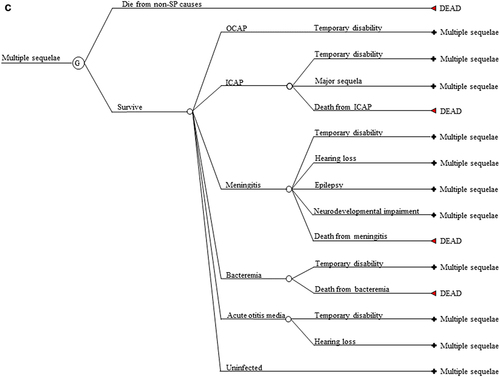
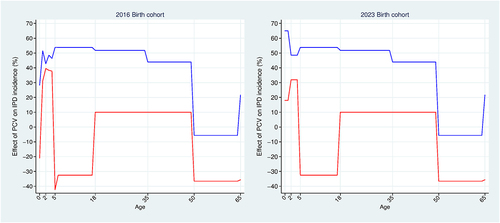
Figure 3. Incidence rate projection model results. Effect of pediatric PCVs against invasive pneumococcal disease. PCV effect = ((no program incidence – program incidence)/no program incidence)*100. PCV10 effects (red); PCV13 effects (blue). Population: 2016 and 2023 birth cohorts. Base-case analysis.
Invasive pneumococcal disease incidence rate projections
Our projection model takes as inputs age- and serotype-specific IPD incidence rate time series from proxy countries that have had universal pediatric PCV programs with long histories of high vaccination uptake and robust IPD surveillance: the UKCitation50 and FinlandCitation51 for PCV13 and PCV10, respectively. Finland has the added relevance of having introduced PCV10 into a PCV naïve setting (as opposed to a PCV7 setting), which is the specific PCV10 policy we model for Egypt. The projection model takes post-PCV age- and serotype-specific IPD incidence rates from the proxy countries, computes percentage and level changes over time in these rates, and extrapolates those changes onto estimates of base-year Egyptian pre-PCV age- and serotype-specific IPD incidence rates (such serotype-specific projection therefore accounting for serotype distribution differences at the individual serotype level). We derive Egyptian base-year age- and serotype-specific incidence rates by disaggregating the IPD incidence rates in using Egypt-specific serotype distribution data from Wasfy et al. (2005).Citation52 These baseline Egyptian serotype distributions differ from those of the proxy countries (see Table A1) suggesting the value of our serotype-specific projection approach. Both proxy countries used a two-dose and one-booster vaccination schedule as we assume for Egypt.
Given high PCV uptake rates and high-quality surveillance in Finland and the UK, we assume their incidence rates reflect PCVs’ population-wide serotype-specific direct and indirect effects (herd protection, serotype replacement, and any cross-protection of PCV10 for serotypes 19A or 6A) and the duration of these effects. Using serotype-specific real-world data (RWD) from high uptake proxy countries has the advantage of reducing reliance on assumption for estimates of these PCV-specific effects.
By projecting these countries’ direct- and indirect effects patterns to Egypt, we assume Egyptian PCV uptake will exceed the 80% required for herd effectsCitation53 and be roughly comparable to that in the proxy countries. Such assumption seems justified: Historical Egyptian uptake is between 92% and 99% for other pediatric vaccines in the NIP (e.g., DTP3 uptake in Egypt ranged from 93% to 98% between 2005 and 2016Citation54) and Egyptian PCV uptake of approximately 97% has also been assumed elsewhere in the published literature.Citation19 Our ICERs and RoRs are relatively insensitive to small variations in the uptake rate, since such variations affect costs and benefits proportionately. So for simplicity, we assume 100% PCV uptake.
In projecting incidence rates, the model treats non-vaccine type (NVT) serotypes as a single serotype group (i.e., non-PCV13 serotypes as a single serotype group when projecting PCV13 impacts, and similarly for non-PCV10 serotypes). In projecting NVT incidence, the model adjusts for differences in NVT prevalence between proxy countries and Egypt by scaling the percentage changes in NVT incidence rates over time in the proxy country by the ratio of baseline NVT prevalence in the proxy country to that in Egypt. This adjustment factor dampens proxy country serotype replacement effects in cases where baseline NVT serotype coverage is larger in Egypt compared with the proxy country.
We obtain the overall IPD incidence rate projections required by the Markov model by summing over the individual serotype projections. We disaggregate overall IPD projections into meningitis and bacteremia incidence rate projections using the percentage of IPD representing as meningitis from Melegaro and Edmunds (2004).Citation55
The available proxy country data allow us to generate seven years of within-sample projections. We project the seventh-year values to the remainder of the 100-year modeling horizon under the assumption that direct effects have fully waned by the end of the seven-year projection period and herd protection extends to the end of the 100-year modeling horizon. Therefore, like the RWD from which they are derived, our projected IPD incidence rates presume/reflect ongoing infant vaccination, and projected IPD herd effects can exist for all ages. Our assumption that a steady state is reached seven years after a PCV NVI is empirically supported by the patterns in the Finnish and UK incidence rate series, which generally appear stationary seven years after a PCV NVI (see Figures A1 and A2 in Supplemental File A1).
Non-IPD incidence rate projections
For children aged four and younger, we extrapolate PCV impact on IPD to pneumococcal pneumonia and AOM by assuming proportionality between invasive and noninvasive disease based on English experienceCitation56 and precedent from the literature.Citation57 We conservatively assume no PCV impact on non-IPD incidence after age four, hence we assume direct effects against non-IPD have fully waned five years after vaccination. We therefore allow herd protection against IPD in all ages, and against non-IPD only in children younger than age five. In scenario analysis, we allow herd effects against both IPD and inpatient pneumonia in all ages based on empirical evidence of such effects in some developed and developing countries.Citation10–Citation58–65
HALM
Derivation of value of a statistical life year and value of a statistical disability
Our HALM is a health-augmented budget constrained lifetime utility maximization problem that builds on the specification of Murphy and Topel.Citation29 Lifetime utility is the EPDV across all ages of age-specific period/moment utility. For simplicity and in contrast to the Markov model, our HALM has only two states, living and dead. Thus, all expectations in the HALM are taken with respect to the age-specific survival probability, which we denote by for a given age
and derive from the Markov model (which in turn reflects background and SP-specific mortality). The living state is associated with a health utility, which we parametrize to equal the expected health utility conditional on being alive, which is generated by the Markov model.
Moment utility equals the product of age-specific survival probability, health utility, and economic utility. Economic utility is a constant-relative-risk aversion (CRRA) function of composite consumption, which in turn is a constant elasticity of substitution function of consumption and non-market time. Non-market time consists of unpaid work and leisure. The multiplicative structure of moment utility implies that utility when dead is zero and health and economic utility are natural complements: the healthier the individual, the more utility comes from consumption and non-market time; and the higher the levels of consumption and non-market time, the more utility comes from health.
The budget constraint requires the EPDV of lifetime consumption to not exceed initial assets and the EPDV of lifetime income. This constraint reflects the assumption of perfect capital markets (PCM), which in turn reflects perfect credit markets for saving and borrowing and perfect annuities markets for insuring consumption against longevity risk. PCM and CRRA utility are benchmark assumptions that simplify the model and have precedents in the relevant literature.Citation29,Citation66 Important for future work are more realistic budget constraints reflecting borrowing constraints and imperfect insurance. The individual takes lifetime expected survival, expected health utility, wages, and initial wealth as given and chooses optimal lifetime consumption and time allocation (on paid work, unpaid work, and leisure) to maximize lifetime expected utility subject to the lifetime budget constraint. For an individual following this optimal trajectory, we compute their WTP for age-specific improvements in survival probability and health utility, also known technically as the compensating variations of such improvements, and which we call value of a statistical life year (VSLY) and value of a statistical disability (VSD), respectively.
WTP depends on health’s intrinsic and instrumental values. Intrinsic value involves the goodness of health in-and-of-itself, independently of its causal impact on the ultimate economic goods, consumption, and non-market time. It reflects the fact that survival probability and health utility are direct arguments (the first two multiplicative terms) in the expression for moment utility. This intrinsic value equals the partial derivative of moment utility with respect to either survival probability or health utility, holding consumption and non-market time constant, monetized by dividing through by the marginal utility of consumption. Given natural complementarity, this partial derivative and therefore intrinsic value will vary over the lifecycle and be larger at ages with higher consumption and non-market time.
Instrumental value involves health’s causal impact on consumption and non-market time, mediated by its impact on relaxing the budget constraint. Such value reflects the facts that consumption and non-market time have intrinsic value (i.e., they are direct arguments in the expression for economic utility and therefore moment utility), and that health has a causal effect on these. This causal effect works through a relaxation of the budget constraint: increased survival probability at a given age expands the lifetime budget, thereby facilitating consumption at other ages, by an amount proportional to net savings (income minus consumption) at that age. Thus, net savings is a measure of this instrumental value. We conservatively assume that disability does not affect productivity (i.e., wages) in the budget constraint, which implies that we do not allow disability to affect the budget constraint. Future work should allow disability to affect productivity.
We show in Supplemental File A2 that VSLY and VSD can be written in terms of observable economic quantities: full income equal to the sum of earnings and the monetized value of nonmarket time, full consumption
equal to the sum of consumption and the monetized value of nonmarket time, health utility
, and consumer surplus per unit of full consumption
(a standard quantity in empirical welfare economics). The value of nonmarket time is the product of wages and hours of nonmarket time. More specifically, for a given age
:
VSLY and VSD are positive functions of full consumption and consumer surplus given the complementarity between health and full consumption. VSLY is also a positive function of full income given that being alive expands production possibilities by that amount. VSD falls as health utility rises since health utility raises the marginal utility of consumption, which in turn lowers willingness to give up consumption for morbidity risk reductions.
Equations (1) and (2) make clear that (i) health’s value varies over the lifecycle along with the relevant economic quantities, falsifying the equal value per QALY assumption, (ii) health’s value reflects not only paid work as assumed in the standard human capital approach (where paid work is a proxy for consumption), but also unpaid work, leisure, and consumer surplus, (iii) the values of increased survival and quality of life are theoretically and empirically distinct, and therefore not collapsible into a single WTP per QALY that assumes their perfect substitutability, (iv) given the relatively determinate magnitudes and lifecycle trajectories of full income, full consumption, and health utility, the remaining critical determinant of the scale of these health values is consumer surplus . We calibrate the CRRA utility function, and therefore consumer surplus, using an estimate of subsistence consumption for Egypt and an equation setting the EPDV of VSLY for a median-aged working age adult equal to empirical estimates of the Egyptian Value of a Statistical Life (VSL). And (v), the data requirements of the approach are manageable and include VSL and lifecycle consumption, earnings, time use, and wages.
Parametrization of VSLY and VSD
The calibration of VSLY and VSD requires age-disaggregated data on lifetime consumption, earnings, nonmarket time, and wages, as well as the parameters of our utility function. We construct lifetime consumption and earnings by projecting National Transfer Accounts data for Turkey to Egypt using relative per capita GDP.Citation67,Citation68 Age-disaggregated hourly wages are constructed using International Labor Organization data for Egypt.Citation69,Citation70 Time use data are unavailable for Egypt, thus we source the data for nonmarket time from Turkish Statistical InstituteCitation71 and Office of National Statistics Algeria.Citation72 As stated above, we calibrate utility function parameters (the elasticity of intertemporal substitution and subsistence annual consumption) using an estimate of Egyptian subsistence consumption from Allen (2017)Citation73 and an equation setting the EPDV of VSLY for a median-aged working age adult equal to an empirical estimate of the Egyptian VSL ($198,396, in 2016 US dollars) that we derive using the methodology described in Robinson et al., (2019).Citation74 We detail this utility function parametrization and VSL derivation in Supplemental File A2 and report our HALM input parameters in . As shown in these derivations, VSL equals the EPDV of the VSLY from our economic model, which is in turn a function of annual consumption, earnings, and nonmarket time (see Equation 5.42 in Supplemental File A2). Therefore, in sensitivity analysis we vary VSL as a summary test of the sensitivity of our base-case CBA results to uncertainty in our economic parameters more generally.
Table 2. Health-augmented lifecycle model input parameters.
Value for money
Vaccine procurement costs
Vaccine procurement costs per dose are from 2019 Pan American Health Organization (PAHO) Revolving Fund Vaccine Prices.Citation75 The published prices are $12.85 per dose for PCV10 and $14.50 per dose for PCV13 to which an additional rebate is applied lowering them to $12.20 per dose for PCV10 and $13.85 per dose for PCV13. These procurement costs are very similar to those assumed for Egypt by Sibak et al. (2015).Citation19 Following Sibak et al.,Citation19 we increase net procurement costs by 5% to account for administration costs, which cover international handling (3%), international delivery (1%) and wastage (1%). The total vaccination costs per infant are $38.43 and $43.63 for three doses of PCV10 and PCV13, respectively.
The costs that enter our VfM measures (i.e., ICERs and RoRs) equal vaccination cost minus averted direct medical costs.
Benefits
Health outcomes from the Markov model
The Markov model generates probability distributions over health states under each policy scenario (no vaccination, PCV13 NVI, and PCV10 NVI). In our CUA, we combine these health state probabilities with health state utilities to compute the EPDV of QALYs associated with each policy scenario.
In our CBA, for each policy scenario, we combine health state probabilities generated by the Markov model and health state utilities to generate lifetime survival functions and expected health utilities conditional on being alive. Thus, any policy comparison is associated with differences in lifetime survival functions and lifetime expected health utilities, which for a given age we denote by
and
, respectively. (These age-specific differences vary by cohort but for simplicity we have suppressed the notation reflecting such cohort-specificity.) We value
at
and we value
at
.
The Markov model also outputs averted cases, hospital episodes, and deaths.
Preferences over health outcomes
In our CUA, preferences over health outcomes are represented by health utilities that we obtain from the literature. In our CBA, preferences over health outcomes are represented by individual WTP for improved survival and health utility, given by VSLY and VSD, respectively.
Willingness-to-pay for vaccination
VSLY and VSD generated by the HALM represent individual WTP per unit of survival and health utility improvements, respectively, while the Markov model generates the number of units of such improvements produced by vaccination. The individual benefit from vaccination is simply the individual WTP for vaccination, which equals the EPDV over a lifetime of these survival and health utility improvements monetized at VSLY and VSD, respectively.
Benefit outcomes
Benefit outcomes in our CUA are QALY gains and averted treatment costs, while benefit outcomes in our CBA are individual WTP for vaccination and averted treatment costs.
Program-wide outcomes and outcomes per vaccinated infant
We compute program-wide costs and program-wide benefits (i.e., QALY gains for our CUA, and WTP for vaccination for our CBA) by summing across all individuals in the analysis population, controlling for birth cohort sizeCitation76 and age structure within the vaccine-ineligible cohortCitation77 as well as discounting future birth cohorts’ costs and benefits at 3% per year.
We report results per-vaccinated infant equal to program-wide results normalized by the size of the vaccinated infant cohorts (see equations 6.1 and 6.2 in Supplemental File A3). (Note that program-wide benefits include herd effect benefits received by the vaccine-ineligible cohort, so benefits per vaccinated infant do not equal benefits directly received by each such infant.)
Value-for-money
Our value-for-money measures in our CUA and CBA are the ICER and RoR, respectively. We discount the costs and QALY and WTP benefits in these measures at 3% per year as recommended by the WHOCitation78 and commonly used in the literature.Citation20 In one-way sensitivity analysis, we consider alternative discount rates of 0%, 3.5%, and 5% as recommended by the literature.Citation79 We present our results in 2016 United States dollars (USD). Inflation and exchange rate adjustments are provided in Supplemental File A3.
Denoting program-wide benefits and costs by and
, respectively, the RoR to a PCV program relative to no program is:
The RoR to a PCV13 program relative to a PCV10 program replaces and
in (3) with the differences in
and
across the two programs.
We performed analysis in Stata 14.2 (Stata Corp) and Microsoft Excel.
Uncertainty
One-way deterministic sensitivity analysis
In one-way sensitivity analysis, we change the base-case values of base-year incidence rates, CFRs, probability of hearing loss after AOM, probability of long-term sequelae after inpatient pneumonia, health utilities, and direct medical costs to the UC and FC parameter values in . We vary the magnitude of the vaccination effectiveness implied by our incidence rate projection model by ±20% of the base-case value. We vary the VSL for the median age adult by ±10% the base-case value, and we change the discount rate to 0%, 3.5%, and 5%.
Multivariate probabilistic sensitivity analysis
A probabilistic sensitivity analysis (PSA) over the entire parameter space of our analysis is not feasible. We have three interconnected models, each of which is complex and parameter rich. Some of our parameters (e.g., VSL) are inputs into intensive numerical calculations (including integration), and some of our parameters are linked to each other by linear and non-linear constraints. All these render a full PSA prohibitive. We therefore perform a limited PSA encompassing the following six parameters, which in our judgment are among the most important drivers of value in an economic evaluation, and which are characterized by statistical uncertainty: base-year incidence rates, CFRs, implied vaccine effectiveness (recall that vaccine effectiveness is not an explicit parameter but rather is implied by our incidence rate projections given vaccination), health utility weights, medical treatment costs, and the VSL. For each of these six parameters, we fix an uncertainty interval around the base-case value, where the boundaries of such intervals are the UC and FC values. There are 36 = 729 unique combinations of these six parameters, each of which can take on three values: base case, UC, and FC. For each of these 729 combinations, we compute the relevant model outcomes like ICERs, RoRs, and averted cases, hospitalizations, and deaths.
We generate a frequency distribution for each of these 729 combinations as follows. For each parameter, we assume that the base case is twice as likely to be true as to be false, and that the UC and FC have equal probability. This implies that the probability of the base case is 2/3, the probability of the UC is 1/6, and the probability of the FC is 1/6.
We perform a simulation with 10,000 iterations. For each iteration we take six independent draws from a uniform distribution over the unit interval, one for each parameter. For each parameter, we set its value in the iteration to the FC value if the draw is , to the UC value if the draw is
, and to the base case value otherwise. After the values of all six parameters have been set in this manner, this iteration maps onto one of the 729 combinations. We repeat this process for each of the 10,000 iterations.
Each of the 10,000 iterations now maps onto one of the 729 combinations and the model outcomes associated with that combination. We then extract the 2.5th, 50th, and 97.5th percentile scores of model outcomes across the 10,000 iterations. By construction, the 50th percentile score replicates base-case results. The 2.5th and 97.5th percentile scores provide 95% confidence intervals (CI).
Scenario analysis
As shown in , in some cases the overall IPD incidence rate projected by our model exceeds the corresponding base-year overall IPD incidence rate. To assess the sensitivity of our results to allowing post-PCV incidence rate projections to exceed base-year levels (equivalently, allowing negative vaccine effectiveness), we perform a scenario analysis capping all projected overall IPD incidence rates at Egyptian base-year levels.
Our post-PCV incidence rate projections are serotype specific and most studies implicitly do not project PCV impact at the serotype level. To assess the significance of our serotype-specific approach, we conduct a scenario analysis applying our projection approach to the overall IPD incidence rate rather than to individual serotypes (see Supplemental File A1 for details).
Our final projection model scenario extrapolates PCV impact on IPD to inpatient pneumococcal pneumonia for all ages, thereby allowing inpatient pneumonia direct and indirect effects for all ages.
Results
We present results for our incidence rate projection model, Markov model and HALM in . These results are from our base-case analysis for PCV10 and PCV13. Cohort-specific results are presented for the 2016 and 2023 birth cohorts only. Results for the 2017–2022 birth cohorts are intermediate. And given our steady state assumption, results for cohorts born after 2023 equal those of the 2023 cohort.
Figure 4. Markov model results. Quality-adjusted life year gains for select birth cohorts. Base-case analysis.
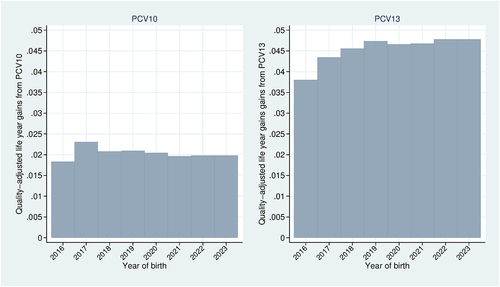
Figure 5. Health-Augmented lifecycle model results. Base-case analysis using the 2016 birth cohort. Value of a statistical disability year (black); Value of a statistical life year (dashed black); Full income (green); Full consumption (red); Annual earnings (blue).
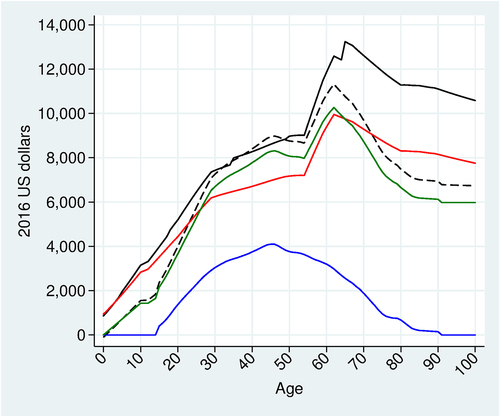
Figure 6. Markov model results. Vaccination effects on lifetime survival probability and lifetime health utility. Base-case analysis using the 2016 and 2023 birth cohorts. PCV10 effects (red); PCV13 effects (blue).
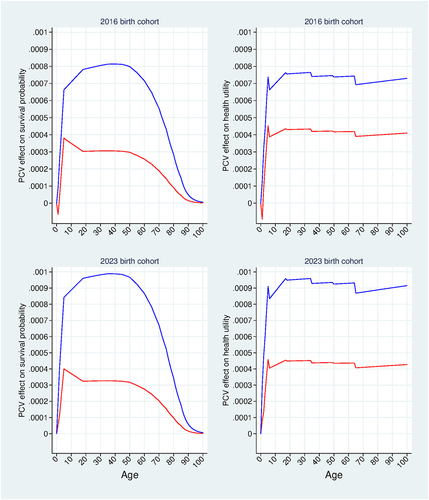
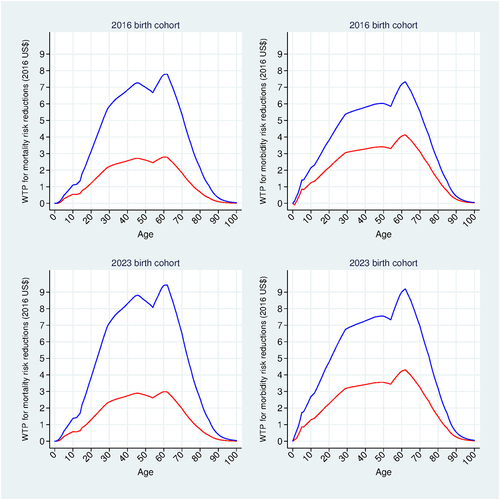
Figure 7. Willingness to pay (WTP) results. WTP for mortality risk reductions and morbidity risk reductions. Base-case analysis using the 2016 and 2023 birth cohorts. WTP for PCV10 (red); WTP for PCV13 (blue).
Incidence rate projection model results
plots our seven-year overall IPD incidence rate projections for PCV10 (red curves) and for PCV13 (blue curves), providing non-parametric estimates of vaccine effectiveness.
For PCV13, shows that incidence rates generally decline over time except for the first year for ages 5–17, the 50–64 age group, and the 65 and older age group. For ages 50–64, the upward trend reflects the facts that for this age group, NVT incidence rates rise in the UK and NVT constitutes 100% of base-year IPD in Egypt (in contrast to 29% of base-year IPD in the UK); therefore, although overall incidence declines in the UK, it rises in our Egypt projection. For ages 65 and older, the upward trend at the end of the projection period wholly reflects the observed pattern in the UK data. For ages 5–17, the projected incidence increase in the first year following a PCV13 introduction reflects the joint effect of: a substantial percentage increase in vaccine-type (VT) incidence from serotypes 1, 3, 6A, and 7F in the UK, a decrease in NVT incidence in the UK, the higher NVT prevalence in Egypt than in the UK, and the weight we apply in extrapolating percentage changes in UK NVT incidence to Egypt (equal to the ratio of UK to Egypt NVT prevalence). The weight tends to dampen the effect of the UK decrease of NVT incidence on the Egypt projection, which in turn raises the relative influence of the increase in the four VT incidence in the UK on the Egypt projection. Thus, our projected overall IPD incidence rate for Egypt rises in the first year though it slightly falls in the first year in the UK data.
For PCV10, the projections in for ages 2–4 and 65 and older directly reflect the Finnish data. For ages 5–17, 18–49 and 50–64, overall IPD incidence trends downward in Finland, but trends upward in our Egypt projections due to rising post-PCV10 NVT incidence rates in Finland combined with high Egyptian base-year NVT prevalence. This combination of factors also explains the increase in incidence projected for ages 0-<2 in the first year following a PCV10 introduction.
shows PCV13 to be more effective than PCV10 in reducing overall IPD incidence. In Figures A3-A9 of Supplemental File A1 we show that this results from the following patterns holding in many age groups: PCV13’s higher effectiveness relative to PCV10 against PCV10-covered serotypes; stronger growth in non-covered serotypes with PCV10 relative to PCV13; and PCV13’s strong effectiveness against the extra three serotypes in PCV13 coupled with Finnish evidence of lack of strong cross-protection of PCV10 against these three combined serotypes.
The vaccine effectiveness (in terms of percent reduction in overall IPD incidence relative to the base-year level) implied by our disease projection model is shown in for the 2016 and 2023 birth cohorts. This effect includes direct and indirect effects and is negative wherever incidence rate projections exceed the corresponding base-year values for the reasons provided above for . The horizontal axis in is age since vaccination, labeled according to the projection model age groups: 0-<2, 2–4, 5–17, 18–34, 35–49, 50–64, and 65 and older. Since we project incidence separately for each age group (see ), we see discontinuities in as a birth cohort ages from one age group to the next. Vaccine effectiveness is constant after age 65, so we truncate the horizontal axis at age 65.
PCV13 effectiveness (blue curves) and PCV10 effectiveness (red curves) are the same across both birth cohorts for ages six and older (primarily net indirect effects). For ages 5–17, PCV13 effectiveness peaks at 54% reduction, while PCV10 effectiveness is negative. For ages 18–49, vaccine effectiveness peaks at slightly over 50% reduction and at 10% reduction under a PCV13 and PCV10 program, respectively. For ages 50–64, vaccine effectiveness is negative under both PCV programs, although it is more negative under a PCV10 program. For ages 65 and older, PCV13 impact is slightly over 20% reduction, while PCV10 impact is negative. Vaccine effectiveness differs across the two cohorts for ages 0-<5 (primarily direct effects). For these ages, PCV13 effectiveness peaks at slightly over 50% reduction and 65% reduction for the 2016 and 2023 birth cohorts, respectively, while PCV10 effectiveness peaks at 40% reduction and slightly over 30% reduction for the 2016 and 2023 birth cohorts, respectively.
For children younger than age five, we assume that non-IPD incidence rates vary proportionately with IPD incidence, so vaccine effects on non-IPD incidence for this age group are the same as those in . In our base case, PCV has no effect on non-IPD incidence for those aged five and older.
Markov model and HALM results
QALY gains for representative members of each birth cohort born from 2016 to 2023 are shown in . QALY gains from PCV13 increase with each subsequent birth cohort from 2016 to 2019, after which they begin leveling off and reach a steady state at 0.0478. QALY gains from PCV10 are less variable across birth cohorts and relatively lower compared with those for PCV13, leveling off much earlier and reaching a steady state of approximately 0.02. The QALY gains from PCV13 for a representative member of the vaccine-ineligible cohort are 0.0025 QALYs, and those from PCV10 for a representative member of the vaccine-ineligible cohort are .000708.
shows our HALM model results. Full consumption varies according to age over the lifecycle, suggesting the empirical invalidity of equal values per QALY; VSLY (dashed black curve) rises with age until the retirement age, then falls and levels off at age 80; and VSD (solid black curve) has the same general shape as VSLY, and is slightly higher than VSLY before the age of 60, though the gap widens thereafter.
Markov model and HALM results for representative members of the 2016 and 2023 birth cohorts are in , respectively. In each figure, the results for the 2016 birth cohort are presented in the top horizontal panel, and those for the 2023 cohort are in the bottom horizontal panel.
shows PCV effects on age-specific lifetime survival probabilities (left vertical panel) and age-specific lifetime health utilities
(right vertical panel). PCV13 effects (blue curves) are relatively larger for the 2023 birth cohort compared with the 2016 birth cohort due to the relatively stronger direct effectiveness of PCV13 for the 2023 birth cohort compared with the 2016 birth cohort (see for ages 0-<5). The effect of PCV13 on survival probabilities reaches a maximum at approximately 0.0008 for the 2016 birth cohort, compared with approximately 0.001 for the 2023 birth cohort; and its effect on health utility reaches a maximum of approximately 0.00076 for the 2016 birth cohort, compared with approximately 0.00096 for the 2023 birth cohort. PCV10 effects (red curves) are relatively lower than the corresponding PCV13 effects for both birth cohorts due to PCV10’s relatively lower implied vaccine effectiveness. PCV10 effects on both survival probabilities and health utilities are very similar across the two birth cohorts. This result is consistent with the PCV10 results in , which show that PCV10 effectiveness and health gains are very similar across the two cohorts.
plots individual WTP for age-specific PCV-induced mortality risk reduction (left vertical panel) and for PCV-induced expected health utility gain
(right vertical panel). For each birth cohort, the individual WTP for PCV13 vaccination is simply the discounted sum of the areas under the two blue curves across the vertical panels, and that for PCV10 vaccination is the discounted sum of the areas under the two red curves. These WTP calculations therefore combine the age-specific HALM results in with the age- and vaccine-specific results in . It follows that the WTP for PCV13 is relatively higher than that for PCV10, reflecting PCV13’s relatively stronger effects on survival probabilities and health utilities.
Incremental cases, hospital episodes, and mortality
presents the number of cases, hospital episodes, and mortality that are averted by each vaccination policy over the 100-year time horizon, along with 95% CIs for these outcomes from our PSA. Compared with no program, a PCV10 program averts 34.0 (26.99–39.2) million cases, 255,248 (138,146–381,840) hospital episodes, and 77,594 (41,833–143,664) deaths. Compared with no program, a PCV13 program averts 70.04 (57.21–80.09) million cases, 742,212 (367,567–1,217,722) hospital episodes, and 249,057 (112,684–529,136) deaths. Compared with a PCV10 program, a PCV13 program averts 36.03 (30.22–40.86) million cases, 486,964 (229,422–835,882) hospital episodes, and 171,464 (70,850–385,472) deaths.
Table 3. Base-case incremental cases, hospital episodes, and mortality over a 100-year time horizon.
Value-for-money results
presents our base-case results per vaccinated infant for the CUA and CBA analyses, along with 95% CIs for the ICERs and RoRs generated from our PSA. In the first and second horizontal panels, we compare PCV13 and PCV10 programs, respectively, to no program. In the third panel, we compare PCV13 to PCV10. We report the corresponding program-wide results in Table A26 in Supplemental File A3.
Table 4. Base-case results (95% confidence interval).
Cost-utility analysis results
Compared with no program, PCV10 produces 0.0192 incremental QALYs at an incremental cost of $38.43–$0.38=$38.05 for an ICER of $1,984.41 ($1,186-$3,805), which is less than Egypt’s per capita GDP of $3,479 (2016 USD).Citation80 (Our reported quotients are not exactly equal to the quotients of our reported values due to rounding.) Compared with no program, PCV13 produces 0.0462 incremental QALYs at an incremental cost of $43.63-$0.88=$42.75 for an ICER of $925.60 ($512-$1,735), which falls below one-half per capita GDP. Compared with a PCV10 program, a PCV13 program produces 0.027 incremental QALYs at an incremental cost of $5.198-$0.498=$4.7 for an ICER of $173.98 ($86-$331), which is significantly below one-half per capita GDP. Our base-case CUA results therefore indicate that at traditional thresholds, PCV10 represents good VfM relative to no program (i.e., ICER falls below per capita GDP), and PCV13 represents very good VfM relative to no program and relative to PCV10 (i.e., ICERs fall below one-half per capita GDP).
Cost-benefit analysis results
In the base-case analysis, RoRs to PCV13 and PCV10 relative to no program are 488% (188–993%) and 164% (33–336%), respectively, while choosing PCV13 over PCV10 has a considerable RoR of 3,109% (1410–6602%). Though QALY gains are not directly relevant to CBA, we compute ratios of WTP to QALY gains in , which can serve as a measure of the average monetary value of health implied by our HALM. Our ratios fall between 1- and 3-times per capita GDP, which the WHO Commission on Macroeconomics and HealthCitation81 offers as benchmark values for QALYs suggesting that our HALM provides health valuations of roughly similar size to those benchmark values. Since our HALM is more firmly justified by economic theory and evidence, such similarity yields some justification for those benchmarks.
One-way deterministic sensitivity, scenario, and disaggregated analysis results
We report the results of our one-way deterministic sensitivity and scenario analyses in , respectively.
Table 5. One-way deterministic sensitivity analysis.
Table 6. Scenario analysis.
In one-way sensitivity analyses, we find that VfM estimates are very sensitive to whether incidence rate projections are based on serotype-specific or overall IPD incidence, validating our serotype-specific approach. Projecting vaccine impacts using overall IPD incidence rates rather than serotype-specific incidence rates nearly quadruples the RoR to a PCV10 versus no program from 164% to 649%, while increasing that for a PCV13 program from 488% to 779% and dropping the RoR to a PCV13 versus a PCV10 program from 3109% to 1769%.
We find that our VfM estimates are very sensitive to the choice of base-year incidence rates, the discount rate, assumptions on PCV direct and indirect effects on inpatient pneumonia, and the length of the modeling horizon. Replacing the Wahl et al. (2018)Citation3 base case base-year incidence rates with the UC values decreases the RoR to a PCV10 versus no program from 164% to 60%, decreases the RoR to a PCV13 versus no program from 488% to 253%, and decreases the RoR to a PCV13 versus PCV10 program from 3109% to 1768%. Replacing base-case base-year incidence rates with the FC values increases the RoR to a PCV10 versus no program from 164% to 267%, increases the RoR to a PCV13 versus no program from 488% to 811%, and increases the RoR to a PCV13 versus PCV10 program from 3109% to 5456%. Allowing inpatient pneumonia direct and indirect effects for all ages increases the RoR to a PCV10 versus no program from 164% to 249%, increases the RoR to a PCV13 versus no program from 488% to 1191%, and increases the RoR to a PCV13 versus PCV10 program from 3109% to 9883%. Reducing the modeling horizon from 100 years to 60 years decreases the RoR from 164% to 68% for PCV10 versus no program, from 488% to 273% for PCV13 versus no program, and from 3109% to 1935% for PCV13 versus no program.
We find that VfM estimates are moderately sensitive to changes in the vaccine effectiveness implied by our base-case incidence rate projections. We find that VfM estimates are relatively insensitive to capping overall IPD incidence rate projections at the base-year levels (or equivalently, imposing a floor of 0% on implied vaccine effectiveness). When such a cap is imposed, the RoR to a PCV10 versus no program increases from 164% to 201%, the RoR to a PCV13 versus no program increases from 488% to 489%, and the RoR to a PCV13 versus PCV10 program decreases from 3109% to 2803%. We also find that VfM estimates are relatively insensitive to adjustments to CFRs, health utilities, probability of hearing loss after AOM, probability of long-term sequelae after pneumonia, and VSL. VfM estimates based on the UC and FC direct medical costs values are nearly identical to the base-case values because, as shown in , expected averted direct medical costs are a small fraction of the net costs that enter into the RoR and ICER calculations.
We disaggregate benefits by disease manifestation and age group (i.e., ages 0–4, 5–17, 18–65, 65–79, and 80+). We perform these analyses only for the 2016 birth cohort, both for simplicity and because only this cohort has the full maximum lifespan of 100 years within the modeling period. We provide these results in Table A27 in Supplemental File A3. We find that the value of preventing inpatient pneumonia is considerably higher than that of preventing any other manifestation, which is due to its combination of relatively high incidence and mortality risk. We find that vaccine benefits are concentrated during the working age years, which is caused by three factors. First, the working age years cover a larger proportion of the total lifespan than either youth or the elderly years. Second, improved survival during infancy has ripple effects throughout the lifetime, in particular raising survival probabilities throughout the working age years. Third, as shown in , VSLY and VSD values are highest during the working-age years.
Discussion
Implications of RoRs for decision-makers
RoRs from this study can inform vaccine decisions in Egypt. The HALM allows individuals to either consume or save at the market rate of interest, which implies that the resulting WTP for vaccination internalizes the individual’s opportunity cost in terms of foregone consumption or savings. The high RoRs to PCV10 and PCV13 relative to no vaccination, including at the lower bounds of their 95% CIs, and regardless of the presence or absence of inpatient pneumonia indirect protection for all ages, imply that vaccine benefits greatly exceed the opportunity cost to households of the income paid through taxes and premiums to finance the vaccines. Therefore, our results provide strong economic justification for financing a PCV10 or PCV13 program through taxes or statutory premiums.
It has been estimated that the RoR to public spending on female schooling in low-to-middle income countries, reflecting its impact not just on increased earnings but also on reduced child- and adult-mortality risk, is 280%.Citation82 This RoR comes from a study with a shorter time horizon than ours: earnings and mortality risks are measured only until age 65 and 60, respectively, and so understates the RoR that would come from the same 100-year time horizon as ours. Subject to that caveat, in the base case, the PCV13 versus no vaccination RoR of 488% surpasses this threshold, though the lower bound value of its 95% CI (188%) does not. The PCV13 versus PCV10 RoR greatly surpasses this threshold in the base case (3109%) and at the lower bound value of its 95% CI (1410%). In the scenario with a 60-year time horizon, the RoR to PCV13 versus no vaccination of 273% is slightly under this threshold, but the RoR to PCV13 versus PCV10 of 1935% is well over this threshold.
Thus, across the base case and scenario analyses, PCV13’s RoRs (relative to both no vaccination and PCV10) are generally attractive relative to that of non-health public expenditure and support the MoF expanding the payer’s budget to accommodate PCV13. (The exceptions to this involve PCV13 versus no vaccination, where the RoRs are relatively unattractive at the UC value for incidence rates, a 5% discount rate, and a 60-year modeling horizon.) In comparison, the RoR of PCV10 relative to no vaccination fails to meet this threshold in the base-case and most scenario and sensitivity analyses, the exceptions being the upper bound of the 95% CI, and the scenarios using a 0% discount rate and Finland’s overall IPD incidence to estimate vaccine effectiveness.
We can also derive implications of our RoRs for MoH decisions. It has been estimated that health payers worldwide can produce about one QALY at a cost of about 0.50 of per capita GDP out of their budgets.Citation83,Citation84 If we value such QALY output at our estimated WTP per QALY, then the threshold RoR that payers seem to be able to realize from spending out of their existing budgets is given by:
Based on the PCV13 WTP per QALY of $5,439 estimated in our base-case CBA and Egypt’s per capita GDP of $3,479 (2016 USD), this threshold RoR equals 212.7%.
The RoRs to PCV13 relative to no vaccination and to PCV10 exceed this threshold in our base case and all sensitivity and scenario analyses, suggesting strong justification for reimbursement out of the fixed payer budget. The RoR to PCV10 over no program provides no such justification in the base case and most scenario and sensitivity analyses.
We find PCV13 to be good VfM relative to PCV10 for the legislature, finance ministry, and payer. This holds in base-case, scenario, and sensitivity analysis. We also find PCV13 to be good VfM relative to no vaccination program for the three decision-makers in the base case and nearly all scenario and sensitivity analysis. Our findings differ from those of a previous Egyptian CUA, Sibak et al. (2015),Citation19 which found PCV13 ICERs exceeding per capita GDP and therefore not good VfM. One reason why the Sibak et al. (2015)Citation19 ICERs are higher than ours is that they excluded herd protection against IPD for older unvaccinated age groups.
Strengths and limitations
Most of the published economic evaluations of pediatric PCV programs in MICs come from Asia and Latin America, use CUA, adopt either the health payer or government perspective, and generally address only the payer’s decision.Citation20 Those studies from the societal perspective tend to ignore the productivity costs of infection and assume a constant individual WTP per QALY. Although our evaluation conducts a traditional CUA from the payer perspective, its primary contribution to the literature is its use of a HALM within a societal perspective CBA. The strength and novelty of this approach is that it quantifies individuals’ WTP for vaccines in a manner that reflects health’s interactions with consumption, paid work, unpaid work, and leisure over the lifecycle. Unlike our CUA, our CBA and HALM-based approach generates VfM measures that not only inform payers’ reimbursement decisions, but also inform MoF and legislative decisions, which are of special relevance in Gavi-ineligible MICs such as Egypt. The generality of our HALM allows it to be applied not only within the health sector, but also across all public sectors. Therefore, our study also contributes to the development of CBA for public-sector-wide VfM assessments more broadly.
Our evaluation has several limitations. First, since Egypt is a PCV-naïve country, evidence of the population impacts of PCV programs must come from international sources. Additional data scarcities not specific to PCVs require us to also rely on other countries for data on time use, consumption, annual earnings, long-term sequelae probabilities, and utility weights. We also rely for our incidence rates and case fatality rates on Egypt-specific model-generated estimates from the literature, and on PAHO prices rather than Egypt-specific negotiated vaccine prices. Second, parameter uncertainties are exacerbated by the long modeling horizon over which we project those parameters, though we quantify the impact of such uncertainty on model outcomes with our multivariate probabilistic sensitivity analysis. Third, there is uncertainty regarding the likelihood of non-IPD indirect effects for unvaccinated cohorts, though we address this in scenario analysis. Lastly, results are sensitive to the use of serotype-specific rather than overall IPD incidence in the estimation of vaccine effectiveness, though this validates our use of serotype-specific incidence.
Conclusion
Our study improves upon current approaches to economic evaluation of vaccines in general and PCVs in Egypt specifically. We improve upon such approaches by adopting a fuller societal perspective and using HALMs that more comprehensively and flexibly reflect health’s interactions with production, consumption, and leisure over individuals’ lifetimes. Considering individuals’ WTP for vaccination over a lifetime and the resulting RoR is a valuable tool for making informed decisions regarding the allocation of resources. Our analysis will therefore help inform Egyptian decision-makers regarding the broader socio-economic value of a universal pediatric PCV program. Given the high RoR to PCV13 found in our study, particularly in the presence of inpatient pneumonia herd effects for all ages, we conclude that a universal pediatric PCV13 program represents good VfM for policymakers in Egypt.
Supplemental Material
Download MS Word (7.3 MB)Acknowledgment
We are grateful to Anubhav Agarwal for outstanding research assistance.
Disclosure statement
This study was led by Data for Decisions LLC (DfD) with funding from Pfizer Inc. JP Sevilla and Daria Burnes are employees of DfD and in that capacity have worked on this and other studies funded by grants from Pfizer and GSK to DfD. David Bloom is an external consultant to DfD and in that capacity has worked on this and other studies funded by grants from Pfizer and GSK to DfD. JP Sevilla and David Bloom in their personal capacities have received compensation from Pfizer and GSK for providing consulting services and for speaking and participating in meetings and advisory boards. Johnna Perdrizet, Sarah Pugh and Matt Wasserman are employees of Pfizer Inc. Rehab Zakaria El Saie is an employee of Pfizer Egypt. Hammam Haridy is an employee of Pfizer Gulf. Johnna Perdrizet, Sarah Pugh, Matt Wasserman, Rehab Zakaria El Saie, and Hammam Haridy held Pfizer stock or stock options at the time of the study. Pfizer Inc. employs Johnna Perdrizet, Sarah Pugh, Matt Wasserman, Rehab Zakaria El Saie, and Hammam Haridy, but otherwise played no role in study design, data collection and analysis, decision to publish, or preparation of the article.
Supplementary material
Supplemental data for this article can be accessed on the publisher’s website at https://doi.org/10.1080/21645515.2022.2114252.
Additional information
Funding
References
- Troeger C, Blacker B, Khalil IA, Rao PC, Cao J, Zimsen SRM, Albertson SB, Deshpande A, Farag T, Abebe Z; Global Burden of Disease 2016 Lower Respiratory Infections Collaborators. Estimates of the global, regional, and national morbidity, mortality, and aetiologies of lower respiratory infections in 195 countries, 1990–2016: A systematic analysis for the Global Burden of Disease Study 2016. Lancet Infect Dis. 2018;18(11):1–22. doi:10.1016/S1473-3099(18)30310-4.
- World Health Organization. Department of Immunization, Vaccines and Biologicals. Pneumococcal disease. Geneva (CH); 2014 Sep 29 [accessed 2020 Feb 18]. https://www.who.int/immunization/diseases/pneumococcal/en/.
- Wahl B, O’Brien KL, Greenbaum A, Majumder A, Liu L, Chu Y, Lukšić I, Nair H, McAllister DA, Campbell H, et al. Burden of Streptococcus pneumoniae and Haemophilus influenzae type b disease in children in the era of conjugate vaccines: global, regional, and national estimates for 2000–15. The Lancet Global Health. 2018;6(7):e744–57. doi:10.1016/S2214-109X(18)30247-X.
- World Health Organization. Children: reducing mortality. Geneva (CH); 2019 Sep 19 [accessed 2020 Feb 18]. https://www.who.int/news-room/fact-sheets/detail/children-reducing-mortality.
- World Health Organization. Global Action Plan. Monitoring evaluation & accountability. Secretariat annual report 2015. Geneva (CH): WHO Press; 2015.
- World Health Organization. Weekly epidemiological record. 2012;87:129–144. http://www.who.int/wer
- United States Department of Health and Human Services. Centers for disease control and prevention. Pneumococcal vaccination: what everyone should know. Atlanta (GA); 2019 Nov 21 [accessed 2020 Jun 28]. https://www.cdc.gov/vaccines/vpd/pneumo/public/index.html#:~:text=The%20Food%20and%20Drug%20Administration%20(FDA)%20licensed%20the%20first%20pneumococcal,(serotypes)%20of%20pneumococcal%20bacteria .
- Johnson HL, Deloria-Knoll M, Levine OS, Stoszek SK, Hance LF, Reithinger R, Muenz LR, O’Brien KL, Cohen J. Systematic evaluation of serotypes causing invasive pneumococcal disease among children under five: the pneumococcal global serotype project. PLoS Med. 2010;7(10):e1000348. doi:10.1371/journal.pmed.1000348.
- Moore MR, Link-Gelles R, Schaffner W, Lynfield R, Lexau C, Bennett NM, Petit S, Zansky SM, Harrison LH, Reingold A, et al. Effect of use of 13-valent pneumococcal conjugate vaccine in children on invasive pneumococcal disease in children and adults in the USA: analysis of multisite, population-based surveillance. Lancet Infect Dis. 2015;15(3):301–309. doi:10.1016/S1473-3099(14)71081-3.
- Shiri T, Datta S, Madan J, Tsertsvadze A, Royle P, Keeling MJ, McCarthy ND, Petrou S. Indirect effects of childhood pneumococcal conjugate vaccination on invasive pneumococcal disease: a systematic review and meta-analysis. Lancet Glob Health. 2017;5(1):e51–e59. doi:10.1016/S2214-109X(16)30306-0.
- Griffin MR, Zhu Y, Moore MR, Whitney CG, Grijalva CG. US. hospitalizations for pneumonia after a decade of pneumococcal vaccination. New Engl J Med. 2013;369(2):155–163. doi:10.1056/NEJMoa1209165.
- Miller E, Andrews NJ, Waight PA, Slack MP, George RC. Herd immunity and serotype replacement 4 years after seven-valent pneumococcal conjugate vaccination in England and Wales: an observational cohort study. Lancet Infect Dis. 2011;11(10):760–768. doi:10.1016/S1473-3099(11)70090-1.
- Pilishvili T, Lexau C, Farley MM, Hadler J, Harrison LH, Bennett NM, Reingold A, Thomas A, Schaffner W, Craig AS, et al. Sustained reductions in invasive pneumococcal disease in the era of conjugate vaccine. J Infect Dis. 2010;201(1):32–41. doi:10.1086/648593.
- Johns Hopkins Bloomberg School of Public Health, International Vaccine Access Center. Global Vaccine Introduction. Baltimore (MD): View-hub; 2019 Mar [assessed 2019 Sep 16]. http://www.jhsph.edu/research/centers-and-institutes/ivac/view-hub.
- United States Department of Health and Human Services. Centers for disease control and prevention. Global introduction of new vaccines: delivering more to more. Atlanta (GA); 2018 Mar 20 [accessed 2020 Feb 11]. https://www.cdc.gov/grand-rounds/pp/2018/20180320-new-vaccines.html .
- Tricarico S, McNeil HC, Cleary DW, Head MG, Lim V, Yap IKS, Wie CC, Tan CS, Norazmi MN, Aziah I, et al. Pneumococcal conjugate vaccine implementation in middle-income countries. Pneumonia. 2017;9(1):6. doi:10.1186/s41479-017-0030-5.
- United States Department of Health and Human Services. Centers for disease control and prevention. Global pneumococcal disease and prevention. Atlanta (GA); 2018 Nov 15 [accessed 2020 Jun 28]. https://www.cdc.gov/pneumococcal/global.html .
- Bloom DE, Fan VY, Sevilla JP. The broad socioeconomic benefits of vaccination. Sci Transl Med. 2018;10(441):eaaj2345. doi:10.1126/scitranslmed.aaj2345.
- Sibak M, Moussa I, El-Tantawy N, Badr S, Chaudhri I, Allam E, Munier A, Abo Freikha S, Hoestlandt C, Lara C. Cost-Effectiveness analysis of the introduction of the pneumococcal conjugate vaccine (PCV-13) in the Egyptian national immunization program, 2013. Vaccine. 2015;33(Suppl 1):A182–A191. doi:10.1016/J.VACCINE.2014.12.044.
- Saokaew S, Rayanakorn A, Wu DB, Chaiyakunapruk N. Cost effectiveness of pneumococcal vaccination in children in low- and middle-income countries: a systematic review. PharmacoEconomics. 2016;34(12):1211–1225. doi:10.1007/s40273-016-0439-3.
- Kulpeng W, Leelahavarong P, Rattanavipapong W, Sornsrivichai V, Baggett HC, Meeyai A, Punpanich W, Teerawattananon Y. Cost-Utility analysis of 10- and 13-valent pneumococcal conjugate vaccines: protection at what price in the Thai context? Vaccine. 2013;31(26):2839–2847. doi:10.1016/j.vaccine.2013.03.047.
- Wilson M, Wasserman M, Jadavi T, Postma M, Breton M, Peloquin F, Earnshaw S, McDade C, Sings H, Farkough R. Clinical and economic impact of a potential switch from 13-valent to 10-valent pneumococcal conjugate infant vaccination in Canada. Infect Dis Ther. 2018;7(3):353–371. doi:10.1007/s40121-018-0206-1.
- Suthipinijtham P, Hemachandra A, Patil S, et al. Modeling the potential impact of pneumococcal conjugate vaccination in Thailand. International Society for Pharamacoeconomic and Outcomes Research Asia Pacific 2018; 2018 September 8–11; Tokyo, Japan.
- Wasserman M, Palacios MG, Grajales AG, Baez/revueltas FB, Wilson M, McDade C, Farkouh R. Modeling the sustained use of the 13-valent pneumococcal conjugate vaccine compared to switching to the 10-valent vaccine in Mexico. Hum Vaccin Immunother. 2019;15(3):560–569. doi:10.1080/21645515.2018.1516491.
- Ansaldi F, Pugh S, Amicizia D, Di Virgilio R, Trucchi C, Orsi A, Zollo A, Icardi G. Estimating the clinical and economic impact of switching from the 13-Valent Pneumococcal Conjugate Vaccine (PCV13) to the 10-Valent Pneumococcal Conjugate Vaccine (PCV10) in Italy. Pathogens. 2020;9(2):[16 p]. doi:10.3390/pathogens9020076.
- Perdrizet J, Santana CFS, Senna T, et al. Cost-Effectiveness analysis of replacing the 10-valent pneumococcal conjugate vaccine (PCV10) with the 13-valent pneumococcal conjugate vaccine (PCV13) in Brazil infants. Hum Vaccin Immunother. 2020 [[accessed 2021 Mar 30]]:[12 p]. doi:10.1080/21645515.2020.1809266.
- Pugh S, Wasserman M, Moffatt M, Marques S, Reyes JM, Prieto VA, Reijnders D, Rozenbaum MH, Laine J, Åhman H, et al. Estimating the impact of switching from a lower to higher valent pneumococcal conjugate vaccine in Colombia, Finland, and The Netherlands: a cost-effectiveness analysis. Infect Dis Ther. 2020;9(2):305–324. doi:10.1007/s40121-020-00287-5.
- Shafie AA, Ahmad N, Naidoo J, Foo CY, Wong C, Pugh S, Tan KK. Estimating the population health and economic impacts of introducing a pneumococcal conjugate vaccine in Malaysia- an economic evaluation. Human Vaccines & Immunotherapeutics. 2020;16(7):1719–1727. doi:10.1080/21645515.2019.1701911.
- Murphy KM, Topel RH. The value of health and longevity. J Polit Econ. 2006;114(5):871–904. doi:10.3386/w11405.
- Drummond M, Barbieri M, Cook J, Glick HA, Lis J, Malik F, Reed SD, Rutten F, Sculpher M, Severens J. Transferability of economic evaluations across jurisdictions: ISPOR good research practices task force report. Value in Health. 2009;12(4):409–418. doi:10.1111/j.1524-4733.2008.00489.x.
- Global Burden of Disease Study 2015. Global Burden of Disease study 2015 (GBD 2015) Socio-Demographic Index (SDI) 1980–2015. Seattle, United States: Institute for Health Metrics and Evaluation (IHME); 2016.
- World Bank, International Comparison Program database. Series name: “GDP per capita, PPP (current international $)”; [accessed 2018 Oct 27]. https://databank.worldbank.org/reports.aspx?source=world-development-indicators .
- Dilokthornsakul P, Kengkla K, Saokaew S, Permsuwan U, Techasaensiri C, Chotpitayasunondh T, Chaiyakunapruk N. An updated cost-effectiveness analysis of pneumococcal conjugate vaccine among children in Thailand. Vaccine. 2019;37(32):4551–4560. doi:10.1016/j.vaccine.2019.06.015.
- Aljunid S, Abuduxike G, Ahmed Z, Sulong S, Nur AM, Goh A. Impact of routine PCV7 (Prevenar) vaccination of infants on the clinical and economic burden of pneumococcal disease in Malaysia. BMC Infect Dis. 2011;11:248. doi:10.1186/1471-2334-11-248.
- Chen C, Liceras FC, Flasche S, Sidharta S, Yoong J, Sundaram N, Jit M. Effect and cost-effectiveness of pneumococcal conjugate vaccination: a global modelling analysis. Lancet Global Health. 2019;7(1):e58–67. doi:10.1016/S2214-109X(18)30422-4.
- Chuck AW, Jacobs P, Tyrrell G, Kellner JD. Pharmacoeconomic evaluation of 10- and 13-valent pneumococcal conjugate vaccines. Vaccine. 2010;28(33):5485–5490. doi:10.1016/j.vaccine.2010.05.058.
- Aljunid S, Maimaiti N, Ahmed Z, Nur AM, Isa ZM, Azmi S, Sulong S. Economic impact of Pneumococcal Protein-D Conjugate Vaccine (PHiD-CV) on the Malaysian national immunization programme. Value in Health Regional Issues. 2014;3:146–155. doi:10.1016/j.vhri.2014.04.008.
- Netsawang S, Punpanich W, Treeratweeraphong V, Chotpitayasunondh T. Invasive pneumococcal infection in urban Thai children: A 10-year review. J Med Assoc Thai. 2010;93(Suppl. 5):S6–12. PubMed: 21298830
- Working group of Burden of Disease Project. Nonthaburi: international health policy program. Ministry of public health; Thailand: 2007. Burden of disease and injuries in Thailand; 2004. https://espace.library.uq.edu.au/view/UQ:155542 .
- Edmond K, Scott S, Korczak V, Ward C, Sanderson C, Theodoratou E, Clark A, Griffiths U, Rudan I, Campbell H Long term sequelae from childhood pneumonia; systematic review and meta-analysis. PLoS ONE. 2012;7(2):e31239. doi:10.1371/journal.pone.0031239.t001.
- Global Burden of Disease. Institute for Health Metrics and Evaluations (IHME); 2016 [accessed 2018 Oct 24]. http://ghdx.healthdata.org/gbd-results-tool .
- Ngo CC, Massa HM, Thornton RB, Cripps AW, Reid S. Predominant bacteria detected from the middle ear fluid of children experiencing otitis media: a systematic review. PLoS ONE. 2016;11(3):e0150949. doi:10.1371/journal.pone.0150949.
- Wu DB, Roberts C, Lee VWY, Hong L, Tan KK, Mak V, Lee KKC. Cost-Effectiveness analysis of infant universal routine pneumococcal vaccination in Malaysia and Hong Kong. Human Vaccines & Immunotherapeutics. 2016;12(2):403–416. doi:10.1080/21645515.2015.1067351.
- Farkouh RA, Klok RM, Postma MJ, Roberts CS, Strutton DR. Cost–effectiveness models of pneumococcal conjugate vaccines: variability and impact of modeling assumptions. Expert Rev Vaccines. 2014;11(10):1235–1247. doi:10.1586/erv.12.99.
- Wasserman M, Sings HL, Jones D, Pugh S, Moffatt M, Farkouh R. Review of vaccine effectiveness assumptions used in economic evaluations of infant pneumococcal conjugate vaccine. Expert Rev Vaccines. 2018;17(1):71–78. doi:10.1080/14760584.2018.1409116.
- Castiglia P, Pradelli L, Castagna S, Freguglia V, Palù G, Susanna Esposito S. Overall effectiveness of pneumococcal conjugate vaccines: an economic analysis of PHiD-CV and PCV-13 in the immunization of infants in Italy. Human Vaccines & Immunotherapeutics. 2017;13(10):2307–2315. doi:10.1080/21645515.2017.1343773.
- Balsells E, Guillot L, Nair H, Kyaw MH, Borrow R. Serotype distribution of Streptococcus pneumoniae causing invasive disease in children in the post-PCV era: a systematic review and meta-analysis. PLoS ONE. 2017;12(5):e0177113. doi:10.1371/journal.pone.0177113.
- Andrews NJ, Waight PA, Burbidge P, Pearce E, Roalfe L, Zancolli M, Slack M, Ladhani SN, Miller E, Goldblatt D. Serotype-Specific effectiveness and correlates of protection for the 13-valent pneumococcal conjugate vaccine: a postlicensure indirect cohort study. The Lancet. 2014;14(9):839–846. doi:10.1016/S1473-3099(14)70822-9.
- Haasis MA, Ceria JA, Kulpeng W, Teerawattananon Y, Alejandria M, Beall B. Do pneumococcal conjugate vaccines represent good value for money in a lower-middle income country? A cost-utility analysis in the philippines. PLoS ONE. 2015;10(7):e0131156. doi:10.1371/journal.pone.0131156.
- Ladhani SN, Collins S, Djennad A, Sheppard CL, Borrow R, Fry NK, Andrews NJ, Miller E, Ramsay ME. Rapid increase in non-vaccine serotypes causing invasive pneumococcal disease in England and Wales, 2000–17: a prospective national observational cohort study. The Lancet. 2018;18(4):441–451. doi:10.1016/S1473-3099(18)30052-5.
- National Infectious Disease Register, National Institute for Health and Welfare, THL. Appendix table 1. Data from: “Kopio Liitetaulukot_serotyypit_122019.Xlsx” [dataset]; 2019 [accessed 2021 Jun 23]. https://thl.fi/en/web/thlfi-en/research-and-development/research-and-projects/monitoring-the-population-effectiveness-of-pneumococcal-conjugate-vaccination-in-the-finnish-national-vaccination-programme/incidence-of-invasive-pneumococcal-disease-in-finland .
- Wasfy MO, Pimentel G, Abdel-Maksoud M, Russell KL, Barrozo CP, Klena JD, Earhart K, Hajjeh R. Antimicrobial susceptibility and serotype distribution of Streptococcus pneumoniae causing meningitis in Egypt, 1998–2003. J Antimicrob Chemother. 2005;55(6):958–964. doi:10.1093/jac/dki101.
- Weil-Olivier C, van der Linden M, de Schutter I, Dagan R, Mantovani L. Prevention of pneumococcal diseases in the post-seven valent vaccine era: a European perspective. BMC Infect Dis. 2012;12(1):207. http://www.biomedcentral.com/1471-2334/12/207 .
- World Health Organization and UNICEF. Estimates of immunization coverage: 2019 revision. Data from: WUENIC_input_to_PDF.Xls. [dataset]. WHO immunization, vaccines and biologicals; 2019 [accessed 2020 Sep 1]. https://www.who.int/immunization/monitoring_surveillance/routine/coverage/en/index4.htm .
- Melegaro A, Edmunds WJ. Cost-Effectiveness analysis of pneumococcal conjugate vaccination in England and Walesa. Vaccine. 2004;22(31–32):4203–4214. doi:10.1016/j.vaccine.2004.05.003.
- van Hoek A, Miller E, Beall B. Cost-effectiveness of vaccinating immunocompetent ≥65 year olds with the 13-valent pneumococcal conjugate vaccine in England. PLoS ONE. 2016;11(2):e0149540. doi:10.1371/journal.pone.0149540.
- Thorrington D, van Rossum L, Knol M, de Melker H, Rumke H, Hak E, van Hoek AJ, Arez AP. Impact and cost-effectiveness of different vaccination strategies to reduce the burden of pneumococcal disease among elderly in the Netherlands. PLoS ONE. 2018;13(2):e0192640. doi:10.1371/journal.pone.0192640.
- Simonsen L, Taylor RJ, Schuck-Paim C, Lustig R, Haber M, Klugman KP. Effect of 13-valent pneumococcal conjugate vaccine on admissions to hospital 2 years after its introduction in the USA: a time series analysis. Lancet Respir Med. 2014;2(5):387–394. doi:10.1016/S2213-2600(14)70032-3.
- Rodrigo C, Bewick T, Sheppard C, Greenwood S, Mckeever TM, Trotter CL, Slack M, George R, Shen Lim W. Impact of infant 13-valent pneumococcal conjugate vaccine on serotypes in adult pneumonia. Eur Respir J. 2015;45(6):1632–1641. doi:10.1183/09031936.00183614.
- O’Brien K, Cohen O, Knoll M, Ramakrishnan M, Farrar J, Pilishvili T, Whitney C, Goldblatt D, Moisi J, de Cola M, et al. Pneumococcal Conjugate Vaccine (PCV) review of impact evidence (PRIME). Summary of findings from systematic review. Johns Hopkins Bloomberg School of Public Health; 2017. https://www.who.int/immunization/sage/meetings/2017/october/3_FULL_PRIME_REPORT_2017Sep26.pdf .
- Patrzałek M, Kotowska M, Goryński P, Albrecht P. Indirect effects of a 7 year PCV7/PCV13 mass vaccination program in children on the incidence of pneumonia among adults: a comparative study based on two polish cities. Curr Med Res Opin. 2016;32(3):397–403. doi:10.1185/03007995.2015.1119676.
- Bigogo GM, Audi A, Auko J, Aol GO, Ochieng BJ, Odiembo H, Odoyo A, Widdowson MA, Onyango C, Borgdorff MW, et al. Indirect effects of 10-valent pneumococcal conjugate vaccine against adult pneumococcal pneumonia in rural Western Kenya. Clin Infect Dis. 2019;69(12):2177–2184. doi:10.1093/cid/ciz139.
- Madhi SA, Nunes MC. The potential impact of pneumococcal conjugate vaccine in Africa: considerations and early lessons learned from the South African experience. Human Vaccines & Immunotherapeutics. 2016;12(2):314–325. doi:10.1080/21645515.2015.1084450.
- Warren JL, Shioda K, Kürüm E, Schuck-Paim C, Lustig R, Taylor RJ, Simonsen L, Weinberger DM. Impact of pneumococcal conjugate vaccines on pneumonia hospitalizations in high- and low-income subpopulations in Brazil. Clinical Infectious Diseases. 2017;65(11):1813–1818. doi:10.1093/cid/cix638.
- Andrade AL, Afonso ET, Minamisava R, Bierrenbach AL, Cristo EB, Morais Neto OL, Policena GM, Cmas D, Toscano CM. Direct and indirect impact of 10-valent pneumococcal conjugate vaccine introduction on pneumonia hospitalizations and economic burden in all age-groups in Brazil: a timeseries analysis. PLoS ONE. 2017;12(9):e0184204. doi:10.1371/journal.pone.0184204.
- Becker GS, Philipson TJ, Soares RR. The quantity and quality of life and the evolution of world inequality. Am Econ Rev. 2005;95(1):277–291. doi:10.3386/w9765.
- National Transfer Accounts; [accessed 2018 Nov 30]. https://ntaccounts.org/web/nta/show/Browse%20database .
- National Transfer Accounts; [accessed 2017 Apr 16]. http://www.ntaccounts.org/doc/repository/NTA%20profiles.xlsx .
- International Labour Organization. Data from: ilostat-export.xlsx [dataset]. EGY - EC - Employment, wages and hours of work survey. Mean nominal monthly earnings of employees by sex and economic activity – Harmonized series; 2016 [accessed 2020 May 22]. http://www.ilo.org/ilostat/faces/oracle/webcenter/portalapp/pagehierarchy/Page27.jspx? .
- International Labour Organization. Data from: iostat-export.xlsx [dataset]. Mean weekly hours actually worked per employed person by sex and economic activity null; 2016 [accessed 2018 Sep 27].
- Turkish Statistical Institute (Turkstat). Data from: average activity time per person by type of activity, sex and age group, 2014-2015 [dataset]. Database: Time Use Survey; 2016 [accessed 2016 Nov 2]. http://www.turkstat.gov.tr/PreTablo.do?alt_id=1009.
- Office of National Statistics Algeria. Enquête Nationale Emploi du Temps ENET 2012. Algiers (DZ); 2013 [accessed 2017 Mar 3]. http://www.ons.dz/
- Allen RC. Absolute poverty: when necessity displaces desire. Am Econ Rev. 2017;107(12):3690–3721. doi:10.1257/aer.20161080.
- Robinson LA, Hammitt JK, O’Keeffe L. Valuing mortality risk reductions in global benefit-cost analysis. Journal of Benefit Cost Analysis. 2019;10(S1):15–50. doi:10.1017/bca.2018.26.
- Pan American Health Organization. Immunization: revolving fund: vaccines. Revolving fund vaccine prices. https://www.paho.org/hq/index.php?option=com_topics&view=rdmore&cid=9979&item=revolving-fund&cat=communication&type=vaccines-9979&Itemid=42192&lang=en.
- United Nations, Department of Economic and Social Affairs, Population Division (2015). Data from: WPP2015_SA4_POP_F07_1_POPULATION_BY_AGE_BOTH_SEXES.xlsx [dataset]. World population prospects: the 2015 revision - special aggregates, DVD edition;2015 Dec; [accessed 2016 Oct 26].
- United Nations, Department of Economic and Social Affairs, Population Division (2017). Data from: INT/3-1: total population (both sexes combined) by single age, region, subregion and country, annually for 1950-2100 (thousands) [dataset]. World population prospects: the 2017 revision, DVD edition; 2017 Jun [accessed 2019 Feb 22].
- World Health Organization. Guide for standardization of economic evaluations of immunization programmes. Geneva (CH); The Department of Immunization, Vaccines and Biologicals; 2008 [accessed 2018 Dec 9]. https://apps.who.int/iris/bitstream/handle/10665/69981/WHO_IVB_08.14_eng.pdf.
- International Society for Pharamacoeconomic and Outcomes Research (ISPOR). Pharamacoeconomic guidelines around the world; 2010 Jan 21 [accessed 2020 Jan 23]. https://tools.ispor.org/peguidelines/ .
- World Bank national accounts data, and OECD National Accounts data files. Series name: “GDP per capita (current US$)”; [accessed 2018 Oct 18]. https://data.worldbank.org/indicator/PA.NUS.FCRF?end=2016&start=2016 .
- Commission on Macroeconomics and Health. Macroeconomics and health: investing in health for development. Cambridge (MA): Center for International Development at Harvard University; 2001. [accessed 2020 Jun 27]. http://apps.who.int/iris/bitstream/10665/42435/1/924154550X.pdf .
- Pradhan E, Suzuki EM, Martínez S, Schäferhoff M, Jamison DT. The effects of education quantity and quality on child and adult mortality: their magnitude and their value. In: Bundy D, de Silva N, Horton S, Jaminson D, Patton G, editors. 3rd ed. Washington (DC): International Band for Reconstruction and Development/The World Bank; 2017. p. 423–439. https://www.ncbi.nlm.nih.gov/books/NBK525273/#pt5.ch30.sec4 .
- Claxton K, Martin S, Soares M, Rice N, Spackman E, Hinde S, Devlin N, Smith PC, Sculpher M. Methods for the estimation of the national institute for health and care excellence cost-effectiveness threshold. Health Technol Assess (Rockv). 2015;19(14):1366–5278. doi:10.3310/hta19140.
- Revill P, Ochalek J, Lomas J, Nakamura R, Woods B, Rollinger A, Suhrcke M, Sculper M, Claxton K. Cost-effectiveness thresholds: guiding health care spending for population health improvement. York (UK): Center for Health Economics, University of York; 2015.
- World Bank national accounts data, and OECD National Accounts data files. Series name: “Final consumption expenditure (current US$)”; [accessed 2018 Oct 21].
- United Nations Population Division. World population prospects: 2017 revision. Series name: “Population, total”; [accessed 2018 Sep 19].https://population.un.org/wpp/Download/Standard/Population/ .
- Office of National Statistics Algeria. Consumer spending survey and the standard of living of households 2011 report. Tab. n°20: Salaires nets moyens mensuels par sexe et tranches d’âges. Algiers (DZ); 2014 Nov [accessed 2018 Oct 3]. http://www.ons.dz/IMG/pdf/pubfinsal13-2.pdf .
- Statistical Committee of the Republic of Armenia. Data from: LFS_2016.xlsx [dataset]. Labor force survey anonymised micro data database (by household’s members); 2016 [accessed 2018 Oct 3]. https://www.armstat.am/en/?nid=212 .
- Republic of Bulgaria, National Statistical Institute. Data from: number of employees, average gross and net hourly earnings and average gross overtime hourly earnings in October 2002 by gender and age - total full-time and part-time employees [dataset]. Time series data on hourly earnings by age; [accessed 2018 Oct 3]. http://www.nsi.bg/en/content/6528/age .
- European Commission, Eurostat. Data from: mean hourly earnings by sex, age and occupation – NACE Rev. 2, B-S excluding O (earn_ses14_14) [dataset]. Database: the structure of earnings survey; 2014 [accessed 2016 Aug 18]. http://ec.europa.eu/eurostat/data/database .