
ABSTRACT
Currently available health economic models for varicella infection are designed to inform the cost-effectiveness of universal varicella vaccination (UVV) compared with no vaccination. However, in countries with an existing UVV program, these models cannot be used to evaluate whether to continue with the current varicella vaccine or to switch to an alternative vaccine. We developed a dynamic transmission model that incorporates the historical vaccination program to project the health and economic impact of changing vaccination strategies. We applied the model to Israel, which initiated UVV in 2008 with a quadrivalent vaccine, MMRV-GSK, and switched to MMRV-MSD in 2016. The model was calibrated to pre-vaccination incidence data before projecting the impact of the historical and future alternative vaccination strategies on the clinical burden of varicella. Total costs and QALYs lost due to varicella infections were projected to compare continuing with MMRV-MSD versus switching to MMRV-GSK in 2022. Over a 50-year time horizon, continuing with MMRV-MSD reduced varicella incidence further by 64%, reaching 35 cases per 100,000 population by 2072, versus a 136% increase in incidence with MMRV-GSK. Continuing with MMRV-MSD reduced cumulative hospitalization and outpatient cases by 48% and 58% (vs. increase of 137% and 91% with MMRV-GSK), respectively. Continuing with MMRV-MSD resulted in 139 fewer QALYs lost with total cost savings of 3% compared with switching to MMRV-GSK, from the societal perspective. In Israel, maintaining the UVV strategy with MMRV-MSD versus switching to MMRV-GSK is projected to further reduce the burden of varicella and cost less from the societal perspective.
Background
Varicella, also known as chickenpox, is an infectious disease caused by the varicella zoster virus (VZV). Individuals affected by varicella experience vesicular rash. While the disease is generally mild, it may result in complications, including bacterial infections, dehydration, pneumonia, and encephalitis, and in rare cases, death.Citation1 Globally, varicella is one of the most common childhood infectious diseases, with an estimated annual incidence of approximately 42.9 cases per 1,000 persons for children under the age of 15 years.Citation2 VZV also causes herpes zoster (HZ), commonly known as shingles, a reactivation of latent VZV.Citation1 Globally, HZ incidence is estimated to be 4–4.5 cases per 1,000 person-years.Citation3
Varicella is a vaccine preventable disease. The World Health Organization (WHO) recommends a first dose of varicella vaccine at the age of 12 to 18 months to reduce mortality and severe morbidity, and a second dose between 4 and 6 years to decrease cases and outbreaks.Citation4 As of 2019, 39 countries have successfully implemented single dose or two-dose universal varicella vaccination (UVV) programs.Citation5 The implementation of these programs has led to a significant decline in the burden of varicella globally.
Several varicella vaccines are available, each with different clinical profiles.Citation6–8 Countries with an existing UVV program may consider switching to an alternative varicella vaccine during the vaccine public procurement process (tender) for reasons related to supply, clinical benefits, or costs. However, the long-term clinical and economic impact of switching between different varicella vaccines, each with their own clinical profile, are not well known.
Previously developed dynamic transmission models for varicella were designed to evaluate the health and economic impact of introducing a universal vaccination strategy in an unvaccinated population.Citation9–13 Such models are useful for policymakers to evaluate the clinical and economic value of vaccinating populations. In many countries, however, universal vaccination programs have already been implemented.Citation14–17 Policy makers are then faced with a different question – whether to remain with their current vaccination strategy or to switch to a different vaccine. To support this decision-making, the model should account for the impact of historical vaccine strategies that influence current disease incidence instead of comparing with the pre-vaccination era.
To address this gap, we developed a novel dynamic transmission model that incorporates historical vaccination strategies and then evaluates the health and economic impact of the potential changes to the current UVV program. We applied this model in a case study to investigate the impact of switching to a different varicella vaccine in the current two-dose UVV program in Israel.
Methods
Dynamic model
The model is a deterministic, continuous time, compartmental, population-level dynamic model that represents the distribution of health states in the population with a system of non-linear ordinary differential equations. The population is stratified into age groups, with modifiable age cuts to match the vaccination schedule(s) and available country-specific demographic, epidemiological, and economic data. The size of the population is assumed to be constant over time.
The model is a variation of an MSEIRV (Maternal-Susceptible-Exposed-Infected-Recovered-Vaccinated) model, a structure commonly used to evaluate the impact of childhood vaccination programs.Citation18 The model has been extended with states representing reactivation of VZV leading to HZ outbreaks. In addition, the model accounts for the potential impact of UVV on exogenous boosting.Citation19
The set of health states and transitions in the model are similar to those used in other cost-effectiveness models for UVV, except our model replaces the Failure-Take-Waning-Degree structure of vaccine effectiveness with an alternative structure that better aligns with long-term randomized controlled trial (RCT) data Citation6,Citation8 and real-world evidence Citation20,Citation21 to allow for direct comparison of vaccine performance.Citation22 The updated vaccine effectiveness structure is based on a deterministic compartmental model to simulate clinical trials of these vaccines fit to actual clinical trial data. provides a high-level view of the transitions between health states in the model and the changing vaccine strategies over time (a switching model). A detailed description of the model, including the model flow and equations, is available in Appendix A. Varicella and HZ related epidemiological parameters are summarized in .
Figure 1. MSEIVR dynamic transmission model diagram with switching vaccines.
Table 1. Epidemiological inputs.
Calibration
The model was calibrated in two stages using data prior to the introduction of a UVV program in a country (i.e., Israel). In the first stage, age-specific relative risks of varicella infection were fit to VZV seroprevalence data in the absence of vaccination, using historical mixing data and age-based reactivation rates.Citation31,Citation32 In the second stage, reactivation rates were fit to pre-vaccination HZ incidence data, also in the absence of vaccination. Additional details and results of the calibration are presented in Appendix B.
UVV program evaluation
The calibrated model was then used to assess the impact of a time-dependent UVV program on the long-term health and economic consequences of varicella and zoster in the population. The UVV program is composed of both historical and future vaccination strategies that are implemented in the population over time. Varicella and HZ incidence are projected over the time horizon of interest.
Quality-adjusted life years (QALYs) lost were computed using health state utility values and the average time an individual spent in a disease state (varicella or HZ) (see Appendix C, Table SC2), as well as the lost life expectancy due to disease-related premature death. Direct medical costs included vaccine acquisition and administration costs and the cost of outpatient and inpatient care for varicella and HZ cases. Indirect costs included work productivity loss due to days missed from work by the patient or caregiver for varicella and HZ cases. Discount rates for QALYs lost and costs were applied.
Case study
We applied the switching model to Israel’s UVV program. In 2008, Israel initiated a UVV program. The first vaccination strategy (V1) consisted of two doses of MMRV-GSK (Priorix Tetra, GlaxoSmithKline, Brentford, London, UK) administered at 12 months and 6 years of age according to the Israel varicella vaccine schedule. In 2016, a second strategy (V2) was introduced by switching the vaccine brand to MMRV-MSD (ProQuad, Merck & Co., Inc, Rahway, NJ, USA). Thus, the two historical vaccination strategies accounted for in the model are:
V1 (MMRV-GSK): 2008 – 2015
V2 (MMRV-MSD): 2016 – 2021
In early 2022, the Israel Ministry of Health underwent a tender process to determine whether to continue vaccination with MMRV-MSD (continuation of V2) or to switch to MMRV-GSK (third strategy, denoted V3). We used our model to evaluate the health and economic impact over the next 50 years (2022 onwards) of the following two UVV programs:
Continue with MMRV-MSD: V2 (MMRV-MSD): 2022 – 2072
Switch to MMRV-GSK: V3 (MMRV-GSK): 2022 – 2072
The model was calibrated against pre-vaccination varicella seroprevalence Citation33 and herpes zoster incidence Citation34 data for Israel. While HZ incidence data spanned the period from 2006 through 2010, only data for 2006 and 2007 was used in calibration to reflect pre-vaccination HZ incidence. Age-specific fertility and mortality data was extracted from the Israeli government website and from the United Nations.Citation35 Maturation rates were computed using mortality rates and the length of each age group and were subsequently used to calculate the birth rate required to keep the population constant over the time horizon.
We used a price parity approach, where the varicella price per dose was the same regardless of brand, because actual prices in Israel are determined during the tender process. Tender prices are not publicly available and tend to be lower than list price and closer to each other. Price parity allows the evaluation of cost-effectiveness to be based on product characteristics, decoupled from tender prices that are unknown but likely to be similar. A sensitivity analysis on the price per dose for each product was conducted to evaluate how price may affect results.
Vaccination costs were computed by multiplying the number of vaccine doses over the 50-year time horizon, assuming a 97% coverage rate (consistent with current coverage for MMRV in Israel)Citation36, by the vaccine price per dose along with administration costs. Direct medical costs for outpatient visits were calculated by multiplying the expected number of outpatient visits (number of cases × proportion of cases with outpatient visits × average number of visits per case) by the average cost per outpatient visit. Direct costs for inpatient care were calculated by multiplying the expected number of hospitalizations (number of cases × proportion of cases with inpatient visit) by the average cost per hospitalization (average length of stay × cost per day). Indirect costs due to productivity losses were obtained by multiplying the number of cases requiring outpatient and inpatient care by the average number of workdays lost by the patient or caregiver according to type of care required. Direct medical costs were obtained for projected varicella cases, uncomplicated HZ cases, and complicated cases resulting in PHN. Cost-related inputs are provided in . Country-specific inputs were used where available; otherwise, we used data from high income European countries with a similar health-care system and socioeconomic status as a proxy, a commonly used approach. To address potential heterogeneity, these parameters (e.g., varicella and HZ inpatient utilization, HZ and PHN inpatient and outpatient costs, and workdays lost due to HZ) were included in the sensitivity analysis.
Table 2. Model inputs for direct and indirect costs for varicella and herpes zoster.
QALYs lost were computed using health state utility values (Appendix, Table SA5) and the average amount of time an individual spends in a disease state (varicella or HZ) as well as the lost life expectancy due to disease-related premature death.
WHO guidelines for economic analysis recommend adopting a societal perspective when there are no national guidelines for health economic evaluation.Citation45 A recently published position paper from Vaccines Europe also recommends that vaccine health technology assessments consider the direct and indirect impact of vaccines on individuals, society and public health, and that they include attributes that contribute to their broad societal and health value.Citation46 With these goals in mind, this model primarily focused on costs from the societal perspective, which includes both direct costs (e.g. costs associated with vaccination, direct treatment of disease) and indirect costs (e.g. cost associated with works days lost and lost productivity). Incremental costs and QALYs were computed over a 50-year time horizon in the base case, and over various time horizons from 5 to 100 years in scenario analyses (see Appendix Table SD1). A 3% annual discount rate was applied to future QALYs lost and costs. A threshold of 1xGDP per capita (approximately 140,865 NIS, 43,740 USD) was used to declare a UVV strategy cost effective.
Both deterministic sensitivity analyses (DSA) and probabilistic sensitivity analyses (PSA) were used to assess the robustness of the cost-effectiveness results. In the DSA, clinical and cost-related parameters were varied individually, to assess the change in the incremental costs and QALYs lost. Tornado diagrams were used to display the most influential parameters for estimating the incremental costs and QALYs gained. In the PSA, parameters were varied simultaneously and drawn from uniform distributions over their individual ranges. Incremental costs and QALYs were computed for 500 sets of randomly selected parameter values to assess the likelihood that one UVV program was cost-effective compared to another. Inputs used in the DSA and PSA are provided in Appendix Table SC3.
Results
Clinical outcomes
In 2021, the incidence of varicella in Israel was estimated as 89 cases per 100,000 population following implementation of the UVV program with MMRV-GSK during 2008–2016 and MMRV-MSD during 2016–2021. By maintaining the two-dose vaccination strategy with MMRV-MSD, varicella incidence is projected to continue to decline to 35 cases per 100,000 population in 2072 (). However, switching to MMRV-GSK in 2022 (when varicella incidence is 81 cases per 100,000 population) would initially result in a 76% increase in the varicella incidence rate by 2030, peaking at 142 cases per 100,000 population, before declining to 98 cases per 100,000 population by 2072 (176% higher than MMRV-MSD). This increase in incidence with MMRV-GSK was primarily due to breakthrough cases after the first dose (), with more breakthrough cases overall for MMRV-GSK versus MMRV-MSD (373,766 versus 115,639 breakthrough cases, respectively) over the 50-year time horizon ().
Figure 2. Total varicella incidence (2022–2072).
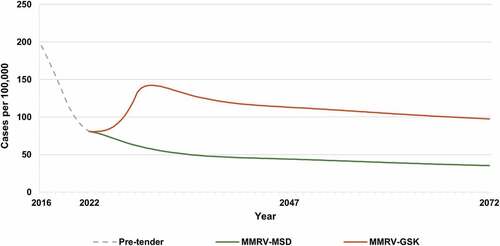
Figure 3. Breakthrough varicella incidence* (2022–2072).
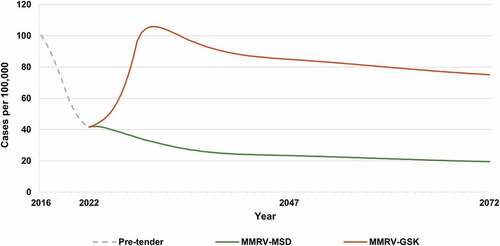
Table 3. Cumulative varicella and HZ health outcomes over 50 years (2022-2072).
The health benefits of continuing with MMRV-MSD are projected across all age groups, with the greatest benefits expected in children less than 10 years of age (Appendix Figure SD1). Switching to MMRV-GSK increases the number of varicella cases by 137% overall and by 203% in children younger than 10 years of age over the 50-year time horizon from 2022 to 2072.
Because 90% of the varicella cases are expected to result in outpatient care across all age groups, similar increases were projected for the number of cases requiring an outpatient visit with a switch to MMRV-GSK (). For hospitalizations, switching to MMRV-GSK in 2022 resulted in nearly twice as many hospitalizations compared with continuing with MMRV-MSD (2,030 and 1,065 hospitalizations with MMRV-GSK and MMRV-MSD, respectively).
The differential impact of switching to MMRV-GSK on the HZ incidence rate (Appendix, Figure SD2), total HZ cases, and HZ deaths is minimal (). While HZ incidence continues to decline over time regardless of strategy (from 289 cases per 100,000 population to 196 and 191 by 2072 for MMRV-MSD and MMRV-GSK, respectively), the cumulative number of HZ cases (wild-type and vaccine type) by continuing with MMRV-MSD is approximately 1% greater than with MMRV-GSK, owing in part to more limited exogenous boosting under the MMRV-MSD strategy.
Economic outcomes
Switching to MMRV-GSK results in an estimated 139 additional QALYs lost (20,640 for MMRV-MSD vs. 20,779 for MRV-GSK) () due to the increase in varicella cases.
Table 4. Vaccine doses, QALYs lost, and discounted costs per capita (2022–2072).
From the societal perspective, where both direct and indirect costs are included, continuing with MMRV-MSD dominates switching to MMRV-GSK, as fewer QALYs are lost and total costs are lower (2.8% lower with MMRV-MSD) (). Switching to MMRV-GSK resulted in more varicella cases and therefore fewer vaccine doses being administered (children with breakthrough varicella cases were not eligible for the 2nd vaccine dose), contributing to a reduction in vaccination costs of 4.1% as compared with remaining with MMRV-MSD.
Alternative time horizons
When increasing the time horizon from 5 to 100 years beyond 2022, the number of varicella cases that occurred with switching to MMRV-GSK rose at an increasing rate, from 6,754 additional cases after 5 years (average of 1,351 more cases per year) to 564,759 additional cases after 100 years (average of 5,648 additional cases per year) (Appendix Table SD1). These additional cases resulted in an increasing number of QALYs lost over time. From the societal perspective, total costs were marginally lower for MMRV-GSK over shorter time horizons (e.g., 10 years: MMRV-MSD vs. MMRV-GSK: $483.1 million vs. $482.8 million) and considerably lower for MMRV-MSD over longer time horizons (e.g., 25 years: MMRV-MSD vs. MMRV-GSK: $969.1 million vs. $990.2 million) due to the accumulation of more breakthrough varicella cases for MMRV-GSK over time.
Sensitivity analysis
Deterministic sensitivity analysis
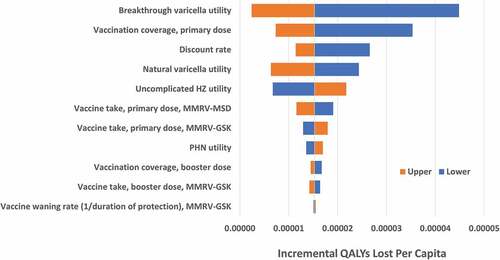
In the one-way sensitivity analyses, incremental costs per capita were sensitive to the discount rate, vaccine coverage rate and the vaccine cost per dose (). A 20% decrease in vaccination coverage rate resulted in higher costs if switching to MMRV-GSK. Varying MMRV-MSD cost by $5 per dose produced a difference of $5.76 in the incremental total cost per capita; varying MMRV-GSK cost by $5 per dose resulted in a difference of $5.50 in the incremental total cost per capita. The utility for breakthrough varicella had the greatest impact on the incremental QALYs lost when switching to MMRV-GSK, with more QALYs lost with a lower utility weight (). The primary-dose coverage rate was also influential, where a lower coverage rate increased the QALYs lost if switching to MMRV-GSK. For all parameters evaluated in the deterministic sensitivity analysis, switching from MMRV-MSD to MMRV-GSK resulted in a higher total cost per capita and more QALYs lost compared to remaining with MMRV-MSD.
Figure 4. Tornado plot of incremental cost per capita over 50 years following switch from MMRV-MSD to MMRV-GSK (in USD, societal perspective).
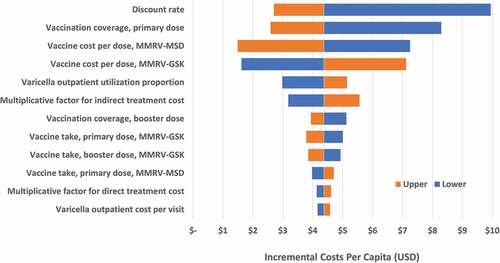
Figure 5. Tornado plot for incremental QALYs lost per capita over 50 years following switch from MMRV-MSD to MMRV-GSK.
Probabilistic sensitivity analysis
In the probabilistic sensitivity analysis, there was approximately a 7% chance that switching to MMRV-GSK would be cost-effective at a threshold equal to Israel’s GDP per capita (Appendix Figure SD3), relative to continuing with MMRV-MSD. The probability increased to 11% and 16% at thresholds equal to two and three times the GDP per capita, respectively.
Discussion
To our knowledge, this is the first study to incorporate historical UVV strategies and the potential switch between vaccines, which allows policymakers and ministries of health to assess different strategies in this real-world context. We used Israel as a case study to assess the long-term impact of different vaccination strategies since implementation of a UVV program in 2008 (MMRV-GSK (2008–2016) and MMRV-MSD (2016–2021)). We extended the MSEIRV model by allowing vaccination to be governed by a sequence of time-dependent varicella vaccination strategies.
Our study showed that the incidence of varicella was 89 cases per 100,000 population in 2021, down from 1,286 cases per 100,000 population in 2008. If vaccination with MMRV-MSD was maintained, this downward trend was expected to continue, reaching 35 cases per 100,000 in 2072. However, when the vaccination strategy was switched in 2022 to MMRV-GSK in the model, the trajectory was altered, and incidence was projected to rise over the next 8 years to 142 cases per 100,000 population. While incidence subsequently declined through the 50-year time horizon, incidence remained above the 2021 level at 98 cases per 100,000 population in 2072. The higher incidence with MMRV-GSK was due to the lower efficacy associated with the first dose of MMRV-GSK, resulting in more children remaining susceptible to varicella infection.Citation8 Since the dosing interval between first and second doses in the Israel UVV program is 5 years, this led to an accumulation of a significantly higher number of breakthrough cases compared with MMRV-MSD. Thus, switching to MMRV-GSK was expected to significantly increase breakthrough varicella cases by 223% over the 50-year time horizon. This is further reflected in increases in outpatient cases (137%) and hospitalizations (91%) over the next 50 years. The impact of switching vaccines on HZ incidence was negligible, with the cumulative number of HZ cases being 1% higher if continuing with MMRV-MSD versus switching to MMRV-GSK.
Because significantly fewer varicella cases are expected if vaccination with MMRV-MSD continues, 139 fewer QALYs are lost when compared with switching to MMRV-GSK. Taking both direct and indirect costs into consideration, continuing with MMRV-MSD leads to fewer QALYs lost at a lower total cost (3% lower). Thus, for policymakers driven by value-based decisions, continuing the UVV program with MMRV-MSD is a dominant strategy from the societal perspective versus switching to MMRV-GSK, over a 50-year time horizon. Total vaccination costs were slightly higher for MMRV-MSD (4% higher), primarily driven by a greater number of doses being administered for MMRV-MSD. These costs are partially offset by a reduction in treatment costs, with societal costs for MMRV-MSD 7% lower compared with MMRV-GSK.
Our previous models have compared the health and economic impact of introduction of UVV with no vaccination. While the comparator in these models is different, the results are consistent with our findings. These studies show significant reduction in the burden of varicella with different strategies. For example, in model adaptations for UVV in Norway, Italy, and Turkey, two doses of V-MSD/MMRV-MSD were cost-effective or cost-saving strategies.Citation10,Citation11,Citation47
Clinical results were robust under a wide range of epidemiological parameters, favoring continuation with MMRV-MSD. Economic results were highly sensitive to vaccination coverage rates and vaccine costs. Further, when examining different time horizons, total costs were marginally lower for MMRV-GSK over shorter time horizons (≤10 years) and appreciably lower for MMRV-MSD over longer time horizons (≥25 years), with fewer QALYs lost for MMRV-MSD regardless of time horizon.
Our analysis was subject to several limitations. While vaccines against HZ are available, they were not considered in this model as the HZ vaccine is not included in the national immunization program in Israel. Inclusion of an HZ vaccine could have a positive impact on the cost-effectiveness of continuing with MMRV-MSD, although the impact would likely be small given the nominal difference in HZ cases between vaccine strategies. In the model, population size was assumed to be constant, and no seasonal effects on disease transmission were considered. A varying population size with time-dependent demographic parameters and contact rates could potentially change the landscape of disease transmission, especially if seasonal transmission were considered. Further, in instances where country-specific inputs were not available, we used data from other countries as a proxy. Finally, while WeitzmanCitation34 provided HZ incidence data from 2006 to 2010, only data prior to the introduction of UVV from 2006 to 2007 was used to calibrate the model since it provides an accurate reflection of seroprevalence of varicella without universal vaccination program. While data over 2 years is sufficient for calibration and a good fit was obtained, more pre-UVV data would increase confidence in the calibrated model.
Our model showed significant clinical and economic impact of switching to a different varicella vaccination strategy. Based on our case study, maintaining the UVV strategy with MMRV-MSD versus switching to MMRV-GSK is projected to further reduce the clinical and humanistic burden of varicella in Israel, and to cost less from the societal perspective. These conclusions are based on a new dynamic transmission model designed to evaluate the impact of changes to an existing UVV program. Unlike prior models designed to determine whether universal vaccination should be introduced, our model provides health and economic insights to inform policymakers evaluating whether to switch or remain with their current vaccination strategy.
Supplemental Appendix
Download MS Word (373.2 KB)Acknowledgement
The authors thank John Cook, Complete HEOR Solutions, for his contributions and medical writing assistance.
Disclosure statement
Kujawski SA, and Pawaskar M are employees of Merck Sharp & Dohme LLC, a subsidiary of Merck & Co., Inc., Rahway, NJ, USA, and may hold stock or own stock options in the Company. Burgess C is a contractor of Merck Sharp & Dohme LLC, a subsidiary of Merck & Co., Inc., Rahway, NJ, USA and may hold stock or own stock options in the Company. Agi O and Attias-Geva Z are employees of MSD, Hod HaSharon, Israel. Pillsbury M was an employee of Merck Sharp and Dohme LLC, a subsidiary of Merck & Co., Inc., Rahway, NJ, USA when the work was completed, and may hold stock or own stock options in the Company. Greenberg D is an employee of Ben Gurion University of the Negev, Israel, served as a consultant to Merck Sharp & Dohme LLC, a subsidiary of Merck & Co., Inc., Rahway, NJ, USA, and is a member of the Israel NITAG. Bencina G is an employee of MSD, Madrid, Spain and may hold stock or own stock options in the Company.
Supplementary material
Supplemental data for this article (all appendices noted in the article) can be accessed on the publisher’s website at https://doi.org/10.1080/21645515.2022.2124784
Additional information
Funding
References
- Heininger U, Seward JF. Varicella. Lancet. 2006;368(9544):1–9. doi:10.1016/S0140-6736(06)69561-5.
- Bardach A, Cafferata ML, Klein K, Cormick G, Gibbons L, Ruvinsky S. Incidence and use of resources for chickenpox and herpes zoster in Latin America and the Caribbean—a systematic review and meta-analysis. Pediatr Infect Dis J. 2012;31(12):1263–68. doi:10.1097/INF.0b013e31826ff3a5.
- Yawn BP, Gilden D. The global epidemiology of herpes zoster. Neurol. 2013;81(10):928–30. doi:10.1212/WNL.0b013e3182a3516e.
- World Health Organization.Varicella and herpes zoster vaccines: WHO position paper, June 2014. Weekly Epidemiol Rec= Relevé Épidémiol Hebdomadaire. 2014;89:265–87.
- Varela FHP, Scotta MC. Global impact of varicella vaccination programs. Hum Vaccines Immuno. 2019;15:645–57.
- Kuter B, Matthews H, Shinefield H, Black S, Dennehy P, Watson B, Reisinger K, Kim LL, Lupinacci L, Hartzel J, et al. Ten year follow-up of healthy children who received one or two injections of varicella vaccine. Pediatr Infect Dis J. 2004;23(2):132–37.
- Oh SH, Choi EH, Shin SH, Kim YK, Chang JK, Choi KM, Hur JK, Kim KH, Kim JY, Chung EH, et al. Varicella and varicella vaccination in South Korea. Clin Vaccine Immunol. 2014;21(5):762–68.
- Povey M, Henry O, Bergsaker MAR, Chlibek R, Esposito S, Flodmark CE, Gothefors L, Man S, Silfverdal SA, Štefkovičová M, et al. Protection against varicella with two doses of combined measles-mumps-rubella-varicella vaccine or one dose of monovalent varicella vaccine: 10-year follow-up of a phase 3 multicentre, observer-blind, randomised, controlled trial. Lancet Infect Dis. 2019;19(3):287–97.
- Van Hoek AJ, Melegaro A, Zagheni E, Edmunds WJ, Gay N. Modelling the impact of a combined varicella and zoster vaccination programme on the epidemiology of varicella zoster virus in England. Vaccine. 2011;29(13):2411–20. doi:10.1016/j.vaccine.2011.01.037.
- Wolfson LJ, Daniels VJ, Pillsbury M, Kurugöl Z, Yardimci C, Kyle J, Dinleyici EC. Cost-effectiveness analysis of universal varicella vaccination in Turkey using a dynamic transmission model. PloS One. 2019;14:e0220921.
- Azzari C, Baldo V, Giuffrida S, Gani R, O’Brien E, Alimenti C, Daniels VJ, Wolfson LJ. The cost-effectiveness of universal varicella vaccination in Italy: a model-based assessment of vaccination strategies. ClinicoEconomics Outcomes Res: CEOR. 2020;12:273.
- Heininger U, Pillsbury M, Samant S, Lienert F, Guggisberg P, Gani R, O’Brien E, Pawaskar M. Health impact and cost-effectiveness assessment for the introduction of universal varicella vaccination in Switzerland. Pediatr Infect Dis J. 2021;40:e217–e21.
- Akpo EIH, Cristeau O, Hunjan M, Casabona G. Epidemiological impact and cost-effectiveness of varicella vaccination strategies in the United Kingdom. Clin Infect Dis. 2021;73(11):e3617–e26. doi:10.1093/cid/ciaa1708.
- Nguyen HQ, Jumaan AO, Seward JF. Decline in mortality due to varicella after implementation of varicella vaccination in the United States. N Engl J Med. 2005;352(5):450–58. doi:10.1056/NEJMoa042271.
- Bechini A, Boccalini S, Baldo V, Cocchio S, Castiglia P, Gallo T, Giuffrida S, Locuratolo F, Tafuri S, Martinelli D, et al. Impact of universal vaccination against varicella in Italy: experiences from eight Italian regions. Human Vaccines Immun. 2015;11(1):63–71.
- Gil-Prieto R, Walter S, Gonzalez-Escalada A, Garcia-Garcia L, Marín-García P, Gil-de-Miguel A. Different vaccination strategies in Spain and its impact on severe varicella and zoster. Vaccine. 2014;32(2):277–83. doi:10.1016/j.vaccine.2013.11.008.
- Spoulou V, Alain S, Gabutti G, Giaquinto C, Liese J, Martinon-Torres F, Vesikari T. Implementing universal varicella vaccination in Europe: the path forward. Pediatr Infect Dis J. 2019;38:181–88.
- Schuette MC, Hethcote HW. Modeling the effects of varicella vaccination programs on the incidence of chickenpox and shingles. Bull Math Biol. 1999;61:1031–64.
- Forbes H, Douglas I, Finn A, Breuer J, Bhaskaran K, Smeeth L, Packer S, Langan SM, Mansfield KE, Marlow R, et al. Risk of herpes zoster after exposure to varicella to explore the exogenous boosting hypothesis: self controlled case series study using UK electronic healthcare data. Bmj. 2020;368:16987.
- Marin M, Marti M, Kambhampati A, Jeram SM, Seward JF. Global varicella vaccine effectiveness: a meta-analysis. Pediatr. 2016;137(3). doi:10.1542/peds.2015-3741.
- Baxter R, Ray P, Tran TN, Black S, Shinefield HR, Coplan PM, Lewis E, Fireman B, Saddier P. Long-term effectiveness of varicella vaccine: a 14-year, prospective cohort study. Pediatr. 2013;131:e1389–e96.
- Pillsbury M, Carias C, Samant S, Greenberg D, Pawaskar M. Comparison of performance of varicella vaccines via infectious disease modeling. Vaccine. 2020;40:3954–62.
- Gershon AA, Raker R, Steinberg S, Topf-Olstein B, Drusin LM. Antibody to varicella-zoster virus in parturient women and their offspring during the first year of life. Pediatr. 1976;58(5):692–96. doi:10.1542/peds.58.5.692.
- Marin M, BSR. Varicella/herpes zoster. 16 ed. Washington, DC: Ameerican Public Health Association; 2015.
- Brisson M, Edmunds W, Gay N, Law B, De Serres G. Modelling the impact of immunization on the epidemiology of varicella zoster virus. Epidemiol Infect. 2000;125(3):651–69. doi:10.1017/S0950268800004714.
- Bernstein HH, Rothstein EP, Associates PP, Watson BM, Reisinger KS, Blatter MM, Wellman CO, Chartrand SA, Cho I, Ngail A, et al. Clinical survey of natural varicella compared with breakthrough varicella after immunization with live attenuated Oka/Merck varicella vaccine. Pediatr. 1993;92(6):833–37.
- Izurieta HS, Strebel PM, Blake PA. Postlicensure effectiveness of varicella vaccine during an outbreak in a child care center. Jama. 1997;278:1495–99.
- Seward JF, Zhang JX, Maupin TJ, Mascola L, Jumaan AO. Contagiousness of varicella in vaccinated cases: a household contact study. Jama. 2004;292(6):704–08. doi:10.1001/jama.292.6.704.
- Garnett G, Grenfell B. The epidemiology of varicella–zoster virus infections: a mathematical model. Epidemiol Infect. 1992;108(3):495–511. doi:10.1017/S0950268800050007.
- Poletti P, Melegaro A, Ajelli M, Del Fava E, Guzzetta G, Faustini L, Scalia Tomba G, Lopalco P, Rizzo C, Merler S, et al. Perspectives on the impact of varicella immunization on herpes zoster. A model-based evaluation from three European countries. PloS One. 2013;8(4):e60732.
- Prem K, Cook AR, Jit M, Halloran B. Projecting social contact matrices in 152 countries using contact surveys and demographic data. PLoS Comput Biol. 2017;13:e1005697.
- Brisson M, Gay N, Edmunds W, Andrews N. Exposure to varicella boosts immunity to herpes-zoster: implications for mass vaccination against chickenpox. Vaccine. 2002;20(19–20):2500–07. doi:10.1016/S0264-410X(02)00180-9.
- Cohen D, Davidovici B, Smetana Z, Balicer R, Klement E, Mendelson E, Green MS. Seroepidemiology of varicella zoster in Israel prior to large-scale use of varicella vaccines. Infect. 2006;34:208–13.
- Weitzman D, Shavit O, Stein M, Cohen R, Chodick G, Shalev V. A population based study of the epidemiology of herpes zoster and its complications. J Infect. 2013;67(5):463–69. doi:10.1016/j.jinf.2013.06.016.
- World population prospects United Nations - Population Division; 2019. https://population.un.org/wpp/Download/Standard/Fertility/
- Stein-Zamir C, Rishpon S. The national immunization technical advisory group in Israel. Isr J Health Policy Res. 2021;10(1):7. doi:10.1186/s13584-021-00442-4.
- Pharma-Soft. Medicine price list. https://www.pharma-soft.co.il/product
- Ginsberg G, Somekh E. Cost containment analysis of childhood vaccination against varicella in Israel. J Infect. 2004;48(2):119–33. doi:10.1016/S0163-4453(03)00079-3.
- Riera-Montes M, Bollaerts K, Heininger U, Hens N, Gabutti G, Gil A, Nozad B, Mirinaviciute G, Flem E, Souverain A, et al. Estimation of the burden of varicella in Europe before the introduction of universal childhood immunization. BMC Infect Dis. 2017;17(1):1–16.
- Ministry of Health, State of Israel. Ministry of health tariff; 2021. https://www.gov.il/he/Departments/DynamicCollectors/moh-price-list?skip=0
- Gialloreti LE, Merito M, Pezzotti P, Naldi L, Gatti A, Beillat M, Serradell L, di Marzo R, Volpi A. Epidemiology and economic burden of herpes zoster and post-herpetic neuralgia in Italy: a retrospective, population-based study. BMC Infect Dis. 2010;10:1–11.
- Littlewood KJ, Ouwens MJ, Sauboin C, Tehard B, Alain S, Denis F. Cost-effectiveness of routine varicella vaccination using the measles, mumps, rubella and varicella vaccine in France: an economic analysis based on a dynamic transmission model for varicella and herpes zoster. Clin Ther. 2015;37:830–41. e7.
- Gauthier A, Breuer J, Carrington D, Martin M, Rémy V. Epidemiology and cost of herpes zoster and post-herpetic neuralgia in the United Kingdom. Epidemiol Infect. 2009;137(1):38–47. doi:10.1017/S0950268808000678.
- National Insurance Institute, State of Israel. Average wage according to sections 1 and 2 of the national insurance law. https://www.btl.gov.il/Mediniyut/GeneralData/Pages/%D7%A9%D7%9B%D7%A8%20%D7%9E%D7%9E%D7%95%D7%A6%D7%A2.aspx
- Geneva: World Health Organization. WHO guide for standardization of economic evaluations of immunization programmes. 2nd ed. Licence: CC BY-NC-SA 3.0 IGO2019. https://apps.who.int/iris/bitstream/handle/10665/329389/WHO-IVB-19.10-eng.pdf
- Oakes K. Vaccines Europe makes the case for vaccine-specific HTA: regulatory affairs professionals society (RAPS); 2021 [accessed 2021 Sep 21]. https://www.raps.org/news-and-articles/news-articles/2021/9/vaccines-europe-makes-the-case-for-vaccine-specifi
- Pawaskar M, Burgess C, Pillsbury M, Wisløff T, Flem E. Clinical and economic impact of universal varicella vaccination in Norway: a modeling study. PloS One. 2021;16:e0254080.