
 ?Mathematical formulae have been encoded as MathML and are displayed in this HTML version using MathJax in order to improve their display. Uncheck the box to turn MathJax off. This feature requires Javascript. Click on a formula to zoom.
ABSTRACT
The decline in children’s vaccination coverage and the resurgence of preventable infectious diseases draw attention to parents’ vaccine hesitancy. Our study introduces two validated tools to independently assess vaccine hesitancy and health literacy among parents with school-age children. We developed a Vaccine Confidence Index (VCI) from 10 Likert items, exploring their relationships through exploratory and confirmatory factor analyses. We modified the IMETER (Italian medical term recognition test) to measure health literacy. We assessed the internal consistency of the modified IMETER and the 10 Likert items using Cronbach’s alpha test (α) and McDonald’s omega total coefficient (ω) with good results (ω = 0.92, α = 0.90; ω = 0.87, α = 0.82 respectively). We used these tools within a questionnaire conducted on 743 parents recruited from pediatric clinic waiting rooms in Italy, collecting demographic data, information sources on vaccines and vaccine-preventable diseases knowledge. The VCI resulting from factor analyses consisted of six items on a ten-point Likert scale, reflecting the ratio of positive to negative items. The survey revealed significant variations in the VCI according to individual features such as education, use of social networks, or Health institutions as sources of information. Multivariate logistic regression identified an association between vaccine intention and the VCI. Health literacy was functional for 91.2% of participants, but knowledge about vaccine-preventable diseases was generally low. The VCI showed no significant association with health literacy and vaccine-preventable diseases knowledge. The VCI and the modified IMETER effectively assess vaccination attitude and health literacy, offering valuable public health tools for tailoring vaccination campaigns to hesitant population subgroups.
Introduction
Vaccination is one of the most successful and cost-effective public health interventions for the prevention of several infectious diseases.Citation1 Despite this, vaccination is a controversial topic in public debate and Vaccine Hesitancy (VH),Citation2 defined as a “delay in acceptance or refusal of vaccination despite the availability of vaccination services” puts at risk the success of country immunization programs. In Italy, vaccinations are part of the essential levels of care and are offered for free by the Italian National Health Service (I-NHS) following a lifetime immunization schedule included in the Italian National Immunization Plan.Citation3,Citation4 However, from 2013 to 2016, Italy experienced a decreasing trend in the coverage for most of the vaccines administered in all age groups, in particular, for pediatric vaccinations such as poliomyelitis (93.3/100 inhabitants), diphtheria (93.6/100 inhabitants), measles (87.3/100 inhabitants),Citation5 falling below the 95% threshold recommended by the WHO necessary to achieve national targets.Citation6
The hesitancy and the loss of confidence toward vaccines is a global issue: in 2016, the Worldwide Independent Network/Gallup International Association (WIN/GIA) Annual Survey, which surveyed 67 countries, revealed a wide variability in overall sentiments toward vaccination, with the European and Western Pacific regions having the most negative sentiment regarding vaccine safety; Italy ranked among the most critical countries about this issue.Citation7
To address the declining trend in vaccine coverage detected in 2016, since July 2017, Italy made 10 vaccinations mandatory (poliovirus, hepatitis B, tetanus, measles, Haemophilus influenzae B, diphtheria, mumps, rubella, whooping cough and chickenpox) for all children aged 0–16 (Law 31 July 2017, n.119).Citation8 Non-vaccinated children could not attend nurseries and kindergartens and fines were set for parents who didn’t vaccinate their children. The national immunization plan included other vaccines recommended by the I-NHS offered free of charge and as non-mandatory (but recommended) such as anti-pneumococcal, anti-rotavirus and anti-meningococcal B and C vaccines.Citation4
The approach adopted by the Italian government reverted the trend in vaccination coverage rates.Citation9–11 Indeed, since the last trimester of 2017, there was an improving trend in vaccine coverage for Childhood Vaccine-Preventable Diseases, with national coverage percentages rising beyond 90% (vaccination coverages at 24 months old children increased from 2016 to 2017 for measles (87.3% vs 91.8%), mumps (87.2% vs 91.8%) and rubella (87.2% vs 91.8%)).Citation6 The increasing trend remained stable during the following years (2018–2019). The recommended threshold was reached for polio (95.1% for 2018 vs 95.0% for 2019), diphtheria (95.1% for 2018 vs 95.0% for 2019), and measles showed a marked improvement (93.2% for 2018 vs 94.5% for 2019).Citation12,Citation13
However, national trends may hide geographical or social sub-areas where coverage is much lower. In 2019, nine of twenty Italian regions did not meet the World Health Organization (WHO) target for measles vaccine coverage of 95%.Citation14 These clusters with suboptimal vaccination coverage can be the causal factor that led to the frequent onset of infectious disease outbreaks, such as the occurrence of a measles epidemic in early 2017.Citation15
In 2020, the onset of the COVID-19 emergency led to a reduction in vaccination coverage due to public concern about infection and the restructuring of healthcare services to allocate professionals to tackle the emergency.Citation16 Over the first six months of the year, vaccine coverage declined in all regions, including those for primary childhood vaccinations.Citation17 A comparison between the data from 2019 and 2020 revealed a decrease in vaccination coverage ranging from −1 to −2.7%.Citation18 During the following year (2021), some of the accumulated gap was closed. However, vaccination coverages returned to pre-pandemic levels for polio (94%), diphtheria (94%), and measles (93.8%). The pandemic context has also led to a significant debate on COVID-19 vaccination, which has been influenced by authoritarian practices and conspiracy theories,Citation19 affecting the perception of childhood vaccination.Citation20,Citation21
Identifying the causal factors for VH therefore becomes crucial in developing appropriate strategies to contain them. The Strategic Advisory Group of Experts on Immunization (SAGE) Working Group classified the specific determinants of VH into three main categories: contextual influences, individual and group influences and vaccine and vaccination-specific issues.Citation22 The proposed ’‘3Cs’’ model explained factors influencing the decision-making process, identifying three main determinants: complacency (not perceiving diseases as high risk, also due to lack of knowledge about them), convenience (how a vaccine is accessible and affordable) and confidence (trust in the effectiveness and safety of vaccines and in the system that delivers them).Citation23 Betsch et al.Citation24 proposed an expanded model that included constraints (structural and psychological barriers), calculation (engagement in extensive information searching), and aspects pertaining to collective responsibility (willingness to protect others).Citation24
One aspect often associated with VH is the ability to obtain, process and understand basic health information to make appropriate health decisions, known as Health Literacy (HL).Citation25 Studies have shown that low HL is associated with reduced adoption of protective behaviors, such as immunization.Citation26,Citation27 Further research on health literacy during the pandemic has indicated potential effects on COVID-19 vaccination.Citation28–30 Nevertheless, the relationship between HL and VH is complex and needs further investigations.Citation31 To this aim, the concept of vaccine literacy has been proposed and implies “not simply knowledge about vaccines, but also developing a system with decreased complexity to communicate and offer vaccines as sine qua non of a functioning health system.”Citation31 However, communicating vaccine information can be challenging and require specific skills, especially for people with low health literacy, who are often overwhelmed with complex and misleading information from the internet and social media.Citation32,Citation33 Therefore, it is important to further investigate HL as a determinant of VH.
The concept of VH has different levels of severity, ranging from complete acceptance of all vaccines to refusal. This complexity, along with various factors, made it challenging to provide a single tool that can detect and quantify VH accurately in every context.
Therefore, it is necessary to develop a tool that includes multiple facets associated with VH and that can be standardized and contextualized in the environment in which the phenomenon is assessed. Our study aims to provide two validated tools to independently measure VH and HL. Additionally, we assess a sample of the Tuscan population using the Vaccine Confidence Index (VCI) and explore the relationship between VH and respondents’ features such as “Knowledge of VPDs” (KoVPDs) and HL.
Methods
Study population and data collection
We conducted a cross-sectional survey in two different periods: from July 2017 to May 2018 (Phase 1) and from July to November 2018 (Phase 2) in two different opportunistic samples of parents recruited in the waiting room of eight different pediatric clinics in the cities of Leghorn, Viareggio, and Pisa (Tuscany). Eligible participants were at least 18 years old, fluent in Italian and had at least one child aged 0–16 years old. In each phase, we administered different questionnaires. The data were collected by three interviewers. The data collected in both questionnaires included age groups, sex, degree, occupation, number of children, children’s immunization status for Childhood Vaccine-Preventable Diseases (VPDs) according to the National Immunization Schedule,Citation4 parents’ intention to have a child immunized for VPDs, main information source about vaccination and a “Likert statement panel” with 10 suggestions on Likert scale to calculate the Vaccine Confidence Index (VCI). We excluded from the study all those who had not answered the questions used to calculate the VCI (statement: L2, L3, L4, L5, L9, L10). In addition, in Phase 1 we also evaluated health literacy (HL) with a modified version of IMETER (mIMETER);Citation34 in Phase 2, we evaluated participants’ knowledge of three Childhood VPDs with open-ended questions. The complete questionnaires are available in “S1: Phase 1 questionnaire” and “S2: Phase 2 questionnaire” of Supplementary Materials (an unused English version of the questionnaire is also reported in “S3: Phase 1 questionnaire (English version)” and “S4: Phase 2 questionnaire (English version)”).
Measures development
Likert statement panel description
We asked participants to rate their level of agreement with 10 statements related to vaccination using a ten-point Likert scale (1=strongly disagree, 5=intermediate or uncertain, 10=strongly agree). Three of the statements were based on the multicentre study by Larson et al.Citation7 (L1, L3, L6), while two other questions were constructed based on a previous Italian survey on pediatrics immunizationCitation35 (L4, L5). The remaining five statements were formulated for the purpose of the study (L2, L7, L8, L9, L10).
Construction of the mIMETER
To assess the HL of participants of Phase 1, we opted to use a customized version of IMETER (Italian Medical Term Recognition).Citation34 This version has been specifically adapted to investigate the vaccination-related aspects of HL. This tool consists of a single page with two columns of 70 terms, including 40 terms commonly used in the medical sector and 30 terms that resemble medical terms but are either made-up or non-medical words. We replaced some terms in the original version with terms collected from package leaflets of commonly used vaccines and antibiotic drugs, available online from the website of the Italian Medicines Agency.Citation36 To identify the most frequently repeated terms, we analyzed the package leaflet texts using NVivo software.Citation37 We then eliminated articles, prepositions, conjunctions, and non-health related terms to arrive at 40 medical words.
We ranked correct medical terms recognition in two ways: a total score, corresponding to the number of medical words recognized, and an adjusted total score, which is the difference between the number of words correctly recognized as medical terms and the number of words wrongly classified as such. Based on the adjusted score, we defined three health literacy levels: 0–20 = low, 21–34 = marginal, and 35–40 = functional HL.
Knowledge of vaccine-preventable diseases (KoVPDs)
In Phase 2, we assessed parents’ knowledge about three childhood Vaccine-Preventable Diseases (diphtheria, tetanus, and measles) with open-ended questions. For each disease, the interviewer had a list of items unknown to the respondent including signs, symptoms and complications. We awarded one point for each item they recognized. According to the definitions reported by WHO,Citation38–40 we assigned two points for the elements that represented the pathognomonic symptoms of the disease and two points for the remaining ones. We categorized participants into three levels of knowledge: items recognized < 3 as “No Knowledge”, ≥3 as “Sufficient Knowledge”, ≥5 as “Good Knowledge”. We also examined how the occupation (healthcare vs non-healthcare professional) could influence the participants’ scores.
Statistical analysis
We grouped variables such as age (<30, 30–34, 35–39, 40–44, 45–49, >49 years), occupation (health profession – including biologist, pharmaceutical chemist, pharmacist, physiotherapist, nurse, physician, dentist, veterinarian – vs non-health profession) and intention to vaccinate (those who answered having no intention to vaccinate their children or having intention to vaccinate only for some vaccines were considered as “hesitant parents”) for statistical analysis.
To estimate confidence in vaccination among parents, we used 10 Likert statements to calculate the VCI. We checked for “straight-liners” (respondents who give the same response on every answer option) and assessed the internal consistency of the “Likert statements panel” using Cronbach’s alpha test and McDonald’s omega total coefficient. We conducted Bartlett’s test of sphericity to determine the suitability of our data for Exploratory Factor Analysis (EFA) on the Likert construction, followed by an oblimin rotation to study the latent dimensions of our index. A Confirmatory Factor Analysis (CFA) was then performed to confirm the latent structure obtained from EFA. Simple and multiple linear regression analyses were conducted to identify any significant association between the latent factor identified by the CFA; we calculated each latent factor as the mean of the items which are included in the latent factor.
We evaluated whether our VCI could distinguish hesitant from confident parents, based on their intention to vaccinate in the future. In addition, we examined any demographic, social, or information sources that might be associated with lower or higher confidence in vaccination. We conducted Wilcoxon – Mann–Whitney tests or Kruskal – Wallis tests to test if the distributions of hesitant and confident populations were equal.
We assessed the internal consistency of mIMETER using Cronbach’s alpha test and McDonald’s omega total coefficient. We used Kendall’s tau rank correlation coefficient to quantify the association between mIMETER/KoVPDs and the VCI. We also used the Kruskal-Wallis tests to compare VCI values in the different mIMETER/KoVPDs score categories.
A backward stepwise procedure was used to delete the variable unrelated with our outcome (intention to vaccinate). Multiple univariate logistic regressions were performed to evaluate the association between the intention to vaccinate and the variables included in the stepwise procedure. Then, we performed a multivariate logistic regression including all the significant predictors from the univariate logistic regression.
We considered all the tests significant with a p-value < .05. All the analyses were generated using R version 4.1.2.
Results
Descriptive results
Demographic data
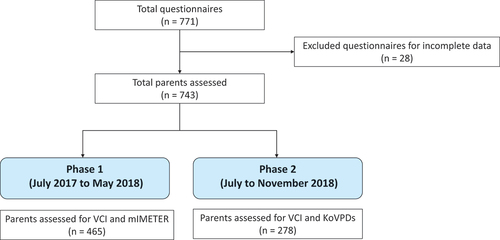
We collected a total of 771 responses for the study, but 28 were excluded due to incomplete data. Of the remaining 743, 465 were collected during Phase 1 while the remaining 278 were collected during Phase 2 ().
Figure 1. Time-flow diagram of the two phases of the study.
Among the 743 participants, the majority were female (601; 80.89%) with a median age of 40 years (IQR, 34–44) and a high school degree. Regarding the referred vaccination status, 677 (91.12%) declared to have vaccinated their child/children for all recommended vaccinations and 664 (89.37%) intended to follow the recommended schedule in the future. shows the participants’ features.
Table 1. Study population characteristics.
Likert-scale questions responses
Most participants (96.90% with a 7–10 Likert score for L2) considered vaccines important for children and effective (94.89% with a 7–10 Likert score for L3). They were also aware that vaccines contribute to herd immunity (89.89% with a 7–10 Likert score for L9). However, 42.13% (5–10 Likert score) of respondents agreed or were uncertain about whether the adverse effects of vaccines are kept hidden (L4). Most parents interviewed (80.59% with a 7–10 Likert score for L8) considered that mandatory vaccination was necessary, with support for its introduction at school age. Responses to L5 and L10 showed respectively that 32.70% (7–10 Likert score) thought children receive too many vaccinations at the same time, while 30.68% (7–10 Likert score) believed that pharmaceutical companies are motivated by profit. One in four respondents believed that vaccines expose their children to the risk of serious side effects (25.20% with 7–10 Likert score for L1), while 12.96% (7–10 Likert score) claimed that vaccines protect against minor or almost disappeared diseases (L6). Lastly, 29.88% of participants reported feeling anxious when vaccinating their children (L7) (see “S5: Likert description table” in Supplementary Material for all the percentages).
mIMETER results
In Phase 1, we used the mIMETER test for the health literacy assessment. The result of McDonald’s omega total coefficient (0.92) and Cronbach’s alpha standardized coefficient (0.90) showed a good internal consistency of the tool. Starting from this result, we assessed 465 participants (). Of these, 424 (91.18%) had a functional score, 34 (7.31%) had a marginal score, and 7 (1.51%) had a low score. When considering the adjusted score, 269 (57.85%) had a functional score, 177 (38.06%) had a marginal score, and 19 (4.09%) had a low score. For scores of each item, see “S6: “Single item score table and graphs with percentages of participants’ mIMETER scores” in Supplementary Material.
Knowledge of vaccine-preventable diseases
In Phase 2, we observed the vaccine-preventable diseases knowledge of a sample of 278 parents (). For tetanus, 234 (84.17%) had no knowledge of the disease, 19 (6.83%) had sufficient knowledge, and 25 (8.99%) had good knowledge. Diphtheria was the least known of the examined diseases: 266 (95.68%) had no knowledge of the disease, 8 (2.88%) had sufficient knowledge, and 4 (1.44%) had good knowledge. The most identified symptoms were those referable to measles: 49 (17.63%) had good knowledge, 137 (49.28%) had sufficient knowledge, and 92 (33.09%) had poor or no knowledge.
Using the Fisher test, we observed significantly higher knowledge scores in healthcare professionals for all three diseases (diphtheria p < .001, tetanus p < .001, measles p < .001). For individual scores of each item, refer to the “S7: “Single item KoVPD score table and graph with percentages of participants’ knowledge for VPDs” in Supplementary Material.
Validation of the vaccine confidence index
Factor analyses
Sampling adequacy tests indicated the suitability of the data for EFA as the Kaiser – Meyer–Olkin (KMO) measure of sampling adequacy was 0.86 and Bartlett’s test of sphericity was statistically significant (p < .001). The results from parallel analysis () using the Ordinary Least Squares (OLS) factoring method suggested the extraction of at least three factors from the dataset. EFA was run with models that had two, three, and four factors extracted with a loading cutoff of 0.4. Item 6 (“Vaccines protect against minor or almost disappeared diseases”) was excluded from factor analyses as its loadings were lower than 0.4 in all the EFAs performed. The 4-factors model included four items in the first factor, three in the second, and one each for the remaining two factors (respectively, we chose to name the factors as: “hesitancy” (L1, L4, L5, L10), “confidence” (L2, L3, L9), “anxiety” (L7) and “mandatory” (L8). The 2-factors model included five items in the “hesitancy” factor (L1, L4, L5, L7, L10), including “anxiety” presented in the previous model, and four items in the second factor (L2, L3, L8, L9), including the “mandatory.” The 3-factors model included four items for the first factor (L1, L4, L5, L10), four items in the second, including “mandatory” (L2, L3, L8, L9), and one item in the third, referring to “anxiety” (L7). Based on the fit indices and to avoid an overfitted model, we decided to use the 3-factors model.
Figure 2. Parallel analysis. The values reported on the x-axis represent the factor number to be included in the analysis while on the y-axis the values of eigenvalue.
For other details of factors loading for each model, refer to the “S8: “Exploratory Factor Analysis Results and Fit indices Table” in Supplementary Material.
CFA was performed for 3-factors 9-items versions of the scale and for three-dimensional solutions, showing an optimal goodness-of-fit (RMSEA = 0.055, CFI = 0.971, TLI = 0.958) ().
Figure 3. Confirmatory analysis with 3-factors solution and item allocation by factor.
The three-factor structure, consisting of a “confidence” part with four items, a “hesitancy” part with four items, and an “anxiety” part with one item showed the best psychometric characteristics of the VCI.
Internal consistency was good, as indicated by McDonald’s omega total coefficient (0.87) and Cronbach’s alpha standardized coefficient (0.82). shows a diagram of EFA, used in CFA, with standardized coefficients for hypothesized relations. Each item loaded significantly onto its designated factor and the correlations among the three factors were significant.
The standardized coefficients of each item and their 95% confidence interval were reported in .
Table 2. Confirmatory factor analysis standardized coefficient weights for 9-item scale.
Variables associated with vaccine “confidence” and “hesitancy”
Using regression analysis, we identified some variables that were statistically linked to participants’ answers to the clustered “Confidence” (items L2, L3, L8, L9) and “Hesitancy” (items L1, L4, L5, L10) (). For VCI Factor 1 (Confidence), we found that respondents who had vaccinated their children for all scheduled vaccinations were more confident than those who had not vaccinated or only partially vaccinated their children. Additionally, those who used the Internet (we considered the Internet as the results of searches made through search engines such as Google, etc.) and social media networks (we considered the social media network the social networking online platforms such as Facebook, Twitter, etc.) as their primary source of information about vaccines showed lower confidence than those who did not use these sources for this purpose. In addition, parents with higher levels of education showed less hesitation than others. The factor “Confidence” showed no significant association with gender, age, education, occupation and number of children. Regarding VCI Factor 2 (Hesitancy), we found that participants with a bachelor’s degree or higher have lower levels of hesitancy compared to the others; moreover, healthcare workers are less hesitant than non-healthcare workers. Regarding the main source of information, participants who used the internet and social networks were more hesitant than the others, while those who used health institutions were less hesitant than the others.
Table 3. Association between parents features and factors “confidence” and “hesitancy”.
Vaccine confidence index
After conducting confirmatory factor analysis, we removed L6 (“Vaccines protect against minor or almost disappeared diseases”) and excluded some items that could be ambiguous: L1 (“Vaccines expose your children to the risk of serious side effects”) is open to interpretation, as parents can be concerned about serious side effects like allergic reactions; L7 (“It causes you anxiety to get your child vaccinated”) investigates the anxiety associated with vaccination, which can vary widely among people and can be high despite being favorable to vaccination; L8 (“You support the introduction of mandatory vaccination to attend schools”) assesses patient favorability of mandatory vaccination, but we are not sure if it can indicate confidence in vaccination as some may not want this requirement despite being confident in vaccination.
Therefore, we used only six questions to calculate the index:
As shown in the formula, the numerator was composed of the sum of the Likert scores assigned to statements with a positive meaning (where a higher value indicates a greater propensity for vaccination), while the denominator contained the sum of the Likert scores assigned to statements with a negative meaning (where a higher value indicates a lower propensity for vaccination).
Association between VCI and other variables
VCI, health literacy and KoVPDs
Applying Kendall’s tau rank, we observed that the relation between VCI and mIMETER p score was not statistically significant and the correlation between the two variables was weak. (tau = 0.03, p = .419). After the measurement of the adjusted score of mIMETER, the correlation was still non-significant (tau = −0.04, p = .272).
Furthermore, we analyzed the association between VCI and KoVPDs and found that there was a near-significant difference between the VCI score of each level of knowledge of diphtheria (p-value = .048) and significant difference between the VCI score of each group of knowledge of measles (p = .039), while there was no significant difference in VCI score and tetanus knowledge (p-value = .123). In particular, the comparison between “No Knowledge” and “Sufficient Knowledge” of measles was not significant (p = .52), as well as between “Sufficient Knowledge” and “Good Knowledge” (p = .36), while a significant difference was observed only between “No Knowledge” and “Good Knowledge” (p = .03). Regarding the comparison between each group of diphtheria knowledge, no significant differences were observed.
VCI and parents’ characteristics
The VCI varied significantly across different individual items. Our results (see ) show a difference by parental gender with women being more confident (Median VCI Female = 2.73 vs Male = 2.16). No significant differences were found within age groups (p = .275).
Table 4. Association between VCI and parents’ characteristics.
The analysis carried out on the level of education showed that graduates had a significantly higher VCI than the other levels represented (3.88 vs 2.00 and 2.43-). Healthcare workers showed higher vaccination confidence than non-health workers (5.80 vs. 2.50) as did those who had vaccinated their children in the past compared to those who had not or only partially vaccinated their children (2.73 vs. 1.88 and 1.18.
Additionally, a significant difference in the VCI was found according to the use or nonuse of the sources of vaccine information analyzed, such as TV network (No = 2.73 vs. Yes = 1.87), internet (No = 3.00 vs. Yes = 1.87), social media networks (No = 2.73 vs. Yes = 1.67), general practitioner (No = 2.00 vs. Yes = 2.73) and health institutions (No = 2.50 vs. Yes = 3.33).
Results from the univariate logistic regression and the multivariate model for the association between the intention to vaccinate, the VCI and sample features
The variables included, according to the backward stepwise procedure, were VCI, and three main sources of information: internet, social media networks and health institutions. The outcome of interest was the intention to vaccinate. Our model showed that a higher VCI and using health institutions as the main source of information were associated with an increase in intention to vaccinate while using Internet and social media networks were associated with a reduction in intention to vaccinate (). All the variables were significant both in the univariate and multivariate models.
Table 5. Univariate logistic regression and multivariate logistic regression results between the intention to vaccinate (outcome, 1 = “willing to vaccinate”) and vaccine confidence index (VCI) and social media networks, internet and health institutions as main sources of information.
Regarding the association between the intention to vaccinate and the mIMETER score and categories and the KoVPD, no statistically significant association was found.
Discussion
Vaccine hesitancy is a concerning matter in our current historical and social context. The decline in vaccination coverage detected in 2016 highlights the importance and relevance of the issue. Subsequent surveys have shown that VH is a dynamic concept that changes not only between countries but also between different vaccines and historical periods. For example, the survey conducted in the EU in 2018 revealed a shift in overall confidence in vaccines among all 28 member states. Some countries – including Italy – became more confident in the safety of vaccinations, while others (like the Czech Republic, Finland, Poland, and Sweden) showed decreased confidence.Citation41 The recent COVID-19 pandemic has highlighted the analysis of determinants leading to vaccine hesitancy, despite the tangible evidence of the consequences of SARS-CoV-2 infection.Citation42 Extensive debates encompassing COVID-19 vaccination have resulted in a growing polarization of public opinion in several countries.Citation43 This led to the dramatic stance of some extremist political groups that, using an ever-increasing consensus, questioned the safety of the preventive measure, making use of very pervasive and widespread dissemination networks.Citation44 Social media networks and web pages have indeed fueled misinformation, often supporting inaccurate, unsubstantiated or misleading arguments to discredit the safety and effectiveness of vaccination.Citation45,Citation46 Unfortunately, the infodemic generated during the pandemic has challenged official communication channels and encouraged the proliferation of untruthful sources.Citation47 For individuals who do not know how to check the reliability of sources, identifying trustworthy information can be a challenge. Consequently, they may be at risk of having a distorted and unclear understanding of specific issues.Citation48 In addition, a confirmation bias mechanism emerges, whereby individuals exhibit a propensity to choose information consistent with their beliefs, irrespective of its accuracy.Citation49 All of these factors, in conjunction with other cognitive biases, pose a risk of spreading to other forms of vaccination, including those intended for childhood use.Citation50 Although there was an increase in coverage in 2021, it has not yet reached the pre-pandemic levels.Citation51
Regional data in Italy indicated a decline in vaccination coverage at 24 months during 2020 compared to the pre-pandemic period.Citation17 The significant drop in childhood vaccination coverage during the same period is linked to the national health system’s efforts to contain the pandemic (through contact tracing and healthcare professionals entirely dedicated to COVID-19) and the decrease of prevention services in the area to limit the spread of infection.Citation16,Citation52 Therefore, it is necessary to investigate the factors that prompted the population to shift from a gradual increase in vaccination coverage since 2017 (following the mandatory vaccination) to a decline.Citation18 Thus, there is a need for new tools to analyze vaccine hesitancy from many perspectives, starting with the analysis of hoaxes, trust in health institutions, risk perception of VPDs and related vaccinations.
The scientific literature proposed several tools for measuring VH, such as Parent Attitudes about Childhood Vaccines Survey, Vaccine Confidence Scale, Global Vaccine Confidence Index and Vaccine Hesitancy Scale (VHS).Citation53 Tools to assess vaccine hesitancy have also been refined in the COVID-19 context.Citation54 However, further studies will be needed to make these tools applicable in more generalized contexts.
On the other hand, health literacy tests are available (such as “Test of Functional HL in Adults” or TOFHLA and the shortened version S-TOFHLA, and the “Rapid Estimate of Adult Literacy in Medicine” or REALM). However, these have practical limitations, such as the long time required for the compilation or not being self-administrable. To address this problem, a short and self-administered measure of HL, the METER,Citation55 was introduced. Its Italian adaptation (IMETER) was successfully used to screen low HL levels in the population.Citation34
This study proposed two new Italian-language tools to assess hesitancy toward VPDs and health literacy by evaluating internal consistency and construct validity. Additionally, as suggested by previous studies on similar target populations in other contexts,Citation56–60 this study analyzed a sample of Tuscan parents, measuring their confidence in childhood vaccinations. Other international tools have provided methods for measuring parental hesitancy about childhood vaccination. For example, the validated 3-factors/8-items tool proposed by Gilkey et al.Citation61 assessed a sample of 9,623 parents belonging to the “National Immunisation Survey” promoted by the Centers for Disease Control and Prevention (CDC).Citation61 This study showed confidence was generally high, but special attention was required for populations with different ethnic groups and low education. The study by Luyten et al.Citation57 used an adapted 10-item Vaccine Hesitancy Scale (VHS),Citation22 revealing the association between participant characteristics and vaccination hesitancy.Citation57
Our study offered an Italian-validated 6-items Vaccine Confidence Index to investigate vaccine attitudes. Exploratory and Confirmatory factor analysis showed that the scale fits the data better when divided into three factors assessing vaccination confidence, hesitancy, and anxiety generated by the intervention. Cronbach’s α and McDonald’s omega coefficient analysis showed good internal consistency and construct validity.
The conducted regressions showed an association between some variables with the factors ‘Confidence’ and ‘Hesitancy.’ In addition to differences in parents who decided to vaccinate their children or not, educational level was found to influence vaccination decisions, with higher education being associated with better health outcomes, including vaccination practice.Citation56,Citation61,Citation62 However, as reported by MacDonald et al.Citation2 vaccination determinants such as education did not influence hesitation in only one directionCitation2: higher education may not always lead to higher vaccine acceptance as it can be associated with both lower and higher levels of acceptance.Citation63 Our study revealed that higher parental education was linked to lower vaccination hesitancy.
The use of the internet and social networks as sources of information on vaccines was identified as another variable that influences “Confidence” and “Hesitancy.” In addition to the websites and social profiles of health organizations, unverified information with unknown or false sources is often added to the usable content,Citation64–66 which explains why those who have a greater preference for information from the web had a higher level of hesitancy and a lower level of confidence, as shown in our data.
Using factor analyses, we constructed a formula that measures the vaccine confidence index in numerical value and compared this index with the variables investigated in the questionnaire. We observed that the VCI was significantly higher within subpopulations subdivided by each variable. In addition to education and the use of social networks/internet, a higher VCI was reported in women, in younger individuals compared to parents over 50 years old, and those who used doctors and health institutions as their main source of information. This result was in line with the large multinational study by de Figueiredo et al. (2020) which showed that women, young people, and those who trust health institutions were more compliant with vaccination acceptance.Citation67
Although the revised mIMETER showed good internal consistency, our analysis found no association between VH and the three proposed levels of HL. This was consistent with previous research summarized by Lorini et al.Citation31 which suggests that vaccine acceptance is influenced by many social determinants, not just HL levels.Citation31 Our study indicated that having specific health literacy on medical terminology or health education on VPDs may not increase confidence in vaccination.
Instead, we investigated how KoVPDs affected VCI. Our questionnaire, using open-ended questions, aimed to determine the KoVPDs in our study population. The analyses showed that healthcare professionals had much wider knowledge of the definitions of the analyzed diseases compared to the remaining respondents, who had low or no knowledge. Assessing the difference in median VCI among these two populations, we observed that healthcare professionals had a higher VCI. However, it was not possible to attribute a higher level of VCI to higher KoVPDs. Despite important differences within the category, we know that healthcare workers are more responsive to prevention through vaccination.Citation68 Our sample did not provide enough respondents with good KoVPDs to conduct a statistical analysis comparing them with those who had low KoVPDs to determine if awareness of VPDs could influence vaccination choice. This endpoint, along with the opportunistic sample selection (parents in pediatric clinics), remains a limitation of the study.
Further studies are needed to determine whether including information on VPDs in communication strategies is effective in influencing vaccination choice. While the tools used in our study were effective in measuring VH, they did not capture all the factors that contribute to this phenomenon. For instance, cognitive biases and individual psychological profiles are important factors that should be considered in the design of communication strategies, as noted by Casigliani et al.Citation50 This new perspective must be closely evaluated and included in future studies on vaccine hesitancy.
Conclusion
Our study developed two different tools for assessing vaccine confidence and health literacy. The VCI was constructed using factor analysis from 10 items measured on a Likert scale, resulting in a 6-item index. Health literacy was evaluated using the mIMETER, which demonstrated good internal consistency. A Tuscan parent’s sample was assessed with these tools. The findings indicated a reduction in vaccination intentions with the use of the Internet and social networks and an increase in information from health institutions. Furthermore, a higher VCI was associated with an increase in vaccination intentions among the population. There was no statistically significant relation between vaccination intention and the mIMETER score and KoVPD categories. In light of these results, the VCI can be used for public health purposes to target vaccination campaigns to hesitant subgroups of the population. The mIMETER tool can be utilized to evaluate health literacy, though we discovered no association with vaccination intention in our research.
Supplemental Material
Download PDF (1.9 MB)Acknowledgments
Thanks to the pediatric clinic “Accademia” in Livorno, to the hospital outpatient clinics in Pisa and Viareggio for allowing the completion of data collection for the study.
Disclosure statement
No potential conflict of interest was reported by the author(s).
Supplementary data
Supplemental data for this article can be accessed on the publisher’s website at https://doi.org/10.1080/21645515.2023.2271765.
Additional information
Funding
References
- Pollard AJ, Bijker EM. A guide to vaccinology: from basic principles to new developments. Nat Rev Immunol [Internet]. 2020 [accessed 2023 Apr 19];21:83–12. doi:10.1038/s41577-020-00479-7.
- MacDonald NE, Eskola J, Liang X, Chaudhuri M, Dube E, Gellin B, Goldstein S, Larson H, Manzo ML, Reingold A, et al. Vaccine hesitancy: definition, scope and determinants. Vaccine. 2015 [accessed 2022 Feb 28];33:4161–4. doi:10.1016/j.vaccine.2015.04.036.
- Bonanni P, Villani A, Scotti S, Biasci P, Russo R, Maio T, Vitali Rosati G, Moscadelli A, Conforti G, Azzari C, et al. The recommended lifetime immunization schedule from the board of vaccination calendar for life in Italy: a continuing example of impact on public health policies. Vaccine. 2021 [accessed 2023 Apr 19];39(8):1183–6. doi:10.1016/j.vaccine.2021.01.019.
- Ministero della Salute. Il calendario vaccinale del Piano Nazionale di Prevenzione Vaccinale [Internet]. 2017 [accessed 2023 Apr 19]. https://www.salute.gov.it/portale/vaccinazioni/dettaglioContenutiVaccinazioni.jsp?area=vaccinazioni&id=5501&lingua=english&menu=vuoto.
- Ministero della Salute. Vaccinazioni dell’età pediatrica. Anno 2016 (coorte 2014) Coperture vaccinali a 24 mesi (per 100 abitanti), calcolate sui riepiloghi inviati dalle Regioni e PP.AA. (per singolo antigene) [Internet]. 2016 [accessed 2023 Feb 19]. https://www.salute.gov.it/imgs/C_17_tavole_20_allegati_iitemAllegati_0_fileAllegati_itemFile_5_file.pdf.
- Ministero della salute. Dati coperture vaccinali [Internet]. [accessed 2022 Feb 28]. http://www.salute.gov.it/portale/vaccinazioni/dettaglioContenutiVaccinazioni.jsp?lingua=italiano&id=811&area=vaccinazioni&menu=vuoto.
- Larson HJ, de Figueiredo A, Xiahong Z, Schulz WS, Verger P, Johnston IG, Cook AR, Jones NS. The state of vaccine confidence 2016: global insights through a 67-country survey. EBioMedicine. 2016;12:295–301. doi:10.1016/j.ebiom.2016.08.042.
- Ministero della Salute. Legge di conversione 31 luglio 2017, n. 119 [Internet]. 2017 [accessed 2022 Feb 28]. https://www.trovanorme.salute.gov.it/norme/dettaglioAtto?id=60201.
- Paolo D’Ancona F, D’amario C, Maraglino F, Rezza G, Iannazzo S. The law on compulsory vaccination in Italy: an update 2 years after the introduction. Eurosurveillance [Internet]. 2019 [accessed 2023 Apr 19];24:1. doi:10.2807/1560-7917.ES.2019.24.26.1900371.
- Casula M, Toth F. The 2017 Italian reform on mandatory childhood vaccinations: analysis of the policy process and early implementation. Health Policy (New York). 2021;125(1):7–11. doi:10.1016/j.healthpol.2020.11.004.
- Tavoschi L, Quattrone F, De Vita E, Lopalco PL. Impact of mandatory law on vaccine hesitancy spectrum: the case of measles vaccine catch-up activities in Tuscany, Italy. Vaccine. 2019 [accessed 2023 Apr 19];37(49):7201–2. doi:10.1016/j.vaccine.2019.09.092.
- Ministero della Salute. Vaccinazioni dell’età pediatrica. Anno 2018 (coorte 2016) Coperture vaccinali a 24 mesi (per 100 abitanti), calcolate sui riepiloghi inviati dalle Regioni e PP.AA. (per singolo antigene). 2019 [accessed 2023 Sep 11]. https://www.salute.gov.it/imgs/C_17_tavole_20_allegati_iitemAllegati_0_fileAllegati_itemFile_7_file.pdf.
- Ministero della Salute. Vaccinazioni dell’età pediatrica. Anno 2019 (coorte 2017) Coperture vaccinali a 24 mesi (per 100 abitanti), calcolate sui riepiloghi inviati dalle Regioni e PP.AA. (per singolo antigene). 2020 [accessed 2023 Sep 11]. https://www.salute.gov.it/imgs/C_17_tavole_20_8_1_file.pdf.
- World Health Organization. Global measles and rubella strategic plan: 2012–2020 [Internet]. 2012 [accessed 2022 Feb 28]. https://www.who.int/publications/i/item/9789241503396.
- Istituto Superiore di Sanità. National integrated measles-rubella surveillance system. Measles In Italy: Weekly Bullettin. (W30) [Internet]. 2017 July 24-30 [accessed 2022 Feb 28]. https://www.epicentro.iss.it/morbillo/bollettino/Measles_WeeklyReport_N6eng.pdf.
- Ministero della Salute. Le coperture vaccinali dell’età pediatrica e dell’adolescente - Commento ai dati aggiornati al 31 dicembre 2020. 2021. [accessed 2023 Sep 11]. https://www.salute.gov.it/imgs/C_17_tavole_20_9_7_file.pdf.
- Ministero della Salute. Vaccinazioni dell’età pediatrica. Anno 2020 (coorte 2018) Coperture vaccinali a 24 mesi (per 100 abitanti), calcolate sui riepiloghi inviati dalle Regioni e PP.AA. (per singolo antigene). [accessed 2023 Sep 11]. https://www.salute.gov.it/imgs/C_17_tavole_20_9_0_file.pdf.
- Sabbatucci M, Odone A, Signorelli C, Siddu A, Silenzi A, Maraglino FP, Rezza G. Childhood immunisation coverage during the COVID-19 epidemic in Italy. Vaccines [Internet]. 2022 [accessed 2023 Sept 11];10:120. doi:10.3390/vaccines10010120.
- Fernandez M, Matta G, Paiva E. COVID-19, vaccine hesitancy and child vaccination: challenges from Brazil. Lancet Reg Heal - Am [Internet]. 2022 [accessed 2023 Sept 11];8:100246. doi:10.1016/j.lana.2022.100246.
- He K, Mack WJ, Neely M, Lewis L, Anand V. Parental perspectives on immunizations: impact of the COVID-19 pandemic on childhood vaccine hesitancy. J Community Health [Internet]. 2022 [accessed 2023 Sept 11];47(1):39–52. doi:10.1007/s10900-021-01017-9.
- Shwethashree M, Vanmathi A, Amoghashree S, Narayanamurthy MR, Gopi A. Did this pandemic trigger a spike in mothers′ hesitancy over their children’s routine immunizations? -A cross sectional study. Clin Epidemiol Glob Heal. 2022;15:101023. doi:10.1016/j.cegh.2022.101023.
- Larson HJ, Jarrett C, Schulz WS, Chaudhuri M, Zhou Y, Dube E, Schuster M, MacDonald NE, Wilson R, Eskola J, et al. Measuring vaccine hesitancy: the development of a survey tool. Vaccine. 2015;33:4165–75. doi:10.1016/j.vaccine.2015.04.037.
- World Health Organization. Report of the sage working group on vaccine hesitancy [Internet]. 2014 [accessed 2022 Feb 28]. https://www.who.int/immunization/sage/meetings/2014/october/1_Report_WORKING_GROUP_vaccine_hesitancy_final.pdf.
- Betsch C, Schmid P, Heinemeier D, Korn L, Holtmann C, Böhm R, Angelillo IF. Beyond confidence: development of a measure assessing the 5C psychological antecedents of vaccination. PloS One. 2018;13:e0208601. doi:10.1371/journal.pone.0208601.
- Ratzan SC. Health literacy: communication for the public good. Health Promot Int. 2001;16(2):207–14. doi:10.1093/heapro/16.2.207.
- Castro-Sánchez E, Chang PWS, Vila-Candel R, Escobedo AA, Holmes AH. Health literacy and infectious diseases: why does it matter? Int J Infect Dis. 2016;43:103–10. doi:10.1016/j.ijid.2015.12.019.
- Barry MM, D’Eath M, Sixsmith J. Interventions for improving population health literacy: insights from a rapid review of the evidence. J Health Commun. 2013;18(12):1507–22. doi:10.1080/10810730.2013.840699.
- Magon A, Arrigoni C, Graffigna G, Barello S, Moia M, Palareti G, Caruso R. The effect of health literacy on vaccine hesitancy among Italian anticoagulated population during COVID-19 pandemic: the moderating role of health engagement. Hum Vaccines Immunother [Internet]. 2021 [accessed 2023 Sept 11];17:5007–12. doi:10.1080/21645515.2021.1984123.
- Feinberg I, Scott JY, Holland DP, Lyn R, Scott LC, Maloney KM, Rothenberg R. The relationship between health literacy and COVID-19 vaccination prevalence during a rapidly evolving pandemic and infodemic. Vaccines. 2022 [accessed 2023 Sept 14];10(12):1989. doi:10.3390/vaccines10121989.
- Zhang H, Li Y, Peng S, Jiang Y, Jin H, Zhang F. The effect of health literacy on COVID-19 vaccine hesitancy among community population in China: the moderating role of stress. Vaccine. 2022;40(32):4473–8. doi:10.1016/j.vaccine.2022.06.015.
- Lorini C, Santomauro F, Donzellini M, Capecchi L, Bechini A, Boccalini S, Bonanni P, Bonaccorsi G. Health literacy and vaccination: a systematic review. Hum Vaccines Immunother. 2018;14:478–88. doi:10.1080/21645515.2017.1392423.
- Kata A. A postmodern Pandora’s box: anti-vaccination misinformation on the Internet. Vaccine. 2010;28:1709–16. doi:10.1016/j.vaccine.2009.12.022.
- Rosselli R, Martini M, Bragazzi NL. The old and the new: vaccine hesitancy in the era of the web 2.0. Challenges and opportunities. J Prev Med Hyg. 2016;57:E47–50. https://www.ncbi.nlm.nih.gov/pmc/articles/PMC4910443/pdf/2421-4248-57-E47.pdf.
- Biasio LR, Corbellini G, D’Alessandro D. An Italian validation of “METER”, an easy-to-use health literacy (HL) screener. Ann di Ig Med Prev e di Comunita. 2017;29:171–8. doi:10.7416/ai.2017.2144.
- Azienda ULSS 20 V– RV. Indagine sui Determinanti del Rifiuto dell’Offerta Vaccinale nella Regione Veneto [Internet]. 2012 [accessed 2022 Feb 28]. https://www.epicentro.iss.it/vaccini/pdf/Ulss20Verona_04-2012ReportDeterminantiRifiutoVaccinale.pdf.
- AIFA. Agenzia Italina del Farmaco. https://www.aifa.gov.it/.
- QSR International. Nvivo [Internet]. [accessed 2022 Feb 28]. https://www.qsrinternational.com/nvivo-qualitative-data-analysis-software/home.
- World Health Organization. Diphtheria [Internet]. 2018 [accessed 2022 Feb 28]. https://www.who.int/immunization/monitoring_surveillance/burden/vpd/WHO_SurveillanceVaccinePreventable_04_Diphtheria_R2.pdf.
- World Health Organization. Tetanus [Internet]. [accessed 2022 Feb 28]. https://www.who.int/health-topics/tetanus#tab=tab_1.
- World Health Organization. Measles. [accessed 2022 Feb 28]. https://www.who.int/health-topics/measles#tab=tab_1.
- Larson H, de Figueiredo A, Karafllakis E. State of vaccine confidence in the EU and the UK (2020) [Internet]. 2020 [accessed 2022 Feb 28]. https://ec.europa.eu/health/system/files/2020-12/2020_confidence_rep_en_0.pdf.
- Razai MS, Chaudhry UAR, Doerholt K, Bauld L, Majeed A. Covid-19 vaccination hesitancy. BMJ. 2021;373:n1138. doi:10.1136/bmj.n1138.
- Jungkunz S. Political polarization during the COVID-19 pandemic. Front Polit Sci. 2021;3:622512. doi:10.3389/fpos.2021.622512.
- Krieger N, Testa C, Chen JT, Hanage WP, McGregor AJ. Relationship of political ideology of US federal and state elected officials and key COVID pandemic outcomes following vaccine rollout to adults: April 2021–March 2022. Lancet Reg Heal - Am [Internet]. 2022 [accessed 2023 Sept 13];16:100384. doi:10.1016/j.lana.2022.100384.
- Puri N, Coomes EA, Haghbayan H, Gunaratne K. Social media and vaccine hesitancy: new updates for the era of COVID-19 and globalized infectious diseases. Hum Vaccin Immunother [Internet]. 2020 [accessed 2023 Sept 13];16:2586–93. doi:10.1080/2164551520201780846.
- Meel P, Vishwakarma DK. Fake news, rumor, information pollution in social media and web: a contemporary survey of state-of-the-arts, challenges and opportunities. Expert Syst Appl. 2020;153:112986. doi:10.1016/j.eswa.2019.112986.
- Pian W, Chi J, Ma F. The causes, impacts and countermeasures of COVID-19 “infodemic”: a systematic review using narrative synthesis. Inf Process Manag. 2021;58(6):102713. doi:10.1016/j.ipm.2021.102713.
- Ecker UKH, Lewandowsky S, Cook J, Schmid P, Fazio LK, Brashier N, Kendeou P, Vraga EK, Amazeen MA. The psychological drivers of misinformation belief and its resistance to correction. Nat Rev Psychol [Internet]. 2022 [accessed 2023 Sept 13];1:13–29. doi:10.1038/s44159-021-00006-y.
- Azarpanah H, Farhadloo M, Vahidov R, Pilote L. Vaccine hesitancy: evidence from an adverse events following immunization database, and the role of cognitive biases. BMC Public Health [Internet]. 2021 [accessed 2023 Sept 14];21:1–13. doi:10.1186/s12889-021-11745-1.
- Casigliani V, Menicagli D, Fornili M, Lippi V, Chinelli A, Stacchini L, Arzilli G, Scardina G, Baglietto L, Lopalco P, et al. Vaccine hesitancy and cognitive biases: evidence for tailored communication with parents. Vaccine X [Internet]. 2022 [accessed 2022 Aug 29];11:100191. doi:10.1016/j.jvacx.2022.100191.
- Ministero della Salute. Vaccinazioni dell’età pediatrica. Anno 2021 (coorte 2019)Coperture vaccinali a 24 mesi (per 100 abitanti), calcolate sui riepiloghi inviati dalle Regioni e PP.AA. (per singolo antigene). 2022.
- Ghaznavi C, Eguchi A, Suu Lwin K, Yoneoka D, Tanoue Y, Kumar Rauniyar S, Horiuchi S, Hashizume M, Nomura S. Estimating global changes in routine childhood vaccination coverage during the COVID-19 pandemic, 2020–2021. Vaccine. 2023;41(28):4151–7. doi:10.1016/j.vaccine.2023.05.034.
- Oduwole EO, Pienaar ED, Mahomed H, Wiysonge CS. Current tools available for investigating vaccine hesitancy: a scoping review protocol. BMJ Open. 2019;9(12):e033245. doi:10.1136/bmjopen-2019-033245.
- Lazarus JV, Wyka K, White TM, Picchio CA, Gostin LO, Larson HJ, Rabin K, Ratzan SC, Kamarulzaman A, El-Mohandes A. A survey of COVID-19 vaccine acceptance across 23 countries in 2022. Nat Med [Internet]. 2023 [accessed 2023 Sept 14];29:366–75. doi:10.1038/s41591-022-02185-4.
- Rawson KA, Gunstad J, Hughes J, Spitznagel MB, Potter V, Waechter D, Rosneck J. The METER: a brief, self-administered measure of health literacy. J Gen Intern Med. 2010;25:67–71. doi:10.1007/s11606-009-1158-7.
- Lee CHJ, Sibley CG. Attitudes toward vaccinations are becoming more polarized in New Zealand: findings from a longitudinal survey. EClinicalMedicine [Internet]. 2020 [accessed 2022 Feb 28];23:100387. doi:10.1016/j.eclinm.2020.100387.
- Luyten J, Bruyneel L, van Hoek AJ. Assessing vaccine hesitancy in the UK population using a generalized vaccine hesitancy survey instrument. Vaccine. 2019;37(18):2494–501. doi:10.1016/j.vaccine.2019.03.041.
- Opel DJ, Taylor JA, Mangione-Smith R, Solomon C, Zhao C, Catz S, Martin D. Validity and reliability of a survey to identify vaccine-hesitant parents. Vaccine. 2011;29(38):6598–605. doi:10.1016/j.vaccine.2011.06.115.
- Wallace AS, Wannemuehler K, Bonsu G, Wardle M, Nyaku M, Amponsah-Achiano K, Dadzie JF, Sarpong FO, Orenstein WA, Rosenberg ES, et al. Development of a valid and reliable scale to assess parents’ beliefs and attitudes about childhood vaccines and their association with vaccination uptake and delay in Ghana. Vaccine. 2019;37(6):848–56. doi:10.1016/j.vaccine.2018.12.055.
- Frew PM, Murden R, Mehta CC, Chamberlain AT, Hinman AR, Nowak G, Mendel J, Aikin A, Randall LA, Hargreaves AL, et al. Development of a US trust measure to assess and monitor parental confidence in the vaccine system. Vaccine. 2019;37(2):325–32. doi:10.1016/j.vaccine.2018.09.043.
- Gilkey MB, Magnus BE, Reiter PL, McRee AL, Dempsey AF, Brewer NT. The vaccination confidence scale: a brief measure of parents’ vaccination beliefs. Vaccine. 2014;32(47):6259–65. doi:10.1016/j.vaccine.2014.09.007.
- World Health Organization. Review of social determinants and the health divide in the WHOEuropean Region: final report [Internet]. 2014 [accessed 2022 Feb 28]. https://www.euro.who.int/__data/assets/pdf_file/0004/251878/Review-of-social-determinants-and-the-health-divide-in-the-WHO-European-Region-FINAL-REPORT.pdf.
- Larson HJ, Jarrett C, Eckersberger E, Smith DMD, Paterson P. Understanding vaccine hesitancy around vaccines and vaccination from a global perspective: a systematic review of published literature, 2007-2012. Vaccine. 2014;32:2150–9. doi:10.1016/j.vaccine.2014.01.081.
- Stahl JP, Cohen R, Denis F, Gaudelus J, Martinot A, Lery T, Lepetit H. The impact of the web and social networks on vaccination. New challenges and opportunities offered to fight against vaccine hesitancy. Médecine Mal Infect. 2016;46:117–22. doi:10.1016/j.medmal.2016.02.002.
- Anti-Vaccine Activists KA. Web 2.0, and the postmodern paradigm – an overview of tactics and tropes used online by the anti-vaccination movement. Vaccine. 2012;30:3778–89. doi:10.1016/j.vaccine.2011.11.112.
- Betsch C, Brewer NT, Brocard P, Davies P, Gaissmaier W, Haase N, Leask J, Renkewitz F, Renner B, Reyna VF, et al. Opportunities and challenges of web 2.0 for vaccination decisions. Vaccine. 2012;30(25):3727–33. doi:10.1016/j.vaccine.2012.02.025.
- de Figueiredo A, Simas C, Karafillakis E, Paterson P, Larson HJ. Mapping global trends in vaccine confidence and investigating barriers to vaccine uptake: a large-scale retrospective temporal modelling study. Lancet. 2020;396(10255):898–908. doi:10.1016/S0140-6736(20)31558-0.
- Paterson P, Meurice F, Stanberry LR, Glismann S, Rosenthal SL, Larson HJ. Vaccine hesitancy and healthcare providers. Vaccine. 2016;34(52):6700–6. doi:10.1016/j.vaccine.2016.10.042.