
ABSTRACT
The severe acute respiratory syndrome coronavirus 2 (SARS-CoV-2) vaccination service system lacks standardized indicators to assess resource allocation. Moreover, data on specific vaccination-promoting measures is limited. This study aimed to evaluate vaccination accessibility and capacity and investigate convenience-related factors in China during the Omicron variant epidemic. We collected information on SARS-CoV-2 vaccination services among vaccination sites in Beijing. Analysis was performed using nearest neighbor, Ripley’s K, hot spot analysis, and generalized estimating equations. Overall, 299 vaccination sites were included. The demand for the SARS-CoV-2 vaccine increased with the increase in daily new cases, and the number of staff administering vaccines should be increased in urban areas at the beginning of the epidemic. Providing vaccination for both children and adults, extending vaccination service hours, and offering a wider range of vaccine categories significantly increased the doses of vaccines administered (all P < .05). The provision of mobile vaccination vehicles effectively increased the doses of vaccines administered to individuals aged ≥ 60 years (P < .05). The allocation of SARS-CoV-2 vaccination services should be adjusted according to geographic location, population size, and vaccination demands. Simultaneous provision of vaccination services for children and their guardians, flexible service hours, prompt innovative vaccine production, and tailored vaccination strategies can foster vaccination uptake.
Introduction
Scientific and precise preventive and control measures can effectively curtail the spread of severe acute respiratory syndrome coronavirus 2 (SARS-CoV-2). China maintained low infection and mortality rates until October 2022.Citation1 However, new variants have shown increased transmissibility and immune evasion.Citation2 From December 9, 2022, when the Omicron variant was predominant, the SARS-CoV-2-positive rate in China showed an upward trend, reaching its peak on December 22, 2022 and declining to its lowest level on January 23, 2023.Citation3 During this Omicron surge, including our study period, severe illness occurred mainly in high-risk populations, including people with comorbidities and the older adults.Citation4,Citation5 Due to the epidemic characteristics, economic conditions, and normal social circumstances, China gradually eased its preventive and control measures and vigorously promoted vaccination among high-risk individuals.Citation6,Citation7
Vaccination is effective for preventing severe illness and mortality in individuals infected with SARS-CoV-2 and enhancing the immunity of those previously infected.Citation8–11 In China, the SARS-CoV-2 vaccination campaign involved multiple stages, with ongoing adjustments to strategies and procedures. The initial stage involved the vaccination of high-priority individuals aged 18–59 years with high exposure risk in December 2020, followed by mass vaccination of individuals in this age range in February 2021.Citation12 The third stage of the campaign commenced in July 2021, targeting individuals aged ≥60 years and children aged 3–17 years.Citation13 The fourth phase involved the administration of the first booster to individuals aged ≥18 years and the second booster to high-priority groups in October 2021 and December 2022, respectively.Citation14 In April 2023, vaccination of infected individuals was initiated. The focus was to increase the proportion of vaccinated individuals among high-priority populations and to mitigate the immunity gap across diverse groups.
In a large-scale vaccination campaign, reasonable allocation of vaccination services is important and can provide information for future resource allocation.Citation15 Additionally, an online survey documented that approximately 82% of the Chinese population was infected with SARS-CoV-2 during the study period.Citation16 The changes in vaccination demand before and after an epidemic should be considered when allocating services. In addition, enhancing the convenience of vaccination services is a feasible way to improve coverage.Citation17 However, research on the efficacy of specific interventions is limited. Therefore, the evaluation of the spatial and temporal aspects of vaccination allocation and exploration of specific measures to improve the convenience of vaccination services are crucial.
The primary objective of this study was to assess vaccination resource allocation and explore the association of convenience-related factors with vaccine uptake. This research ultimately aimed to provide recommendations for establishing a SARS-CoV-2 vaccination service strategy for routine work and provide suggestions for vaccine allocation for seasonal influenza.
Methods
Study setting and period
This study was conducted at Beijing SARS-CoV-2 vaccination sites in 16 administrative districts and one economic and technological development zone, categorized into urban, near-suburb, and outer-suburb areas. This study was reviewed and approved by the Ethics Review Committee of Chinese Academy of Medical Science & Peking Union Medical College (CAMS&PUMC-IEC-2022-066).
Five distinct periods were defined based on coronavirus disease 19 (COVID-19) epidemic trends and the corresponding adjusted policy and immunization strategy. These periods were: Period A, the “dynamic zero-COVID” phase, during which strict control measures to curtail the spread of SARS-CoV-2 were implemented; Period B, the phase following the announcement of the “20 measures” guidelines; Period C, the phase following the announcement of the “10 measures” guidelines; and Period D, the phase following the classification of COVID-19 as a Class B infectious disease. During this time, China experienced an Omicron surge, with the gradual relaxation of the epidemic prevention policy; and finally, Period E, the phase following the implementation of an updated immunization strategy that recommends vaccination 3 months after infection ().
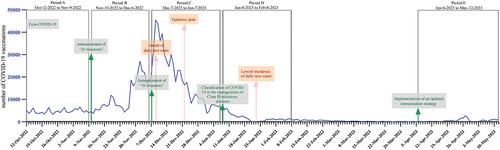
Figure 1. Number of daily SARS-CoV-2 vaccinations and the division of the five periods. The solid blue line shows the number of daily vaccinations in Beijing from October 12, 2022 to May 12, 2023, green arrows and font show policy changes, and red font shows the epidemic trend. The gray boxes mark the five periods chosen for the study. The Spring festival (from January 21 to 27, 2023) and May Day holidays (from April 29, to May 3, 2023) were excluded. COVID-19, coronavirus disease 2019; SARS-CoV-2, severe acute respiratory syndrome coronavirus 2.
Study design and data collection
This ecological study used a survey table to collect basic data about each vaccination site, including “the daily doses of SARS-CoV-2 vaccinations,” “the number of vaccination sites in each district,” “the vaccinated population,” “the provision of house-to-house vaccination,” “the frequency of house-to-house vaccinations per week,” “the provision of mobile vaccination,” “the frequency of mobile vaccinations per week,” “the available vaccine types,” and “the vaccination service hours per week” from the Beijing Centre for Disease Control and Prevention website (https://www.bjcdc.org/).Citation18 Additionally, an online questionnaire was sent to the principal officer at each vaccination site through WeChat, from which some additional data were collected, including “the total number of staff in each vaccination site,” and “the number of staff members in each vaccination site per day.” The questionnaire incorporated logical jump-and-fill restrictions to ensure the quality of data collection. In the questionnaire, we also collected some information similar to that collected using the survey table for cross-validation (Additional_files_2).
The study outcome was the average daily doses of SARS-CoV-2 vaccinations administered to people aged 3 years and older at each site during each period. To minimize ecological fallacies, factors associated with demography and epidemic dynamics were determined. Population density, sex, age, and disposable personal income were obtained from the Beijing Municipal Bureau of Statistics.Citation19 Information regarding the SARS-CoV-2 infection rate in different districts during the epidemic peak period, rate of primary vaccination series among people aged ≥3 years, and rate of partial vaccination among people aged ≥60 years by October 12, 2022 was obtained from the Chinese Centre for Disease Control and Prevention (Table S1).
Variables and indicators
The indicators S1 and S2 were established to represent the accessibility and capacity of vaccination services.Citation20 D1 was used to evaluate the utilization and real demand for vaccination ():
Table 1. Implementation of SARS-CoV-2 vaccination services in different areas of Beijing.
S1 = [n/a] × 100
S2 = [p/P] × 10,000
D1 = v/p
S1: number of vaccination sites per 100 Km2;
S2: number of staff members providing vaccination services per 10,000 residents;
D1: daily doses of vaccines administered by each staff member;
n: number of vaccination sites in each district;
a: district size;
p: daily number of staff members providing vaccination services in each district;
P: number of residents aged ≥3 years old;
v: daily doses of vaccines administered in each district.
Statistical analysis
Microsoft Excel (version 2022, Redmond, WA, USA) was used for data cleaning. Categorical variables are expressed as counts and proportions (n%), and continuous variables as means and 95% confidence intervals (CI). Univariate analysis was performed using Student’s t-tests, analysis of variance, Kruskal – Wallis tests, and Pearson correlation analysis. Statistical significance was set at p < .05.
Nearest neighbor analysis, Ripley’s K, and hot spot analyses were conducted and mapped in the Arc-GIS 10.2 (ArcGIS Desktop, ESRI, USA). The average nearest neighbor tool was used to measure the distance between each vaccination site and its nearest neighbor’s centroid location. If the average distance was less than the average for a hypothetical random distribution, the distribution of the features being analyzed was considered clustered.Citation21 Additionally, the “average nearest distance for vaccination” was calculated as half of the nearest distance between vaccination sites. The Ripley’s K function was used to test spatial point patterns in a defined sampling window for randomness based upon nearest-neighbor distances.Citation22 In our study, when the “Observed K” value was larger than the “Expected K” and “Confidence Env” values, the vaccination sites were considered to be significantly clustered. The hot spot analyses were used to evaluate the distribution of “the number of vaccination sites per 100 Km2,” “the number of staff members providing vaccination services per 10,000 residents,” and “the daily doses of vaccines administered by each staff member” in Beijing during the study period. A hot spot with high values of the above indicators was considered statistically significant.Citation23
The generalized estimating equations (GEE) model was used to estimate the association between interventions and outcomes adjusted for potential confounders, and the five periods were set as panel variables to adjust for the influence of policy adjustment and epidemic trends. Stata 17.0 (StataCorp; College Station, TX, USA) was used to perform the GEE modeling.
Results
Doses of vaccinations administered and the implementation of vaccination services
The average daily number of vaccine doses administered in Beijing significantly increased between the “zero-COVID” phase (4,694 doses) and the declaration of the “20 measures” phase (11,112 doses) (). Subsequently, the highest doses of vaccinations administered was recorded after the announcement of the “10 measures” guidelines and before the epidemic apex (18,675 doses). However, the doses of vaccines administered declined after the epidemic apex (2,172 doses). It further decreased to 751 doses after implementing an updated immunization strategy.
We collected information regarding the provision of vaccination services from 299 sites. The number of vaccination sites varied between 70 and 121 across urban, near-suburb, and outer-suburb areas in Beijing (, Table S2). Furthermore, most vaccination sites (66.9%) catered to individuals aged ≥3 years, offering an average of six types of vaccines. The daily number of staff members in each site was six. The vaccination service hours per week per site was 26.7. Additionally, most vaccination sites (95.0%) offered house-to-house vaccination services at an average frequency of six times per week. Only 10.4% of the vaccination sites used mobile vaccination vehicles.
Indicators were determined to evaluate vaccination services in urban, near-suburb, and outer-suburb areas (). The number of vaccination sites per 100 Km2, in descending order, were urban (14), near-suburb (2), and outer-suburb areas (1), while the number of staff members providing vaccination services per 10,000 residents was uniform at one in urban and near-suburb areas and two in outer-suburb areas. Additionally, the daily doses of vaccine administered by each staff differed across regions, with four, three, and two in urban, near-suburban, and outer-suburb areas, respectively.
Accessibility and capacity of vaccination services in Beijing
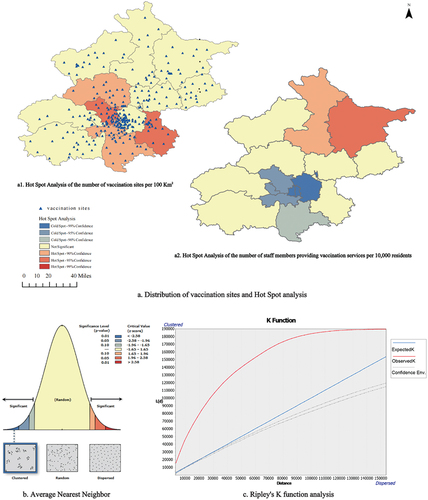
To analyze the accessibility of vaccination sites, nearest neighbor, Ripley’s K, and hot spot analyses were conducted according to both the location and number of vaccination sites in each district. The results of the nearest neighbor and Ripley’s K showed that the vaccination sites were significantly clustered in the urban areas (nearest ratio = 0.473, Z = 17.340, P < .001) (). Additionally, the average nearest distance was significantly smaller in urban areas (936.95 m) than in near-suburb (2350.23 m) and outer-suburb areas (2890.99 m) (F = 34.94, P < .001) (Table S3). Furthermore, hot spot analysis showed that for the number of vaccination sites per 100 Km2, there were two hot spots among urban and near-suburb areas at a 95%CI (). The number of staff providing vaccinations per 10,000 residents was used to analyze the capacity of the vaccination service at vaccination sites. The results of the hot spot analysis showed that there was one hot spot in the outer suburb areas at a 95%CI and three cold spots in the urban and near-suburb areas at a 95%CI ().
Figure 2. Accessibility and capacity of vaccination services in Beijing. Panel a describes the distribution of vaccination sites and the results of hot spot analysis; panel b describes the results of average nearest neighbor analysis; and panel c describes the results of Ripley’s K function analysis.
Real demand for vaccination in Beijing during different periods
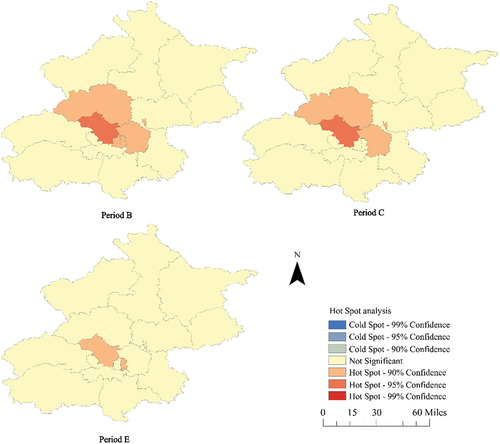
To analyze the demand for vaccination, we calculated the daily doses of vaccines administered by each staff member. Three typical periods were selected, including the beginning of the epidemic when daily doses increased (period B), the vaccination and epidemic peak (period C), and the later phase when the daily doses decreased (period E). In period B, there was one hot spot among urban areas at a 95%CI and four among urban and near-suburb areas at a 90%CI. In period C, there was one hot spot among urban areas at a 95%Cl and two among urban and near-suburb areas at a 90%CI. In period E, there were two hot spots among urban areas at a 90%CI ().
Figure 3. Real demand for vaccination in different areas in Beijing during the selected three periods. Period B: the period at the beginning of the epidemic when the daily doses of vaccines increased; period C: the period of the vaccination and epidemic peak; period E: the period at the later phase of the epidemic when the daily doses of vaccines decreased.
Association between vaccination services and the SARS-CoV-2 vaccination campaign
The association between the provision of services at each site and the SARS-CoV-2 vaccination campaign is presented in and S4. Vaccination sites for individuals aged ≥3 years administered a significantly higher number of vaccines than those for individuals aged ≥18 years (27.5 vs. 21.4, P = .019). In addition, longer service hours (r = 0.27, P < .001), providing different types of vaccines (r = 0.22, P < .001), more staff members (r = 0.14, P = .015), and more staff members for vaccination services per day (r = 0.24, P < .001) increased daily vaccinations.
Table 2. Univariate and multivariate analysis of interventions to promote SARS-CoV-2 vaccination.
After adjusting for confounders in the GEE model, providing services for people aged ≥3 years (β = 5.29, P < .001), longer service hours (β = 0.18, P = .007), providing different types of vaccines (β = 1.38, P < .001), and providing more staff members for vaccination services per day (β = 1.26, P < .001) were independent factors associated with a higher doses of daily vaccinations (). Mobile vaccination vehicles increased the number of daily vaccines administered among people aged ≥60 years (β = 1.02, P = .042) (Table S4).
Discussion
During the study period, an Omicron surge swept through Beijing. High case numbers resulted in variations in vaccination demand. Our study offers valuable insights into service allocation in different scenarios and provides measures to promote vaccination.
Daily vaccination doses varied with epidemic trends and policy adjustments. The doses of SARS-CoV-2 vaccinations decreased before the peak epidemic period when many people hesitated to step out due to infection or fear of infection. Vaccinations administered in Beijing increased following the announcement of the “20 measures” and “10 measures” guidelines, which were concerned with the relaxation of epidemic control measures while emphasizing vaccination and raised the public’s belief in vaccine effectiveness.Citation24 Furthermore, the Omicron variant led to a larger proportion of mild cases,Citation25 which weakened the perceived threat of the disease and willingness to be vaccinated. Notably, policy adjustments and epidemic dynamics affected the demand for SARS-CoV-2 vaccinations, which should be considered when allocating vaccination services.
We evaluated the spatial and temporal allocation of vaccination resources. We found that, in Beijing, the vaccination sites were mainly clustered in urban areas compared to outer-suburb areas. The establishment of vaccination sites was proportional to the number of streets and towns in each district; therefore, the service radius was smaller in urban than in suburban areas. The average nearest distance for vaccination was significantly shorter in urban areas (Table S3), which may have reduced the accessibility of vaccination in outer-suburb areas. These results indicate that the number of vaccination sites per 100 Km2 should be balanced among the urban and outer-suburb areas to ensure the accessibility of vaccination, especially for large geographical areas. Although the number of vaccination sites and the number of staff at each site were higher in urban areas than in outer-suburb areas, the vaccination staff per resident was lower in urban areas than in outer-suburb areas. This finding suggests that the number of staff members providing vaccination services per 10,000 residents should be balanced among the urban and outer-suburb areas to ensure the capacity of vaccination in each vaccination site, especially for areas with a large population.
Given that the vaccination sites are accessible and the number of staff is in line with the potential demand, the allocation of resources should also be adjusted according to real vaccination demand during different periods. We used the daily doses of vaccines administered per staff member to evaluate the real demand for vaccination capacity, which reflects the relationship between vaccination demand and service supply. The larger the value, the more the staff required. In our study, three typical periods were selected, including when the doses of daily vaccines administered increased, the vaccination peak, and when the doses of daily vaccines administered decreased. During the first two periods, the daily doses administered by each staff member were significantly higher in urban areas than in outer-suburb areas. The results suggest that when there is a looming epidemic, in order to cope with the increasing vaccination demands, more vaccination staff should be present to increase the vaccination capacity, especially in areas with a large population. When the daily doses of vaccines administered decreased, the “daily doses of vaccines administered per staff member” were consistent between the urban and outer-suburb areas in our study. Consequently, when the daily doses of vaccinations decreases, the number of vaccinations staff should be reduced in some urban areas to avoid the idleness of work force.
To evaluate the effectiveness of specific interventions to improve vaccination convenience, we analyzed the association between interventions and the daily doses of vaccines administered at each vaccination site. The results showed that augmenting vaccination for people aged 3–18 years can significantly increase the doses of vaccinations. This is convenient for parents who can be vaccinated with their children. Therefore, for future practice, providing simultaneous vaccination services for children and adults may improve convenience and promote vaccination. Furthermore, extending the operating hours of vaccination sites can significantly increase the doses of vaccinations. In China, clinicians cannot prescribe vaccines to patients, and residents cannot obtain vaccines at pharmacies or private clinics. Vaccination services are mainly provided by community health centers, temporary vaccination sites, and hospital clinics, limiting options and flexibility. China has recently launched research into the prescription of adult vaccines by family physicians.Citation26 In the future, exploring the establishment of adult vaccination clinics in China and providing longer and more flexible service hours may help increase vaccinations. Furthermore, the availability of different types of vaccines can increase the daily doses of vaccinations. The provision of different types of vaccines means that people are no longer limited to inactivated vaccines but can access recombinant, mRNA, nasal spray, and inhaled vaccines for sequential immunization. Sequential immunization is more effective against a constantly mutating virus than homologous vaccination.Citation27 Nasal spray and inhaled vaccines elicit increased mucosal immunity and reduce the incidence of local adverse reactions compared with traditional vaccines.Citation28,Citation29 Therefore, promoting the innovation of vaccine production and continuous improvement of the safety and immunogenicity of vaccines can enhance the population’s confidence and promote vaccination uptake. The implementation of house-to-house vaccination and mobile vaccination vehicles did not significantly improve vaccine uptake in our study. However, in the subgroup analysis among the high-priority population aged ≥60 years, the main beneficiaries of house-to-house vaccination services, we found that mobile vaccination vehicles increased vaccinations in this group (P = .04) (Table S4). However, house-to-house visits require more time and effort than fixed-location services, which reduces efficiency.Citation30 Therefore, for future practice, fixed-location vaccination services can be adopted when efficiency is required to meet the vaccination demand. Although house-to-house and mobile vaccination vehicles could improve vaccination convenience, they should be implemented mainly for people with disabilities and those living in remote areas.
The first strength of our study was using three indicators to evaluate spatial and temporal aspects of vaccination services, providing insights for selecting suitable indicators and methods for future evaluation of vaccination services. Second, five periods were set as panel variables in the GEE model to adjust for the impact of the cohort effect.
The main limitation of our study was not collecting information on individuals. Notably, we adjusted the demographic factors of the vaccination sites in the different districts to avoid heterogeneity. Additionally, ecological research is more suitable to provide evidence and suggestions for strategy adjustment and implementation for governmental macro-control.
Conclusions
SARS-CoV-2 vaccination services should be adjusted according to location, population density, and vaccination demand. Balancing the number and distribution of vaccination sites between urban and suburban areas according to the geographical area will ensure accessibility in suburban areas. Vaccination capacity should be ensured in urban areas by adjusting the number of staff administering vaccinations according to the served population. Feasible measures to promote vaccination from a macroscopic and governmental perspective are provided in our study. Combining fixed-location and house-to-house vaccination services for different populations, extending or adjusting service hours for those who cannot be vaccinated during regular hours, providing vaccination services simultaneously for children and adults, and providing timely vaccine updates can improve vaccine convenience. These interventions may inform SARS-CoV-2 vaccination services in Beijing in the future. Furthermore, utilizing the indicators and methodologies established for the evaluation of vaccination allocation within this study can help optimize resource allocation for other regions and different vaccines.
Author contributions statement
Concept and design: JL, LF.
Acquisition of data: YD, JL, LS, ZX, CB, XL.
Analysis and interpretation of data: YD, MJ.
Drafting of the manuscript: YD, MJ.
Critical revision of the paper for important intellectual content: JL, LF.
Statistical analysis: YD, MJ.
Obtaining funding: LF, JL.
Administrative, technical, or logistic support: JL, QW, JW, MX.
Supervision: JL, LF, WY.
All authors agree to be accountable for all aspects of the work.
Additional_files_2_clean.docx
Download MS Word (16.2 KB)Additional_files_1.doc
Download MS Word (98 KB)Disclosure statement
No potential conflict of interest was reported by the author(s).
Data availability statement
The datasets used and/or analyzed during the current study are available from the corresponding author, [Li], upon reasonable request.
Supplementary data
Supplemental data for this article can be accessed on the publisher’s website at https://doi.org/10.1080/21645515.2023.2289250.
Additional information
Funding
References
- Organization WH. WHO coronavirus (COVID-19) dashboard. Geneva: WHO; 2023. https://covid19.who.int/?adgroupsurvey=.
- Wang Q, Guo Y, Iketani S, Nair MS, Li Z, Mohri H, Wang M, Yu J, Bowen AD, Chang JY, et al. Antibody evasion by SARS-CoV-2 Omicron subvariants BA.2.12.1, BA.4 and BA.5. Nature. 2022;608(7923):603–8. doi:10.1038/s41586-022-05053-w.
- China CPsGotPsRo. The latest situation of coronavirus disease 2019 (COVID-19) as of 24: 00 on December 23. Health Commission of The People’s Republic Of China; 2022. https://www.gov.cn/xinwen/2022-12/24/content_5733356.htm.
- The low proportion of severe cases in this round of COVID-19 is mainly manifested by the aggravation of underlying diseases. 2022. https://news.cctv.com/2022/12/06/ARTIwRq3t7CKO3p3Z129QqD6221206.shtml.
- Wang B, Yu Y, Yu Y, Wang N, Chen F, Jiang B, Chen Y, Zhang J, Liu J, Wang H, et al. Clinical features and outcomes of hospitalized patients with COVID-19 during the Omicron wave in Shanghai, China. J Infect. 2023;86(1):e27–e9. doi:10.1016/j.jinf.2022.08.001.
- China CPsGotPsRo. Continue to improve the scientific precision level of prevention and control – interpretation of the “new Ten points” in the press conference of the joint prevention and control mechanism of the state council. The Xinhua News Agency; 2022. http://www.gov.cn/zhengce/2022-12/08/content_5730631.htm.
- China CPsGotPsRo. The joint prevention and control mechanism of the state council announced 20 measures to further optimize epidemic prevention and control. The Xinhua News Agency; 2022. http://www.gov.cn/xinwen/2022-11/11/content_5726144.htm.
- Yang H, Xie Y, Li C. Understanding the mechanisms for COVID-19 vaccine’s protection against infection and severe disease. Expert Rev Vaccines. 2023;22(1):186–92. doi:10.1080/14760584.2023.2174529.
- Altarawneh HN, Chemaitelly H, Ayoub HH, Tang P, Hasan MR, Yassine HM, Al-Khatib HA, Smatti MK, Coyle P, Al-Kanaani Z, et al. Effects of previous infection and vaccination on symptomatic Omicron infections. N Engl J Med. 2022;387(1):21–34. doi:10.1056/NEJMoa2203965.
- Huang Z, Xu S, Liu J, Wu L, Qiu J, Wang N, Ren J, Li Z, Guo X, Tao F, et al. Effectiveness of inactivated and Ad5-nCov COVID-19 vaccines against SARS-CoV-2 Omicron BA. 2 variant infection, severe illness, and death. BMC Med. 2022;20(1):400. doi:10.1186/s12916-022-02606-8.
- Feikin DR, Higdon MM, Abu-Raddad LJ, Andrews N, Araos R, Goldberg Y, Groome MJ, Huppert A, O’Brien KL, Smith PG, et al. Duration of effectiveness of vaccines against SARS-CoV-2 infection and COVID-19 disease: results of a systematic review and meta-regression. Lancet. 2022;399(10328):924–44. doi:10.1016/S0140-6736(22)00152-0.
- Daily B. Beijing’s COVID-19 vaccination schedule. Beijing Daily; 2020. https://baijiahao.baidu.com/s?id=1687588668205882292&wfr=spider&for=pc.
- On July 20, Beijing launched a full vaccination campaign against the novel coronavirus for people aged 12 to 17. People’s Information. https://baijiahao.baidu.com/s?id=1705874331349428384&wfr=spider&for=pc.
- Vaccination time of COVID-19 booster vaccine in Beijing. Beijing local treasure. 2021. https://emkycu.smartapps.cn/pages/article/detail/detail?id=301742&city=bj&type=article&_um_ssrc=SwqWU4PQbCXgTyptFbRto2r6VhHUngw64Rj7C1Eey1kaHUrVckk8eLaZw9JxuQ6eTaMbUNPKpKYEBznEzkuJKFXKW&_um_sts=1696844208766&_swebfr=1&_swebFromHost=heytapbrowser.
- Feng Jun GY, Yanni Y, Dayong Z, Li Z. Research on the accessibility of vaccination outpatient service based on geographic information system. Chin Health Ser Manage. 2017;10:792–5.
- Baike B. China disease control weekly report: from December 2022 to February 2023, more than 80% of the country’s population has been infected with the novel coronavirus. 2023. https://baijiahao.baidu.com/s?id=1764419103459284659&wfr=spider&for=pc.
- Cascini F, Pantovic A, Al-Ajlouni Y, Failla G, Ricciardi W. Attitudes, acceptance and hesitancy among the general population worldwide to receive the COVID-19 vaccines and their contributing factors: a systematic review. EClinicalMedicine. 2021;40:101113. doi:10.1016/j.eclinm.2021.101113.
- Beijing tCfDCaPo. Information disclosure of booster vaccination sites of SARS-CoV-2 vaccine. The Center For Disease Control And Prevention of Beijing; 2022. https://www.bjcdc.org/article/69021/2021/10/1634685869733.html.
- Statistics BMBo. Beijing regional statistical yearbook. 2022. https://nj.tjj.beijing.gov.cn/nj/qxnj/2022/zk/indexch.htm.
- Ye, Lixia, Fang, Ting, Ma, Rui, Zhu, Guanghui, Dong, Hongjun. Investigation on human resources of adult vaccination clinic in Ningbo city. Prev Med. 2017;29:750–3.
- Parihari S, Das Chatterjee N, Das K, Bhattacharya RK. Chapter 4 - role of groundwater potentiality and soil nutrient status on agricultural productivity: a case study in Paschim Medinipur district, West Bengal. In: Shit P; Bhunia G, and Adhikary P editors. Case studies in geospatial applications to groundwater resources. India: Elsevier; 2023. p. 39–66. doi:10.1016/B978-0-323-99963-2.00008-0.
- Ripley BD. Tests of’randomness’ for spatial point patterns. J Royal Stat Soc. 1979;41(3):368–74. doi:10.1111/j.2517-6161.1979.tb01091.x.
- Staples JN, Nelamangala SL, Morris S, Wells K. Exploring socio-demographic and geospatial variation in human papillomavirus vaccination uptake in Virginia. Vaccine. 2021;39(38):5385–90. doi:10.1016/j.vaccine.2021.07.079.
- xinhuanet. Vaccination in the elderly can effectively prevent severe disease and death of COVID-19. xinhuanet; 2022. http://www.news.cn/politics/2022-07/23/c_1128856228.htm.
- Whitaker M, Elliott J, Bodinier B, Barclay W, Ward H, Cooke G, Donnelly CA, Chadeau-Hyam M, Elliott P. Variant-specific symptoms of COVID-19 in a study of 1,542,510 adults in England. Nat Commun. 2022;13(1):6856. doi:10.1038/s41467-022-34244-2.
- W DB. Ten grassroots health institutions explore: family doctors will prescribe adult vaccines. Southern Urban Daily; 2023. https://www.sohu.com/a/677777881_161795.
- Chalkias S, Harper C, Vrbicky K, Walsh SR, Essink B, Brosz A, McGhee N, Tomassini JE, Chen X, Chang Y, et al. A bivalent Omicron-containing booster vaccine against COVID-19. N Engl J Med. 2022;387(14):1279–91. doi:10.1056/NEJMoa2208343.
- Deng W, Lv Q, Li F, Liu J, Song Z, Qi F, Wei Q, Yu P, Liu M, Zhou S, et al. Sequential immunizations confer cross-protection against variants of SARS-CoV-2, including Omicron in rhesus macaques. Sig Trans Targeted Ther. 2022;7(1):124. doi:10.1038/s41392-022-00979-z.
- Wu S, Huang J, Zhang Z, Wu J, Zhang J, Hu H, Zhu T, Zhang J, Luo L, Fan P, et al. Safety, tolerability, and immunogenicity of an aerosolised adenovirus type-5 vector-based COVID-19 vaccine (Ad5-nCov) in adults: preliminary report of an open-label and randomised phase 1 clinical trial. Lancet Infect Dis. 2021;21(12):1654–64. doi:10.1016/S1473-3099(21)00396-0.
- Xu F, Wu S, Yi L, Peng S, Wang F, Si W, Hou L, Zhu T. Safety, mucosal and systemic immunopotency of an aerosolized adenovirus-vectored vaccine against SARS-CoV-2 in rhesus macaques. Emerg Microbes Infect. 2022;11(1):438–41. doi:10.1080/22221751.2022.2030199.