Abstract
This paper develops a performance management tool and considers its application to the football industry. Specifically, the resulting model evaluates the extent to which the performance of English Premier League football club managers can be attributed to skill or luck when measured separately from the characteristics of the team. We first use a specification that models managerial skill as a fixed effect and we then implement a bootstrapping approach to generate a simulated distribution of average points that could have taken place after the impact of the manager has been removed. The findings suggest that there are a considerable number of highly skilled managers but also several who perform below expectations. The paper proceeds to illustrate how the approach adopted could be used to determine the optimal time for a club to part company with its manager.
I Introduction
Motivated by the much larger literature on the identification of mutual fund manager skill, this paper proposes the adoption of a bootstrapping methodology to evaluate the performance of football club managers. The bootstrap is a technique that is highly suited to the problem at hand since the distribution of points scored, and consequently of the estimated model's residuals, is highly nonnormal, making inferences from more conventional parametric approaches problematic. We are able to identify whether the number of points per game secured by the manager is due to the characteristics of the team or managerial skill. When used in a recursive window, the bootstrap can be used to examine whether a manager's performance is improving or weakening, and hence, we can determine whether he is ‘significantly weak’ and should therefore be fired.
Association footballFootnote1 is the world's most popular sport and contributes significantly to the global sports industry that is worth in excess of £83.32 billion annually (Clark, Citation2010). Professional football underpins the sport's economic footing, with the English Premier League (EPL), broadcast in 210 countries worldwide, leading the way with combined revenues of £2 billion among its 20 clubs in 2009. Despite the EPL's substantial turnover, only six of the league's clubs managed to make a pre-tax profit in the same year (Jones et al., Citation2010). This is in large part due to the failure of clubs to control costs. The outlay on player registrations (transfers), player wages and stadia development are the principal foundations for this. Another prevalent cost for professional football clubs is the hiring and firing of management teams. Acquiring the right manager is integral to a club's on-field success (Brady et al., Citation2008). Conversely, the appointment and subsequent dismissal of the wrong manager can be extremely costly as managers are entitled to compensation if their contracts are terminated early. For example, former Liverpool manager Rafael Benítez was paid £6 million to vacate his position in 2010 (Herbert, Citation2010), Chelsea gave a ‘golden parachute’ to former head coach, Luiz Felipe Scolari, worth £12.6 million (Fifield, Citation2010) following his sacking in 2009 and the same club also paid former manager José Mourinho £18 million in compensation following his dismissal in 2007 (Burt, Citation2007).
In 2009, only four EPL managers had held their position for more than 3 years: Rafael Benítez (4½ years), David Moyes (7), Arsène Wenger (12) and Alex Ferguson (22). In fact, the average managerial tenure within the four English professional leagues between 1992 and 2005 was only 2.19 years (Bridgewater, Citation2009). Sackings2 seem to be embedded in the culture of the game. A similar trend is visible in the US sports domain where coaches of NBA, NFL, NHL and MLB franchises had spent an average of 2.44 years at the helm between 1987 and 1992 (McTeer et al., Citation1995). In some instances, intuition and the weight of media hype encourages us to assume that managers are sacked too early and without being given a fair run of games to prove their worth. Can we establish whether this is indeed a realistic assumption to make?
While profitability may not be the yardstick used in football club performance measurement, money has still become an increasingly integral part of the game. A study encompassing top tier club player wage bills and head coach salaries for 22 seasons from 1981/82 to 2002/03 in the German Bundesliga revealed that spending on managerial and playing talent combined improves league performance (Frick and Simmons, Citation2008). Analysis of the effects of management change in the Bundesliga shows that the primary reasons for managerial dismissals are poor on-field performance, a breakdown in relations between the manager and directors, and media speculation and intensity (Salomo and Teichmann, Citation2000). It is clear that appropriately evaluating the performance of football club managers is an important task, not just financially, but because of the impact that the manager's skill can have on the performance of his team. Yet, the number of studies that have attempted this, described in the following section, is surprisingly very small indeed.
The remainder of the paper is organized as follows. Section 2 is split into two parts – first, we discuss the evaluation of mutual fund manager performance, and how we can apply a technique from this literature in the football context. Second, we review the existing literature on the assessment of football club managerial performance and what happens to this when there is managerial turnover. Section 3 discusses the data sources and methodology employed, while the results from implementing the bootstrapping approach to the whole sample are analysed in Section 4. Section 5 reveals the results when the technique is used recursively, leading to comments on what managerial changes should perhaps have been made during the sample period. Finally, Section 6 concludes.
II The Existing Literature
II.1. Evaluating mutual fund managers
To motivate our approach to evaluate the performance of football club managers, we will adapt an established methodology from existing research concerning the mutual fund industry. Following Jensen's Citation(1968) seminal study, the returns generated by mutual funds started to be considered in a risk-adjusted fashion rather than in raw terms. Jensen considered performance after taking into account the amount of market risk that the portfolio was exposed to and showed that when considered in this light, almost no managers were able to outperform.
More recently, studies have evaluated the performance of fund managers using a model with three or four factors allowing for the extent to which the fund was exposed to risks arising from general market movements, and also whether the portfolio was tilted towards small stocks, value stocks (with low price-earnings or market value-to-book value ratios) or those with momentum (i.e. those whose prices have risen over, say, the past year). Performance is then measured by examining the statistical significance of the intercept (termed ‘alpha’ in the finance literature) in those regressions (see, e.g. Fama and French, Citation1993; Carhart, Citation1997). The key reason for adopting such an approach is that it ensures managers are not rewarded for randomly picking stocks from within certain categories that are widely documented to be profitable most of the time; thus, an examination of these alphas will separate managers who have genuine stock picking ability from those who naively followed these strategies with no additional insight. The overwhelming conclusion from the very large body of evidence is that fund managers are unable to yield positive returns once their fees are taken into account and that any significant outperformance is hard to predict and fleeting.3
In addition to the studies described above that use parametric approaches based on regression to assess fund performance, more recent work by Kosowski et al. Citation(2006) and by Cuthbertson et al. Citation(2008) has employed a bootstrap approach to separate managerial skill on one hand from luck and the degree of risk taken on the other. Their approaches essentially involve estimating a regression model to explain fund manager performance, bootstrapping from the residuals and then reconstructing the time series of returns for the fund under the null hypothesis of no fund manager outperformance (in other words, with the regression intercept, alpha, set to zero). The bootstrap is conducted, say, 1000 times to generate a distribution of performance that is based only on luck and exposure to the risk factors and not to managerial skill (since by construction the average degree of outperformance has been set to zero). The core finding of these studies is that, in both the USA and the UK, the number of highly skilled managers with significant stock picking ability is very small, but there is a larger pool of very poorly performing managers whose results cannot be attributed purely to bad luck or to low exposures to risk that generated low returns; rather, these managers have significant ‘negative skill’.
II.2. Assessing football club managerial performance
We now examine previous academic studies from Belgium, the Netherlands, the USA and the UK relating to why football club managers are sacked and how these dismissals have been assessed.
There have been a number of studies on the impact of changing professional football managers in various countries. Evidence from the top three tiers of Belgian football between the 1998/99 and 2002/03 seasons found that on average, if a club's performance declined over a 2-month period, the coach would be sacked. Further analysis of these clubs showed that on-field performance actually deteriorated following a new managerial appointment when compared with similarly performing teams (Balduck and Buelens, Citation2007).
Bruinshoofd and ter Weel Citation(2003) examined whether the dismissal of managers in the Netherlands brings an enhancement in results for club sides. Sample data for this study were taken from the Dutch Eredivisie (Premier League) between 1988 and 2000. There were 125 managerial sackings in the division over this period. An econometric model was built to account for managerial performance four games prior to and after a managerial departure. The results showed that sackings come after declines in team performance and are followed by improvements in performance. At first glance at such a projection, it would seem that appointing a new manager does improve a team's results. However, the authors found this was not the case when they compared the performance of similar clubs who did not dismiss their manager, suggesting that in not sacking a manager, the results of a poorly performing club would have improved quicker. They conclude by stating that sacking a manager seems to be ‘neither effective nor efficient in terms of improving team performance’ (Bruinshoofd and ter Weel, Citation2003).
De Paola and Scoppa Citation(2008) investigated managerial sackings with regard to Italian football. Data were obtained regarding managerial dismissals and team performances within Italy's Serie A between the seasons of 2003/04 and 2007/08. The results originally showed that changing a manager has a positive effect on Serie A results, but this dissipates completely on the implementation of the authors’ control (two-stage least-squares estimates) for endogeneity problems in replacing coaches. They therefore essentially come to a similar opinion to Bruinshoofd and ter Weel in concluding that changing a manager does not improve or deteriorate a team's performance.
A comprehensive study was conducted for English football by Audas et al. Citation(2002), where every UK Football League and Premier League game between the 1972/73 and 1999/00 seasons was examined to assess the impact of managerial change on team performance. A parametric model was constructed using the match results, which enabled the assessment of the short-term impact of managerial alterations. Many previous studies had been based on an entire season rather than on a partial season. This research demonstrates that there had been more than 700 cases of within-season managerial change during the sample period. An ordered probit regression was run to analyse these results. Its findings suggest that clubs changing managers within season subsequently tended to perform worse than those that did not (Audas et al., Citation2002).
The view that appointing a new manager has no effect or an adverse outcome on a team's performance is not by any means universal. Research by Bridgewater Citation(2009) shows that appointing a new manager will have a positive short-term effect on team results. This is due to the fact that players will be out to try to impress their new manager to ultimately keep themselves in employment. The boost lasts for a short ‘honeymoon’ period of between 12 and 18 games after the appointment. After this period, performance of changing a manager disappears. Therefore, on average, managerial changes at football clubs do not improve performance in the long term (Bridgewater, Citation2009). The view that results will deteriorate in the longer term is echoed by Hughes et al. Citation(2010). Football is often argued to be a ‘results driven business’ where current performance is considered to be paramount, so it is understandable that many club executives are willing to take a risk on appointing a new manager to improve a club's short-term fortunes (especially when under the threat of relegation). If they sit back and watch a current manager fail, they too may lose their jobs along with the manager in question in what represents a cutthroat industry. In exceptional circumstances, a team's performance can improve based on the ‘new culture’ a manager instils as, for example, in the case of Guus Hiddink and South Korea in the 2002 World Cup (Brady et al., Citation2008).
Given the significant costs involved with changing managers and the disputed effects that the literature discussed above suggests such a drastic step has on a team's results, it is perhaps surprising that there are so few studies that investigate whether there is an optimal time to fire a manager. Hope's Citation(2003) model represents the only attempt at developing a practical econometric technique to answer this question. According to his approach, it is assumed that a football manager's core objective is to maximize the number of league points accumulated. He suggests that a football club's strategy consists of three core factors with regard to managerial performance:
Honeymoon: Length of the honeymoon period in which the manager is exempt from being sacked.
Trapdoor: Average number of points accumulated per game. If the manager is below this figure, they will be sacked.
Weight: Weight that most recent games will be given in analysing the manager's performance.
It is presumed that any manager will receive a ‘honeymoon period’ on appointment. Following this period, a manager will be fired if their performance drops below the club's desired points target. The honeymoon and trapdoor variables are decided upon by the model user. Using partial data from Premier League seasons 1996/97 to 2001/02, it was deduced that putting a weight of 47% on the last five games made the model most efficient. With this weighting, a manager should gain an average of at least 0.74 points a game and at least 56.81 points over the course of a season. If a manager's performance is under the 0.74 average, he should be sacked by the club (Hope, Citation2003).
While Hope's model represents a significant step forward, he outlines a number of drawbacks inherent in the approach, suggesting that a consideration of alternatives is warranted. These include that the model does not consider: whether games are played at home or away, the quality of the opposition, the importance of avoiding relegation, non-Premier League games, the financial and other costs of firing a manager and the diverse aspirations of alternative clubs.
III Data and Methodology
III.1. Data sources
The data employed in this study were collected from a multitude of sources for the five EPL sample seasons from 2004/05 to 2008/09. A list of the 48 managers to lose their positions during this period was provided by the League Managers Association, the managers’ union in the UK. Premier League transfer fees for the desired period were obtained from Transfer Market (http://www.transfermarkt.co.uk/), while club wages came from Deloitte's 2006–2010 Annual Reviews of Football Finance (including Jones et al., Citation2010). Individual football match results for the five sample seasons (1900 games) were obtained from the results databases on http://www.football-data.co.uk. Non-EPL games were compiled from http://www.11v11.com and http://www.UEFA.com, as the number of non-Premier league games played may have an influence on a club's league performance. Final Premier League tables for the same seasons were sourced from http://www.soccerbase.com. All EPL injuries, suspensions and player unavailability for the seasons between 2005/05 and 2008/09 were compiled using UK broadsheet newspapers: The Guardian, The Independent, The Telegraph and The Times through the Lexis Nexis portal.
III.2. Methodology
We require a model that separates the impact of the manager on the performance of the team from the effects of other characteristics. This is not an easy task, since many intuitively obvious measures of the characteristics of teams that may model their on-field points scores are contaminated with the impact of the manager's skill or lack thereof – for example, bookmaker odds, the number of points scored in previous matches, current or previous league position, etc., all have to be ruled out on these grounds.
Therefore, we come at the problem from an unobserved effects point of view. Manager i obtains a given result with the team he is managing/coaching at the time, and we regard manager characteristics as an unobserved fixed effect. We therefore estimate a fixed effects model as follows. Let yi, t denote the performance measure (the number of points scored: 0 for a loss, 1 for a draw or 3 for a win) for a team playing with manager i in fixture t
where x are the characteristics of the team, ui, t are zero mean i.i.d. disturbances with no specificity by fixture or manager, i=1, …, N; t=1, …, TN so that there are N managers each in charge of a team for a total of TN matches during the 5-year period. In our sample, TN runs from a minimum of 2 (Paul Sturrock) to a maximum of 190 matches for the four managers who were responsible for their clubs for all five seasons that we examine. The manager fixed effect is ai, regardless of which team they are managing, which may change in the course of the sample, and we assume that none of the x are also fixed by manager across matches, but the variables are chosen judiciously to ensure that this is a reasonable assumption.
Over the 5 years for which we have Premier League data, there are 1900 league matches and 60 managers. We estimate model (1) and obtain estimates of both the manager fixed effects and the other factors that capture team performance using the following variables (with their motivation for inclusion):
1. the total player wage bill over the season in millions of pounds; we argue that the wage bill is largely determined by the quality of the players who have been purchased in the past, and we assume that a manager would have purchased the most appropriate players that the club's budget would allow;
2. the total net transfer spend in millions of pounds; this measures the extent to which the club is currently able to purchase high quality new players;
3. the total number of listed players who are injured for match t;
4. the total number of listed players who are suspended for match t;
5. the total number of listed players who are unavailable for match t for a reason other than injury or suspension (e.g. African Cup of Nations);
6. the total number of non-Premier league games that the team plays during that season (i.e. cup games).
We expect 1 and 2 to positively affect match performance, while 3–5 will negatively affect it. The impact of the number of non-Premier league games on the expected points score for league matches is perhaps ambiguous for reasons which we will discuss below.
In addition, the values of each of these characteristics for the opposing team for match t are also used as explanatory variables, with the signs expected to be the reverse of those for the team under consideration. Since each match includes two teams, both having a manager, it is necessary to include each game twice in the dataset – once where the team and manager under consideration represent the home team, and the other where they are the away team.4
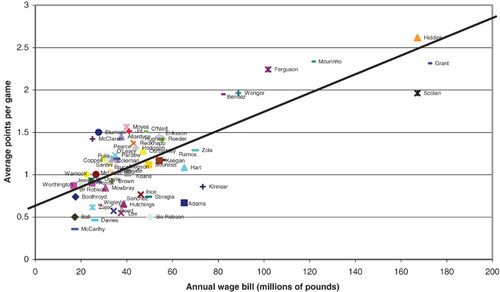
For illustration, plots the average number of points awarded per game for each manager against the average annual wage bill, in millions of pounds of the team(s) that they managed over our sample period. It is evident from the scatter that there is a positive relationship between points and wages, with a simple correlation of 0.75. Successful managers are those the furthest above the line, while those well below it are the least successful (although, of course, only wages and no other team characteristics are accounted for by this particular plot). The financial muscle of the historically ‘big four’ teams (Arsenal, Chelsea, Liverpool and Manchester United) is evident as their average wage bills are far bigger than the rest.
Figure 1. Number of points awarded versus weekly wages.
Clearly, the dependent variable in Equation 1 is limited since it can only take on one of three integer values, and therefore, we employ (separately) an ordered probit model. The results from the estimation of this model are presented in . While the results from the model estimation are not the primary focus of the paper, they are none the less of interest. As the table shows, there is a remarkable degree of consistency between the ordinary least squares (OLS) and the probit estimates in terms of both the parameters themselves and their levels of significance. All statistically significant variables have the expected signs. Any reason for players to be absent from possible inclusion in the squad (because they are injured, suspended or unavailable) causes a significant negative impact on the fitted number of points scored in the match, and on the other hand, an increase in the number of players absent from the opposing team causes an increase in the fitted number of points (although the number of unavailable players in the opposing team is just outside of significance at the 10% level). A five-man increase in the number of players absent from the squad for the match causes a fall in the expected number of points of around 0.2 for injuries, 0.5 for suspensions and 0.6 for players unavailable for other reasons. Given that the typical number of absent players is around 3 or 4 but varies from 0 to 12, this is economically important.
Table 1. Estimation results for model including team characteristics and manager fixed effects
The higher the total wage bill of the club (of the opposing team), the higher (lower) the expected number of match points scored, and both are significant at the 1% level. Net transfer spending is not a statistically relevant factor (either for the team under consideration or the opposing team), but this may reflect the cumulative influence of a number of years of expenditure on performance rather than merely the current year, which we measure in this paper.Footnote5 An increase in the total annual wage bill of £100 million (or a fall in the opposition's wage bill of the same figure) leads to an increase in the expected number of points per match of 0.8 (0.9).Footnote6 The total wage bills varied between £30 million (Stoke City) and almost £170 million (Chelsea) in the 2008/09 season.
The parameter estimate on the total number of additional games played is negative and very insignificant for the team under consideration but negative and significant for the opposing team. The expected relationship between points scored in the league and the number of non-Premier league fixtures is somewhat ambiguous because, on one hand, any additional games are a drain on the team's energy and are likely therefore to degrade league match performance as players involved in large numbers of additional fixtures become increasingly fatigued through the season. On the other hand, large numbers of non-Premier league games are only an issue for teams that are successful in those competitions, and therefore the performance of the team outside the league might be a positive predictor of performance within it.
We now proceed to discuss the bootstrapping approach that is adopted to separate the impact of manager skill from team characteristics when assessing the on-field performance of the club. If there is no fixed effect, then there is no manager effect. Imposing this restriction, Equation 1 becomes
Or equivalently
Estimates of all but the intercept, β0, are available from Equation 1. β0 is estimated as the global average across all games and all managers of the number of points scored per match. We are then able to regenerate the dependent variable under the null hypothesis of no manager fixed effects as
This would get the expected value of performance under the null that there was no manager effect since the manager effects have been explicitly allowed for in the estimation of Equation 1 and then subtracted out when the dependent variable is reconstructed in Equation 4.
We proceed to sample with replacement from as constructed in Equation 4, and for each of j=1, …, 10, 000 bootstrap replications, we generate TN draws and compute the average number of points scored by manager i,
, at each replication j.7 This distribution represents the possible performances in matches managed by i that may have occurred purely due to team characteristics and luck. We then order the distribution of 10,000 average performances,
, and finally examine where the actual performance of manager i fits within this ordered bootstrapped distribution. We define a manager as ‘skilled’ if they are in the top 5% of the distribution of the number of points that would have occurred purely as a result of other (nonmanager) team characteristics and chance, as ‘unskilled’ if they are in the bottom 5% and ‘typical’ if they are anywhere in between.
IV Results
shows the key results for managerial performance. The average number of points for all managers from all games where each game counts twice (once for each of the home and away managers) is 1.37, and this provides a benchmark against which to judge each individual manager. Forty-two out of 60 managers did not manage to achieve this average, which is more than half the total number of managers because the distribution of points is not symmetric. Interestingly and by coincidence, teams with no permanent manager generated exactly this number of points on average.
Table 2. Manager performance according to the bootstrap approach
If we start by focusing on the actual average number of points secured by each manager, ignoring for the moment the finances and any other team characteristics, the top-performing managers by a considerable margin are Guus Hiddink (2.61 points per match on average), José Mourinho (2.33), Avram Grant (2.31) and Alex Ferguson (2.24).Footnote8 At the other end of the performance spectrum, Kevin Ball (0.45), Billy Davies (0.46) and Mick McCarthy (0.51) secured the lowest number of points per match on average through their tenures during our sample period.
However, as has been discussed above, focusing on raw measures of performance that do not allow for the funds available to a manager or other team characteristics could lead to a misleading and incomplete measure of manager effectiveness. If we now focus on under- or out-performance relative to expectations, we observe a somewhat different picture. We first calculate the difference between the actual average number of points secured and the number that would have been expected given the characteristics of the team during that season. The latter is calculated as the median number of points from the 10,000 bootstrap replications and measures the number that would have been awarded given that the manager-specific effects have been removed.
From our sample, the managers who underperformed the most on this measure are Bobby Robson (in his final four games at Newcastle United), who managed to score less than half the number of points on average than would have been expected (0.50 versus 1.35), and Les Reed (0.57 versus 1.1). Similarly, even though expectations of Mick McCarthy were much lower than average (0.88 points per game), he secured less than half that figure (0.36). The best managers relative to expectations are Alex Ferguson and Guus Hiddink, equal on 0.72 more points on average per match than would have been expected. Next are Arsène Wenger, José Mourinho and Rafa Benítez with around 0.56 more points than expected. Of all 60 managers, it is interesting that on this measure, having no permanent manager at all is the ninth best. This may reflect the fact that players are likely to put in extra effort in the short term under a caretaker manager as their future at the club and livelihood may be at stake. Also of note are Sam Allardyce, David Moyes, Steve McClaren and Martin O'Neill, who all performed well with limited resources.
We now focus on whether managers perform above or below expectations in a statistically significant sense by comparing the average number of points generated by the manager with the distribution of performance that arises from the 10,000 bootstraps. If we use a 1% (5%) rule to define performances statistically different from their expected values, we have 13 (15) above and 4 (7) below expectations. Thus, comparing the results with those obtained by applying a similar approach to fund manager performance, we find that a considerably higher proportion of football managers appear to add value, or to be highly skilled, when compared with their counterparts in the investment world.
Mick McCarthy, Sammy Lee, Bobby RobsonFootnote9 and Billy Davies all scored lower average points per match than over 99% of artificially generated managerial performance. At the other end of the spectrum, for Alex Ferguson, Arsène Wenger, David Moyes, Guus Hiddink, José Mourinho, Rafa Benítez and Sam Allardyce, not a single one of the 10,000 randomly generated managers was able to outperform them.
V A Bootstrap approach to determining the point at which to sack a manager
We next adapt the method described above to develop an approach that could be used to evaluate football club manager performance in real time. Although we cannot tell how a sacked manager would have performed if he had remained in office, we are able to achieve two goals: first, we can identify a poorly performing manager who perhaps should have been a target for contract termination before it actually occurred; second, we can identify from among the list of managers who were sacked those where the decision was, according to our analysis, made prematurely. In order to achieve this, we essentially employ the bootstrap using a recursive estimation window, starting with the first 10 games for which the manager is in place during our sample period. We employ 10 games as a minimal threshold since sample sizes lower than this seem insufficient to gauge a manager's abilities as per Hope Citation(2003). This procedure is repeated and a further game added to the sample until we reach the end of the manager's tenure or the end of our sample period; it generates a time series of average actual points per match achieved until that point in time, together with the bootstrapped distributions.
Of the 48 managers who departed from their clubs over our sample period, 21 resigned while 27 were sacked. breaks down the reasons for the managerial changes in more detail. It is evident that there is considerable variation in managerial turnover over our five-season sample period. In 2005/06, there were only three sackings, but in 2007/08, this had increased to nine. It is also the case that some teams are represented several times in the table, with departures occurring repeatedly, especially among teams typically occupying the lower parts of the table (and Chelsea). This perhaps reflects the unrealistic expectations of certain club owners or their fans, who entrust the manager to perform something not far short of a miracle in a short time and on a tight budget.
Table 3. A list of managers sacked (left panel) and resigned (right panel) from EPL teams 2004–2009
of course identifies those managers who actually parted company with their clubs and does not involve any judgement on whether they should in reality have done so. In order to make such judgements, we employ the bootstrap as described above, assuming a 5% (one-sided) level of statistical significance for the purpose of this research. Therefore, any manager who performs worse than 95% of the generated managerial performance in their category could be a candidate for the sack.10
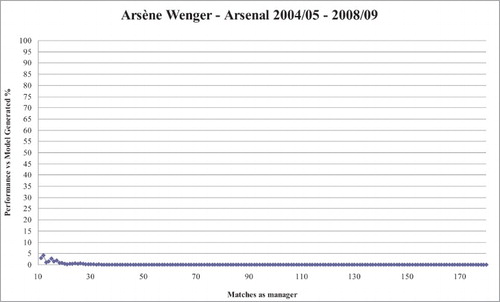
Given that the recursive bootstrap approach leads to a performance measure for every manager for every game beyond the initial 10, due to space constraints it is not possible to present every result in this paper. However, we can first make some general observations before moving onto the specific results. First, in terms of the average number of points scored per game relative to the number expected, it seems that managerial performance does tend to settle down fairly quickly so that a reasonably accurate assessment can be made after around 10 games. It is clear from the results that strong managers emerge very quickly and managers whose teams show a very weak performance at the outset are virtually never able to turn things around. For example, plots the number of matches that the manager has acted as manager (starting from 10) on the x-axis against the percentage of managers simulated by the bootstrap who were able to outperform Arsène Wenger. It is very clear that Wenger was quickly established as being better than over 95% of random managers, and after running the team for 15 games from the start of our sample period, he was better than 99%.
Figure 2. Bootstrap results for Arsène Wenger.
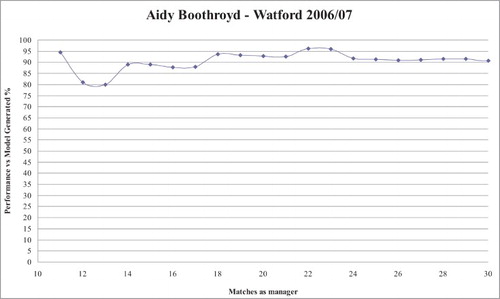
replicates this for Martin Jol, who started off as a mid-performing manager of Tottenham. His performance rapidly improved so that after around 30 games he would have been classified as significantly skilled. On the other hand, Graeme Souness () maintained his early average performance at both the clubs he managed during our sample period, which is perhaps also indicative that managerial performance is largely unaffected by switching clubs once any initial honeymoon period has warn off. Finally, shows that Aidy Boothroyd's performance was below expectation right from the very first point that it was evaluated, and, apart from a couple of wins early in his tenure, did not improve and Watford were relegated.
Figure 3. Bootstrap results for Martin Jol.
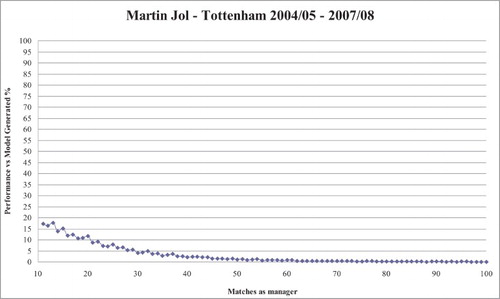
Figure 4. Bootstrap results for Graeme Souness.
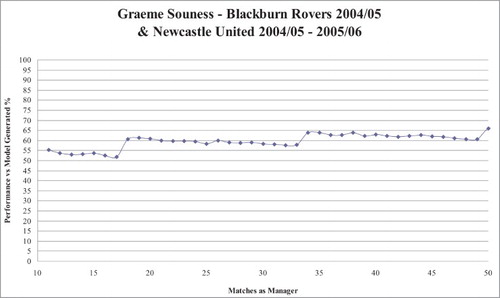
Figure 5. Bootstrap results for Aidy Boothroyd.
We now provide one illustrative example of a manager who the recursive bootstrap reveals could have been sacked during the period before they actually were. Having gained great renown as a coach (later becoming English National Coach for 17–21-year-old players in 2007), Steve Wigley (Southampton 2004/05) became the Southampton manager in August 2004 but was allowed only a short run in this position and was sacked on 8 December 2004 after 14 games in charge. The bootstrapping model reveals that he was performing below expectations as early as 4 November 2004 following the club's 2–2 home draw with West Bromwich Albion. Wigley's then performance level was worse than 99.12% of generated managers. His performance remained below 95% of randomized managers for the subsequent four games before his sacking. Wigley himself was rather philosophical about the abrupt change, commenting ‘Now that might have riled some people but I'm not going to whinge about my job being offered to somebody else. That's football.’11 An extra two points would have kept Southampton in the Premier League, and one could argue that this may possibly have been attainable had the club parted company with the manager earlier. However, it is of interest to note that even Harry Redknapp, the replacement manager, was unable to keep Southampton in the Premier League, despite having a good track record in such positions.
As suggested above, the model can also identify those managers who were sacked prematurely, or where perhaps off-the-field issues clouded the judgements of the boards concerned. An example will serve to demonstrate this in practice. Sven-Göran Eriksson was sacked as manager of Manchester City on 2 June 2008 after only one season at the helm. Results from the bootstrapping model show that Eriksson's performance was vastly improving at the time of his dismissal. Our analysis showed that only 22% of random managers were better at the start of his tenure but this had enhanced to 5% prior to his sacking. This put him just outside the top class managers in England suggesting that he should not have been fired. However, the then owner and former Thai Prime Minister, Thaksin Shinawatra, sacked Eriksson prior to selling the club to the Abu Dhabi United Group for Development and Investment.
VI Conclusions
This paper has developed a new approach to measuring the extent to which the performance of EPL football club managers can be attributed to skill or luck when measured separately alongside the characteristics of the team. Following an approach outlined in the literature focusing on the mutual fund industry, we first used a specification that models managerial skill as a fixed effect and examines the relationship between the number of points earned in league matches and the club's wage bill, transfer spending and the extent to which they were hit by absent players through injuries, suspensions or unavailability. We then implemented a bootstrapping approach after the impact of the manager on team performance has been removed. This simulation generates a distribution of average points per match collected under the null hypothesis of no manager impact on performance. The actual average number of points captured by the manager was then compared with this distribution to ascertain the extent to which, after allowing for the resources at his disposal and other team characteristics, the club manager significantly outperformed or underperformed what would have been expected. We show that, unlike the fund management industry, the UK appears to have had a number of highly talented football managers whose success cannot be purely attributed to luck or the quality of their teams. On the other hand, there also existed managers whose performances were below expectations. We have evidence to support two key themes: first, that football club directors or owners who sack underperforming managers at a very early stage of their tenure sometimes make a decision supported by the bootstrapping model, if perhaps not for the correct reasons; and second, we can identify skilled football managers who, on occasion, are sacked for reasons that cannot be attributed to their on-the-field performance.
We then proceeded to present an approach that could be employed to evaluate football club managers in real time. It is evident that managerial performance can plausibly be gauged after 10 games with outstanding managers shining right from the start and the underperforming managers rarely being able to reverse their teams’ early failures. Managers who begin as mediocre performers tend to remain there as well, although their future fortunes could also go into either extreme. The lesson, therefore, is that managers who perform below expectation usually remain that way and therefore it may be optimal to remove them from office sooner rather than later; on the other hand, those managers who are merely somewhat disappointing should be given time to further develop their teams.
The research conducted in this paper could usefully be extended in a number of different directions. First, the approach to evaluating managers in real time as outlined in Section 5 could be honed in several ways. For example, current managers within the professional domain could be evaluated using a rolling rather than recursive window, so that only the results in their most recent matches (say, the most recent 20) are taken into account. Alternatively, in the present model, the points were averaged to construct the measure of manager performance, but it would be possible to weight the points (e.g. using an exponential function) so that while all matches in the manager's history affect his current performance measure, the most recent matches carry greater weight. Given the way that we have taken an unweighted average, managers who have had very long tenures in post (e.g. Alex Ferguson and Arsène Wenger) would have to display a prolonged and extremely poor performance before the model would suggest that they should be fired. Use of a scheme that gave more weight to recent games or no weight to games more than, say, a season ago, would reduce the ability of managers to rest on the laurels of a historically strong performance. Finally, the technique outlined above could sensibly be applied to other industries where the performance of those in leadership positions can be objectively measured.
Acknowledgements
The authors are very grateful to Simon Burke who provided extremely useful suggestions on the design of the methodology used in this paper. We would also like to thank Graham Mackrell from the League Managers Association (LMA) for providing the data pertaining to managerial sackings/resignations and David Matthews for his assistance with data collection.
Notes
1Association football is commonly referred to as ‘soccer’ in the USA in order to distinguish the game from American football. Throughout the paper, we use the term ‘football’ rather than ‘soccer’.
5However, since it would be very difficult to construct a plausible cumulative measure of net transfer spending, we do not consider this issue further.
6An increase in transfer expenditure of a similar figure leads to only a 0.1 fall (0.07 rise) in the expected number of points, although as we note, these parameter estimates are not statistically significant.
8Three of the best performing managers were from Chelsea, the club with the highest budget in the Premier League over the sample period.
9We should again note here that Bobby Robson managed only four games within our sample period and therefore, as we argue below, this is not really a sufficient number to effectively evaluate his performance.
References
- Allen, D. E. and Tan, M. L. (1999) A test of the persistence in the performance of UK managed funds, Journal of Business Finance and Accounting, 25, 559–593. doi: 10.1111/1468-5957.00267
- Audas, R., Dobson, S. and Goddard, J. (2002) The impact of managerial change on team performance in professional sports, Journal of Economics and Business, 54, 633–650. doi: 10.1016/S0148-6195(02)00120-0
- Balduck, A. and Buelens, M. (2007) Does sacking the coach help or hinder the team in the short term? Evidence from Belgian soccer, University of Gent Working Paper 2007/430. Available from: http://www.feb.ugent.be/nl/Ondz/wp/Papers/wp_07_430.pdf [Accessed 20 January 2011].
- Blake, C. A. and Morey, M. (2000) Morningstar ratings and mutual fund performance, Journal of Financial and Quantitative Analysis, 35, 451–483. doi: 10.2307/2676213
- Bollen, N. P. B. and Busse, J. A. (2005) Short-term persistence in mutual fund performance, Review of Financial Studies, 18, 569–597. doi: 10.1093/rfs/hhi007
- Brady, C., Bolchover, D. and Sturgess, B. (2008) Managing in the talent economy: the football model for business, California Management Review, 50, 54–73. doi: 10.2307/41166456
- Bridgewater, S. (2009) What is the impact of changing football manager? University of Warwick Business School Working Paper, Available from: http://www.wbs.ac.uk/downloads/news/2009/10/what-is-the-impact-of-changing-football-manag.pdf [Accessed 18 December 2010].
- Bruinshoofd, A. and ter Weel, B. (2003) Manager to go? Performance dips reconsidered with evidence from Dutch football, European Journal of Operations Research, 148, 233– 246. doi: 10.1016/S0377-2217(02)00680-X
- Burt, D. (2007) Mourinho picks up {\pounds}18m and prepares to depart England, The Independent, 22 September. Available at http://www.independent.co.uk/sport/football/news-and-comment/mourinho-picks-up-pound18m-and-prepares-to-depart-england-403153.html [Accessed 21 January 2011].
- Carhart, M. M. (1997) On persistence in mutual fund performance, Journal of Finance, 52, 57–82. doi: 10.1111/j.1540-6261.1997.tb03808.x
- Chevalier, J. and Ellison, G. (1999) Are some mutual fund managers better than others? Cross-sectional patterns in behavior and performance, Journal of Finance, 54, 875–899. doi: 10.1111/0022-1082.00130
- Clark, J. (2010) Back on Track? The Outlook for the Global Sports Market to 2013, PriceWaterhouseCoopers, May, London.
- Cuthbertson, K., Nitzsche, D. and O'Sullivan, N. (2008) UK mutual fund performance: skill or luck, Journal of Empirical Finance, 15, 613–634. doi: 10.1016/j.jempfin.2007.09.005
- De Paola, M. and Scoppa, V. (2008) The effects of managerial turnover: evidence from coach dismissals in Italian soccer teams, Journal of Sports Economics, 13(2), 152–168. doi: 10.1177/1527002511402155
- Effron, B. and Tibshirani, R. J. (1993) An Introduction to the Bootstrap, Monographs on Statistics and Applied Probability, Chapman and Hall, New York.
- Fama, E. F. and French, K. R. (1993) Common risk factors in the returns on stocks and bonds, Journal of Financial Economics, 33, 3–56. doi: 10.1016/0304-405X(93)90023-5
- Fifield, D. (2010) Carlo Ancelotti gets Chelsea backing despite miserable run, The Guardian, 29 December. Available format http://www.guardian.co.uk/football/2010/dec/29/carlo-ancelotti-chelsea-backing [Accessed 21 January 2011].
- Frick, B. and Simmons, R. (2008) The impact of managerial quality on organizational performance: evidence from German soccer, Managerial and Decision Economics 29, 593–600. doi: 10.1002/mde.1431
- Grinblatt, M. and Titman, S. (1992) The persistence of mutual fund performance, Journal of Finance, 47, 1977–1984. doi: 10.1111/j.1540-6261.1992.tb04692.x
- Herbert, I. (2010) Benitez gives {\pounds}96,000 to Hillsborough families, The Independent, 11 June 2010. Available at http://www.independent.co.uk/sport/football/premier-league/benitez-gives-16396000-to-hillsborough-families-1997094.html [Accessed 21 January 2011].
- Hope, C. (2003) When should you sack a football manager? Results from a simple model applied to the English premiership, Journal of the Operational Research Society, 54, 1167– 1176. doi: 10.1057/palgrave.jors.2601621
- Hughes, M., Hughes, P., Mellahi, K. and Guermat, C. (2010) Short term versus long term impact of managers: evidence from the football industry, British Journal of Management, 21, 571–589.
- Jensen, M. C. (1968) The performance of mutual funds in the period 1945–1964, Journal of Finance, 23, 389–416. doi: 10.1111/j.1540-6261.1968.tb00815.x
- Jones, D., Rawnsley, P. and Switzer, A. (2010) Annual Review of Football Finance, 19th edn, Deloitte Sports Business Group, June, Manchester.
- Kosowski, R., Timmermann, A., White, H. and Wermers, R. (2006) Can mutual fund ‘stars’ really pick stocks? New evidence from a bootstrap analysis, Journal of Finance, 61, 2551–2595. doi: 10.1111/j.1540-6261.2006.01015.x
- McTeer, W., White, P. and Persad, S. (1995) Manager coach mid-season replacement and team performance in professional team sport, Journal of Sport Behavior, 18, 58–68.
- Salomo, S. and Teichmann, K. (2000) The relationship of performance and managerial succession in the German Premier Soccer League, European Journal for Sport Management, 7, 99–119.
- Tonks, I. (2005) Performance persistence of pension fund managers, Journal of Business, 78, 1917–1942. doi: 10.1086/431447