
Abstract
Planning for future energy-efficient and energy-producing buildings requires specific knowledge during the design process. Many design decisions taken by urban planners –form, density, roof type and orientation – have a significant effect on the conditions of such buildings, although urban planners might not always be aware of the effect of their design. This study examines the effects of important design decisions on the solar energy potential of net zero energy solar buildings. Typical Swedish building blocks with varying form, density, roof type and orientation were used to simulate the annual solar irradiation and energy production, and to calculate the load match for heating and electricity under Swedish conditions. Results of this study show that the urban density is the most influential parameter on the solar potential of building blocks. Furthermore, flat roofs often returned the highest load match value, while the effect of orientation on the solar potential turned out not to be that straightforward. With the results of this study, urban planners can make better informed decisions, while it also provides a ground for the net zero energy solar buildings discussion by exposing the boundaries of such buildings in the urban environment.
1. Introduction
Future buildings need to comply with strict rules concerning their supply and demand energy balance; not only do they need to reduce their energy demand, they should also produce a considerable part of their own energy locally with renewables. In Europe, this is secured in the European Directive for the energy performance of buildings (European Parliament, Citation2010), requiring member states to build ‘nearly’ zero energy buildings.
These nearly zero energy buildings can be seen as a derivative of the net zero energy buildings (NZEB), which is a grid-connected, ‘energy efficient building able to generate electricity or other energy carriers from renewable energy sources in order to compensate for its energy demand’ on an annual basis (Sartori, Napolitano, & Voss, Citation2012). For both the nearly zero energy building and the NZEB, the production of on-site renewable energy is mentioned; which in most cases results in the installation of active solar energy technologies. Currently, there is a lack of knowledge of how much solar energy can contribute to the production of on-site renewable energy to cover the energy demand of buildings in cities. Also, there is a lack of knowledge how urban planning decisions may affect the solar potential of future buildings.
1.1. Towards NZEBs in Sweden
As an EU member state, Sweden will have to follow the EU directive on nearly Zero Energy Buildings, even though a clear definition of the nearly Zero Energy is currently lacking. The concept of the similar NZEB has gained much attention lately, for instance in the IEA SHC Task 40 / EBC Annex 52 and in literature (Aelenei & Gonçalves, Citation2014; Berggren, Wall, Flodberg, & Sandberg, Citation2012; Hall, Geissler, & Burger, Citation2014; Marszal et al., Citation2011; Sartori et al., Citation2010). How the different concepts relate to each other in the Swedish context is illustrated in Figure .
Figure 1. Visualisation of different energy concepts (adapted from Igor Sartori et al. (Citation2012)).
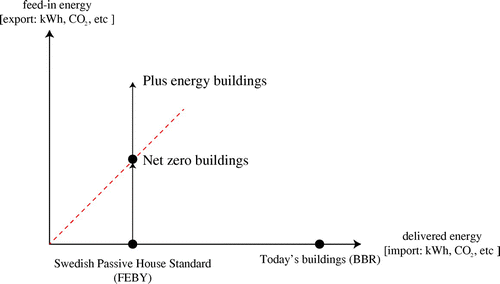
The least ambitious energy goal for a building in Sweden is by complying with the current Swedish Building regulations BBR (Boverket, Citation2013a). The Swedish National Board of Housing, Building and Planning, which issues the building regulations, considers the current energy demands (90 kWh/m2a for heating and common electricity in the South of Sweden) as nearly zero (Boverket, Citation2013b). Interestingly, only the energy demand side is included in the current building regulations, not the production side.
One rank higher is the passive house, defined by the Swedish Passive House Standard, setting stricter requirements for the energy demand of building, although not on on-site renewable production. The next step is the NZEB, which uses as much energy as it produces. The highest ambition energy goal is the plus energy building, which produces more energy as it needs over a year.
In this study, a nearly zero energy building is considered to be a NZEB, but without the requirement to balance the entire energy demand. Only the energy demand of heating, DHW and common electricity is taken into account (excluding plug load).
Only limited literature is available on how to actually build NZEBs in Sweden (Berggren et al., Citation2012; Flodberg, Citation2012) and these studies focused on office buildings. Other literature shows often the achievement of a net zero energy balance in single-family houses and offices (Cellura, Guarino, Longo, & Mistretta, Citation2014; Gallo, Molina, Prodanovic, Aguilar, & Romero, Citation2014; Mohamed, Hasan, & Sirén, Citation2014; Pikas, Thalfeldt, & Kurnitski, Citation2014). Only some studies focus on buildings in denser environments like city centres (Hachem, Athienitis, & Fazio, Citation2014; Hachem, Fazio, & Athienitis, Citation2013), where access to solar energy might be limited due to shading of other buildings.
1.2. The influence of urban planning on solar energy access
Since the majority of our future buildings will be built in cities, it becomes very important that proper conditions for these buildings are assured during the urban planning process; especially for solar access since this has effect on both the energy use and a possible energy production. IEA SHC Task 51 called Solar Energy in Urban Planning has commenced last year with the objective to provide support for urban planners to increase the implementation of solar energy in cities. Sweden is a member of this task; hence collaboration was set up between the urban planning departments of the cities of Lund and Malmö (South Sweden) and the Swedish participants of Task 51. Short workshops and meetings were held with local urban planners, where it became clear that urban planners are willing to implement solar energy, but it is unclear for them how to reach this goal. This is partly caused by the fact that the urban design phase is both dependant on the decisions taken on a national level and decisions taken in a later phase (building design and implementation phase); a process illustrated in Figure .
Figure 2. An overview of the different phases in the urban planning process and involved actors.
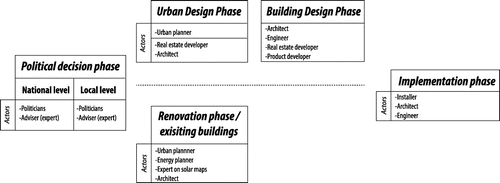
The Swedish zoning plan determines the density of cities, the shape of buildings, the height, inclination of roofs, roof types, function, etc. Conditions for solar energy – both passive and active – are therefore indirectly set by the design of such a plan, which could lead to further constraints in the design phase if buildings e.g. get too much shaded (Kanters, Dubois, & Wall, Citation2012). Besides, the fact is that urban planners – often unconsciously – design the conditions for solar energy, municipality and city administrations, and hardly have any legal instruments to require the implementation of solar energy. For example, Swedish city administrations are not allowed to prescribe a certain technology to use as renewable energy source, like solar or wind energy, but they are limited to set neutral energy type recommendations. Only if the municipality or city owns the land where future urban districts or buildings are planned, they are allowed to set additional energy requirements. Furthermore, some voluntary initiatives like the ‘climate contract’ in Hyllie, Malmö were born to stimulate all involved actors to work towards an increasing share of locally produced renewable energy.
To help energy planners to set realistic energy goals for future buildings and for urban planners to understand their impact on solar energy conditions, the objectives of this study are partly to examine the limitations of solar powered NZEBs and partly to look into the effect of early urban planning design decisions – mainly density, orientation, roof type and form.
2. Method
In order to analyse the effect of design decisions, simulations were performed with the program DIVA4RHINO (Jakubiec & Reinhart, Citation2011); a program which is able to simulate the solar irradiation within a CAD environment. The simulations were run with climate data from Lund (Sweden) generated from the Meteonorm program (METEOTEST, Citation2009). DIVA4RHINO uses Radiance to simulate the solar irradiation. Table shows the Radiance settings used in the simulations. Results from the simulations were exported and post-processed.
Table 1. Settings of radiance.
2.1. Geometry set-up and parameters
Four different design parameters were explored in this study: the design of the urban building blocks, the orientation, roof type and density.
In collaboration with the urban planning departments, four typical building block designs were identified. They can be seen in Figure with their respective names: Strip 50 × 50 m, Closed 80 × 0 m, Closed 50 × 50 m and U-form 50 × 50 m. The metres are referring to the width and length of the plot. All building blocks had a depth of 12 metres.
Figure 3. The used geometries and parameters.
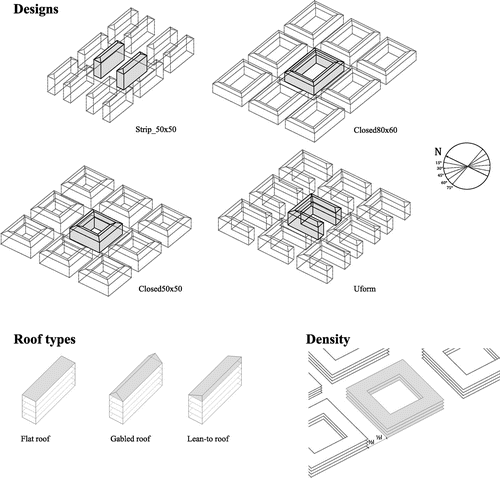
The studied roof types are shown in Figure and are called flat, gabled and lean-to. In the zoning plan, urban planners can set the roof type or they can specify the boundaries of the roof of buildings. These three roof types are rather common in the zoning plans developed in the early phase and were therefore included in this study.
The parameter density is an important parameter in urban planning. The Floor Space Index is often used to express the density of an urban district, but can however be defined in different ways. In Swedish urban planning, a metrics called ‘building block index’ is used, which is the total floor area of the building divided by the plot area + ½ of the surrounding street area. In this study, this metric is called Floor Space Index (FSIbbi). In all simulations, the streets are considered to be 15 metres wide. The density is varied by adding and/or removing floors in order to reach a ‘target FSIbbi’ of .5, 1, 1.5, 2 and 2.5 (a rather common range for Swedish cities).
The fourth parameter is the orientation seen from South, which varied from 0°, 15°, 30°, 45°, 60° and 75° towards East (see Figure ).
2.2. Load matching
Most studies focus mainly on the production side of solar energy in cities. Energy policy-makers and real estate owners are however interested in which contribution renewable energy can deliver in relation to the consumed energy, called load matching. The term Solar Fraction is used when the energy is produced with active solar systems. The first step needed for determining the load match is the calculation of the heat and electricity need. The current Swedish building regulations (BBR) were taken as the first set of requirements for the energy demand. The second alternative was the FEBY voluntary criteria for low-energy buildings from the Swedish Centre for Zero Energy Buildings. Both the BBR and FEBY provide the required energy demand, but do not specify the division between heating and electricity. This is done to provide flexibility when designing the energy system in the building. In this study, the following electricity and heating demands were used (Table ).
Table 2. Electricity and heating demand according to the two standards BBR and FEBY (values in kWh/m2a).
For every simulation option, the floor area was calculated, resulting in the total electricity and heating demand according to BBR and FEBY.
The second step was simulations with DIVA4RHINO of annual irradiation on the building envelope, which was divided in a 1 × 1 m grid (both façades and roof). The simulations resulted in a list of surfaces with their respective area and irradiation level. The surfaces were then divided into four categories: unsuitable, reasonable, good and very good. Surfaces were designated into one of these categories based on their collected amount of annual irradiation; these amounts are displayed in Table .
Table 3. Threshold values for different categories (values in kWh/m2a).
These threshold values were based partly on categories used in a local solar map (Kraftringen, Lunds kommun, Lunds Tekniska Högskola, & Solar Region Skåne, Citation2012), but are also based on previous studies by the authors (Kanters & Horvat, Citation2012; Kanters, Wall, & Dubois, Citation2014; Kanters, Wall, & Kjellsson, Citation2014). In this study, the PV panels and ST collectors were assumed to be parallel to the actual roof/façade. For every simulation option, the surface area (in m2) and the total amount of irradiation (kWh) was summarised per category. Then, the produced energy was calculated from the total irradiation. For ST, an efficiency of 40% was taken, for PV an efficiency of 15% was taken. A 25% reduction of surface areas was applied to all suitable areas due to fenestration on the façade and installations on the roof. The division between PV and ST area was considered to be 50–50%. The final load matching was then calculated by dividing the annual production of solar energy systems with the annual energy demand. It should be noted that a load matching of 100% could be reached. This might not always be considered as realistic: if owners of a solar energy system do not have the possibility to store the energy or deliver it to the grid, then the produced energy is wasted. In Sweden, only some electricity providers accept solar electricity in their grid and reward producers financially for that. There are hardly any district heating companies willing to accept solar heat in their grid. The load matches in this study therefore provide more of a theoretical boundary than a very realistic scenario today.
3. Results and discussion
This section will first present a discussion about a new metric for solar potential and then discuss the results of the simulations.
3.1. SAFARn: a new metric for the solar potential
There are ambivalent definitions for the ‘solar potential’ of buildings in literature. Compagnon defined it as ‘the percentage of building envelope which receives an amount of solar radiation greater than or equal to the preset thresholds’ (Compagnon, Citation2004), while others define it as the potential energy which can be produced (Araya-Muñoz, Carvajal, Sáez-Carreño, Bensaid, & Soto-Márquez, Citation2014; Kodysh, Omitaomu, Bhaduri, & Neish, Citation2013; Lukač, Žlaus, Seme, Žalik, & Štumberger, Citation2013; O’Brien, Citation2010). These two definitions differ a lot; the first one defines more the performance of the design of a building, not so much how much energy is produced and is in that sense a more qualitative metric.
This metric can therefore be seen as a first ‘quick’ metrics for expressing the solar potential of a building. Nault, Rey, and Andersen (Citation2013) used Compagnon’s metric to evaluate the urban solar potential of six urban projects and noted some drawbacks of it: (1) the binary nature of the metric (a certain threshold is met or not), (2) lack of relation between potential production and expected needs and (3) the set thresholds are technology-dependent. Not only are the thresholds for active solar energy technology-dependent, it should also be noted that they are dependent on the location. Since annual irradiation differs per location, thresholds should differ too. Local thresholds are important but have proven hard to set; something which is shown in an analysis of the threshold values used in solar maps, which often were based on ‘experience in the field’ rather than, for instance, on payback time (Kanters, Wall, & Kjellsson, Citation2014).
The balance between possible production and expected needs is an important link to the discussion of NZEBs. Compagnon’s metric is related to the façade area, not the floor area; which normally determines the energy need. Therefore, an alternative metric is introduced in this article called SAFARn (Suitable Area to Floor Area Ratio), with the n to be the threshold value in kWh/m2a (Equation (1)).(1)
where SAFARn = Suitable Area to Floor Area Ratio; As: Suitable Area (Area receiving an amount of solar radiation greater than or equal to the preset threshold n) (m2); and Afl: Floor Area of the considered building (m2).
The SAFARn can be more than 100% (for example, in the case of a villa where the roof area and suitable parts of the façades together are bigger than the floor area).
If we compare the metrics of Compagnon (active solar potential) and SAFARn in the case of one design with four different roof types (averaged for all orientations), significant differences can be seen (Figure ).
Figure 4. Solar potential as the percentage of building envelope which receives an amount of solar radiation greater than or equal 650 kWh/m2a (after Compagnon (Citation2004)). Solar potential as the percentage of the building envelope which receives an amount of solar radiation greater than or equal 650 kWh/m2a related to the floor area (SAFAR650).
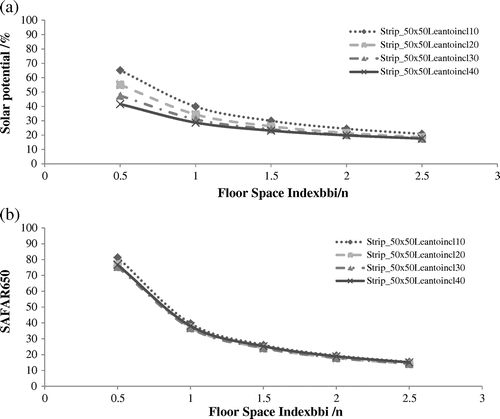
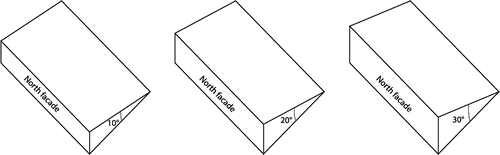
By taking Compagnon’s metrics (Figure (a)), the roof type with the lowest roof inclination outperforms the options with the highest roof inclination. The SAFARn metric hardly shows any difference between the four options. The reason why Compagnon’s metric show a higher potential for the lowest inclination is the fact that by increasing the angle, the larger the North façade gets (Figure ); leading to a lower solar potential. Since the SAFARn is linked to the floor area, not the façade area, the metric changes.
Figure 5. Increasing the inclination of the roof enlarges the North façade.
For all design options, the SAFAR650 is plotted against the density in Figure .
Figure 6. SAFAR650 for all design options (averaged for all orientations).
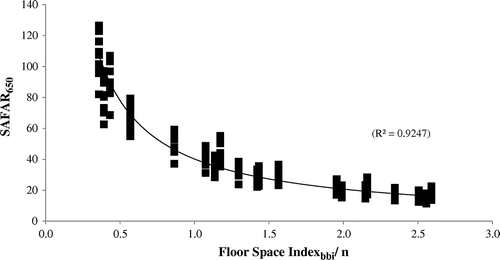
The SAFAR650 graph shows a graph similar to a power function. One reason to use the SAFARn metric is that it might be a way to prepare a Swedish zoning plan for solar energy. Since urban planners are not allowed to prescribe a certain use of a technology in the zoning plan, it should be possible to use the SAFARn metric, since it is officially energy-neutral (although its threshold are indirectly based on active technologies). It could be compared to the ‘Green Area Factor’ used in the city of Malmö, which is an instrument to ensure vegetation, openness and permeability of ground surface in new areas in Malmö (Lindberg, Citation2012). The Green Area Factor is a useful instrument which assures urban planners, but mostly real estate owners and architects to think and discuss the green areas in and around future buildings.
3.1.1. Sensitivity analysis
During workshops and meetings with urban planners, it came forward that urban planners were only partly aware of their influence on the conditions for solar energy in urban environments. In the following sections, the results of the parametric study – concerning density, roof type and orientation – are shown. The influence of design decisions of the urban building blocks is indirectly apparent. For each parameter, the implications on urban planning are discussed.
3.2. Density
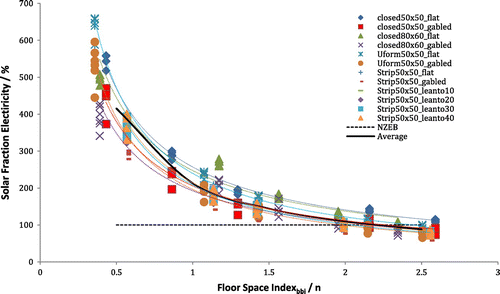
The results of a fitted quadratic model showed that the FSI was the most sensitive parameter. Since the electricity demands according to the BBR and FEBY standard are similar (Table ), the load matching is similar. The results of the load matching for electricity and the requirements of BBR and FEBY are shown in Figure (averaged for all orientations, 50% ST, 50% PV and all suitable area is used).
Figure 7. FEBY/BBR load matching for electricity demand.
The results for the heating load matching for FEBY and BBR are shown in Figures and (note the difference range on the solar fraction axis).
Figure 8. FEBY load matching for heating demand.
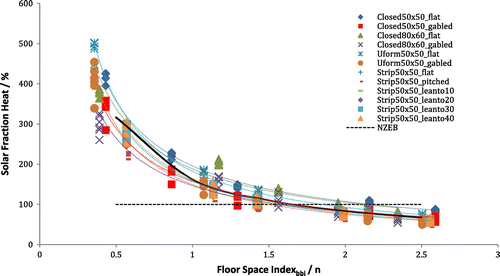
Figure 9. BBR load matching for heating demand.
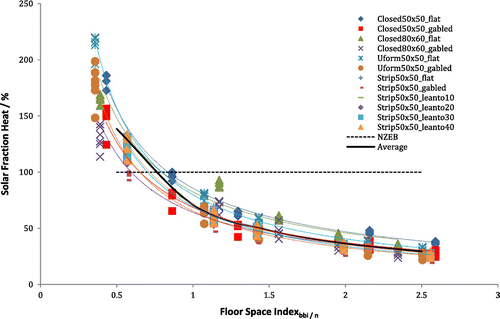
The results displayed in Figures – show roughly the same pattern. The line showing the average of all options displays a power function; a notion which will be further elaborated in the next subsection. There is a clear relationship with the SAFAR650 graph in Figure , since they are connected through the suitable area, efficiency of the active solar technologies, floor area and energy demand.
A 100% electricity load match can be reached for the BBR and FEBY standards at low densities. At densities higher than ~2.25, most of the building block configurations do not reach a 100% load match anymore. The highest electricity load match is achieved for the option Uform50 × 50flat, while at roughly the same density, Closed80 × 60gabled returned only 50% of the load match of Uform50 × 50flat, which is a very significant difference. Especially for the lower densities, the differences between the design options are the largest; at higher densities, the differences are almost neglectable.
For the heating load matching, the same pattern is visible for Figures and , although the absolute values differ. With the FEBY standards, a density lower than 1.5 achieves a load match of at least 100% (Figure ). Uform50 × 50flat also performs best here at a density of ~.4, while Closed80 × 60gabled performs worst around this same density. Also here, differences between the design options get smaller at higher densities. With the current BBR requirements, it is hard to achieve a 100% load match for heating (Figure ); the density would need to be below .5.
3.2.1. Generalisations of results
To plan for energy efficient cities, it would be beneficial for energy and urban planners to work with rules of thumb. To produce such rules of thumb, the average value for the load matching for heating and electricity for all design options and orientations was plotted in Figures –. The equation of these lines were explored; taking the following parameters into account: the ratio PV-ST, the electricity and heating demand, and the density. The orientation was averaged per option and density, and is therefore not part of these equations. This resulted in the following set of equations:(2)
(3)
(4)
where Rpv = Ratio of Photovoltaics [-]; Rst = Ratio of Solar Thermal [-]; LPV: Electricity load matching with photovoltaic systems [%]; Qelectricity: Annual electricity demand [kWh/m2]; d = Density (Floor Space Index) [-]; LST: Heating load matching with photovoltaic systems [%]; Qheat = Annual heat demand [kWh/m2]; d = Density (Floor Space Indexbbi) [-].
In Figure , the generalised load matching for electricity is drawn (note that the blue line is similar to the line in Figure ).
Figure 10. Load matching for electricity demand (generalised).
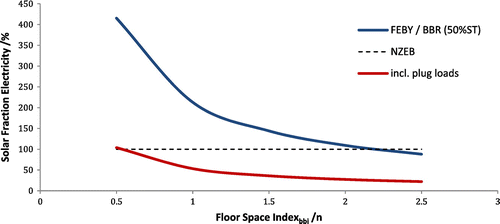
In the load matching for electricity, the plug load was not included. The FEBY and BBR standards only set requirements on the electricity for the mechanical equipment, e.g. fans and pumps. When planning for new residential buildings, an additional 30 kWh/m2a is taken as a template value used for the plug load (SVEBY, Citation2012). The red line in Figure illustrates that, by taking the plug load into account, it is very hard to reach a 100% load matching, even for the lower densities.
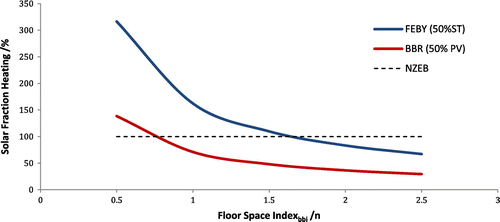
In Figure , it can be seen that energy reduction for heating is a valid strategy since it is hard to reach a 100% cover for heating for higher densities.
Figure 11. Load matching for heating demand (generalised).
3.2.2. Consequences for urban planning
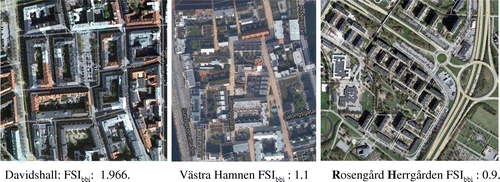
Current density levels in Malmö and Lund range between 1.0 and 2.0 (Larsvall, Citation2010): a selection of some urban districts with their densities can be seen in Figure .
Figure 12. Densities of some districts in Malmö.
How dense can we plan our future sustainable cities? Energy use is not the only factor when planning for sustainable cities, although earlier studies describe that energy demand of buildings has by far the most influence on the environmental improvement factor (van den Dobbelsteen & de Wilde, Citation2004). Another study demonstrates that the urban density is negatively correlated with urban private transport energy use (Liddle, Citation2013). Reducing buildings’ energy demand and make expertly plans for the urban development seem to be a good and important strategy ahead.
3.3. Roof type
In this section, the effect of the roof type is analysed. The load match for heating according to the BBR standards is taken as a basis to compare the effect of roof types. For every option displayed in Table the maximum value was normalised and the other options were related to this maximum.
Table 4. Relative difference for the Strip options. The option label is built as following “Design type”, “density” and “orientation”, e.g. Strip_0.5_0.
The results show that in the majority of the cases, the flat roof returns the highest value. This is interesting since it was expected that in most cases, the lean-to roofs would generate the highest production. The strip option consists of two strips (see Figure ); Roofs with a high inclination will therefore shade the stroke behind the first stroke more. The biggest relative difference between the different roof types was 32%. Furthermore, it can be seen that the gabled roof never has the highest load match, although in some cases it is rather close to the maximum. This means that in reality, the well-oriented parts of the gabled roof receive a higher amount of solar radiation, but that a large part of the roof receives less than the threshold value due to its orientation. However, the investment costs per m2 of installed solar system are lower since the irradiation per m2 is higher.
Table shows the relative differences between flat and gabled roofs in case of other design options: Closed50 × 50, Closed80 × 60, and Uform50 × 50 (Figure ). In none of the cases, the gabled roof had a higher load match. The biggest difference was 36%.
Table 5. Relative differences between flat and gabled roofs. The option label is built as following “Design type”, “density” and “orientation”, e.g. Closed50 × 50_0.5_0.
3.3.1. Consequences for urban planning
The results show that a flat roof often produces the highest load match, while in some cases the lean-to roof was better. In this study, the PV panels and ST collectors were assumed parallel to the actual roof/façade. A flat roof however raises the question of how to set up a PV system efficiently (row distance and inclination); an issue which can significantly determine the production of the whole system (Kanters & Davidsson, Citation2013). The results show that the type of roof affects the possibilities for utilising solar energy significantly. In this study, the gabled roof and the lean-to roof were options, but in reality, the consequences for some of these options would be significant. A lean-to roof with an inclination of 40° and a building with a width of 12 m would result in a height of 10 m (see Figure ) which resembles multiple stories.
Figure 13. Consequences of roof types on building height.
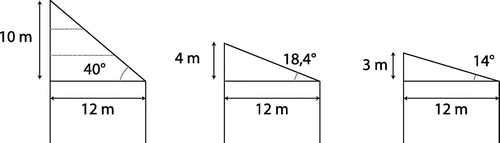
A more reasonable inclination would be one floor height, e.g. 3 or 4 m (Figure ). This would result in an inclination of 14° and 18°, respectively. A lean-to roof with a lower inclination (10° or 20°) would not produce the highest amount, but in some cases, it produces more than a flat roof.
3.4. Orientation
Table shows the effect of the orientation of building blocks on the load match. The results were normalised per option.
Table 6. Orientation sensitivity analysis.
Table shows that there is no apparent optimal case, except that the maximum is often achieved at orientations between 15° and 60°. The worst performance was in this case the Closed80 × 60_gabled roof with an orientation of 30°, with almost 29% difference.
3.4.1. Consequences for urban planning
Designing zoning plans with closed urban building blocks ease the importance of choosing which orientation should prevail. By rotating the building block slightly, all façades get access to solar energy. Also, daylight conditions get more equal on all façades.
3.5. Share of roof and façade
Façades are also valuable areas to place PV or ST, especially in cases when we want to exploit the sun to its full potential. In all simulations, division was made between roof and façades, and both façades and roofs were categorised by means of the threshold values shown in Table .
Focusing on the irradiation on all suitable areas, it can be seen that the share of suitable roof and façade changes per option (Figure ).
Figure 14. The share of irradiation on all suitable areas (roof and façade) per design type.
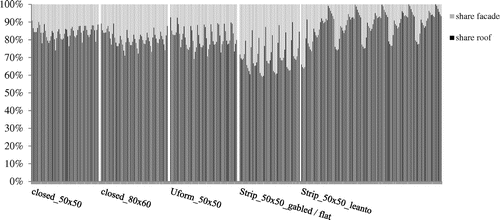
Figure shows that especially the options of the Strip_50 × 50_gabled/flat design have a higher share of suitable façade area than other options. This type also gives the largest variations. Furthermore, it can be seen that options in the Strip_50 × 50_leanto design have some very high shares of suitable roof area, and even in some cases when the share is 100%, i.e. no façade area was found suitable.
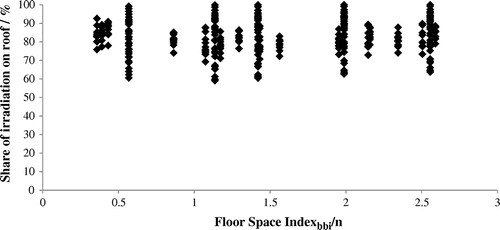
In Figure , the share of the roof of the total irradiation vs. the density is displayed. For all densities, it could be seen that the range varies significantly, depending on the design. It should be noted that this graph only shows the share of the roof of all irradiation (and indirect the façade) of all suitable areas.
Figure 15. Share of irradiation on roof vs. density.
3.5.1. Dissemination of results: website
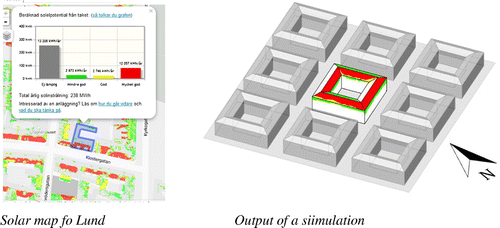
Within the Swedish part of the project Task 51, our goal is to inform urban planners about the role solar energy could play in the urban planning process as well as the impact on future energy supply of cities. Therefore, a website (www.solarplanning.org) was set up where urban planners could enter and compare different design alternatives with each other. Per simulation option, a picture was exported and the same categorisation and colours were used as a local solar map (Kraftringen et al., Citation2012) (Figure ). The website is an additional communication channel to urban planners.
Figure 16. The same categorisation and colours were used in the simulation results of building blocks as in the solar map.
4. Conclusions
Designing buildings that are energy efficient and even energy producing requires a high competence level amongst architects and urban planners. The zoning plan developed in the early urban planning stage already frames the conditions for solar energy for buildings in the urban context. The shape of building blocks, density, roof shape and orientation are the main design decisions that urban planners take and which are determined in the zoning plan. This study examines the effect of these design decisions on the active solar potential of buildings in the urban context, while also looking at the boundaries for net zero energy solar buildings in the Swedish context.
The concept of the NZEB has been a way to market, design and construct buildings that in general are more energy efficient than regular buildings. NZEBs often implement solar energy as a provider of local, renewable energy. This study shows the possibilities and limitations of reaching a net zero energy balance in buildings placed in an urban context. Access to solar is more restricted in cities and the available suitable area per square metre living area is also limited. Reducing the energy demand in buildings will increase the possibilities to reach a net zero balance, especially if we need to take plug loads into account.
Results from this study show that the urban density is the most sensitive parameter. Also, it is shown that the relation between the load matching level and the urban density can be described as a power function. For lower densities and for the electricity load, urban densities had to be lower than FSI = 2.5 to reach a 100% load match, while for heating, it was harder to meet a net zero energy balance. In many of the building blocks, flat roofs instead of pitched roofs resulted in a higher load match, while gabled roofs never resulted in the maximum load match. This is due to that although parts of the roof get a higher solar irradiation, other parts get more shaded. A sensitivity analysis of the parameter orientation resulted in a less clear pattern, but roughly it can be said that orientation between 15° and 60° returned the highest load match. This study shows that the contribution of façades is rather limited in size, and since they receive less irradiation than the roof, also have a limited contribution in production. However, façade areas might be a feasible place to install solar energy systems if roofs are (partly) shaded, or to produce additional solar energy at those times that the optimally placed? solar systems are not producing at their peak.
In this article, the SAFARn metric is introduced, which is intended to provide Swedish urban planners an instrument to assess how well a zoning plan performs regarding the solar energy potential. The metric enables to set requirements on the design of a zoning plan within the legal framework in Sweden. The SAFARn metric has the objective to drive urban planners, architects and real estate developers to make well-informed solar energy decisions. Even though the real estate market has increased interest in implementing solar energy in buildings, the metric SAFARn will elucidate the solar potential and motivate involved actors to discuss how solar energy can be implemented in future building.
Another important point is the consequences of the considered time resolution on the NZEB concept. Even though a building might have an annual net zero energy balance, it often does not reach a net zero energy balance for every month of the year. This is especially true in the Northern European climate, where the highest energy need is mainly during winter, when the contribution of solar obviously is very limited. This requires an energy network that can provide “storage” and energy supply at the times when it is needed. The fictive energy network storage is depending on that there is an energy need somewhere else within the same timeframe as a local overproduction is fed into the network. Not reaching a net zero energy balance within the boundaries of the building or a group of buildings also asks for a discussion on what possibilities exist to achieve a net zero energy balance in another way. One example might be that inhabitants could invest in external solar fields, e.g. as the “BürgerInnen Solarkraftwerk” in Vienna (Wien Energie, Citation2012).
One of our goals in the project is to support urban planners, meaning that the knowledge gained in research needs to find its way to the common urban planning practice. One way to facilitate this is by setting up a website which provides a platform for urban planners to gain more knowledge about the results of this study. Further work and collaboration is needed in order to understand the needs, barriers and drivers for implementing solar energy in the urban planning process. This is part of the work within IEA SHC Task 51 Solar Energy in Urban Planning (see http://task51.iea-shc.org/).
Acknowledgement
We are grateful to Émilie Nault (EPFL) for discussing the method and analysis of the results.
Additional information
Funding
References
- Aelenei, L., & Gonçalves, H. (2014). From solar building design to net zero energy buildings: Performance insights of an office building. Energy Procedia, 48, 1236–1243. doi:10.1016/j.egypro.2014.02.14010.1016/j.egypro.2014.02.140
- Araya-Muñoz, D., Carvajal, D., Sáez-Carreño, A., Bensaid, S., & Soto-Márquez, E. (2014). Assessing the solar potential of roofs in Valparaíso (Chile). Energy and Buildings, 69, 62–73. doi:10.1016/j.enbuild.2013.10.01410.1016/j.enbuild.2013.10.014
- Berggren, B., Wall, M., Flodberg, K., & Sandberg, E. (2012). Net ZEB office in Sweden – A case study, testing the Swedish Net ZEB definition. International Journal of Sustainable Built Environment, 1, 217–226. doi:10.1016/j.ijsbe.2013.05.00210.1016/j.ijsbe.2013.05.002
- Boverket. (2013a). Boverkets föreskrifter om ändring i verkets byggregler (2011:6) - föreskrifter och allmänna råd. In: Boverket (Ed.). Retrieved from http://rinfo.boverket.se/BBR/PDF/BFS2013-14-BBR20.pdf
- Boverket. (2013b). Optimala kostnader för energieffektivisering/EN [Optimal costs for energy reduction]. Boverket.
- Cellura, M., Guarino, F., Longo, S., & Mistretta, M. (2014). Energy life-cycle approach in net zero energy buildings balance: Operation and embodied energy of an Italian case study. Energy and Buildings, 72, 371–381. doi:10.1016/j.enbuild.2013.12.04610.1016/j.enbuild.2013.12.046
- Compagnon, R. (2004). Solar and daylight availability in the urban fabric. Energy and Buildings, 36, 321–328. doi:10.1016/j.enbuild.2004.01.00910.1016/j.enbuild.2004.01.009
- European Parliament. (2010). Directive 2010/31/of the European Parliament on the energy performance of buildings.
- Flodberg, K. (2012). Very low energy office buildings in Sweden, simulations with low internal heat gains ( Licentiate Thesis). Lund University, Lund.
- Gallo, A., Molina, B. T., Prodanovic, M., Aguilar, J. G., & Romero, M. (2014). Analysis of net zero-energy building in Spain. Integration of PV, solar domestic Hot water and air-conditioning systems. Energy Procedia, 48, 828–836. doi:10.1016/j.egypro.2014.02.09610.1016/j.egypro.2014.02.096
- Hachem, C., Athienitis, A., & Fazio, P. (2014). Energy performance enhancement in multistory residential buildings. Applied Energy, 116, 9–19. doi:10.1016/j.apenergy.2013.11.01810.1016/j.apenergy.2013.11.018
- Hachem, C., Fazio, P., & Athienitis, A. (2013). Solar optimized residential neighborhoods: Evaluation and design methodology. Solar Energy, 95, 42–64. doi:10.1016/j.solener.2013.06.00210.1016/j.solener.2013.06.002
- Hall, M., Geissler, A., & Burger, B. (2014). Two years of experience with a net zero energy balance – Analysis of the Swiss MINERGIE-A® Standard. Energy Procedia, 48, 1282–1291. doi:10.1016/j.egypro.2014.02.14510.1016/j.egypro.2014.02.145
- Jakubiec, A., & Reinhart, C. (2011). DIVA 2.0: Integrating daylight and thermal simulations using Rhinoceros 3D, Daysim and EnergyPlus. Paper presented at the 12th Conference of International Building Performance Simulation Association, Sydney.
- Kanters, J., & Davidsson, H. (2013). Mutual shading of PV modules on flat roofs: A parametric study. Paper presented at the SWC 2013, Cancun, Mexico.
- Kanters, J., Dubois, M.-C., & Wall, M. (2012). Architects’ design process in solar-integrated architecture in Sweden. Architectural Science Review, 56, 1–11. doi:10.1080/00038628.2012.681031
- Kanters, J., & Horvat, M. (2012). Solar energy as a design parameter in urban planning. Energy Procedia, 30, 1143–1152. doi:10.1016/j.egypro.2012.11.12710.1016/j.egypro.2012.11.127
- Kanters, J., Wall, M., & Dubois, M.-C. (2014). Typical values for active solar energy in urban planning. Energy Procedia, 48, 1607–1616. doi:10.1016/j.egypro.2014.02.181
- Kanters, J., Wall, M., & Kjellsson, E. (2014). The solar map as a knowledge base for solar energy use. Energy Procedia, 48, 1597–1606. doi:10.1016/j.egypro.2014.02.18010.1016/j.egypro.2014.02.180
- Kodysh, J. B., Omitaomu, O. A., Bhaduri, B. L., & Neish, B. S. (2013). Methodology for estimating solar potential on multiple building rooftops for photovoltaic systems. Sustainable Cities and Society, 8, 31–41. doi:10.1016/j.scs.2013.01.00210.1016/j.scs.2013.01.002
- Kraftringen, Lunds kommun, Lunds Tekniska Högskola, & Solar Region Skåne. (2012). Solkartan [Solar map]. Retrieved from solkartan.se.
- Larsvall, M. (2010). reflexioner över stadsplaneringens vardagsfrågor [reflections on urban planning issues]. Malmö stad.
- Liddle, B. (2013). Urban density and climate change: A STIRPAT analysis using city-level data. Journal of Transport Geography, 28, 22–29. doi:10.1016/j.jtrangeo.2012.10.01010.1016/j.jtrangeo.2012.10.010
- Lindberg, S. (2012). Is biodiversity attractive? On-site perception of recreational and biodiversity values in urban green space. Alnarp, Sweden: Swedish University of Agricultural Sciences. Faculty of Landscape Planning, Horticulture and Agricultural Sciences.
- Lukač, N., Žlaus, D., Seme, S., Žalik, B., & Štumberger, G. (2013). Rating of roofs’ surfaces regarding their solar potential and suitability for PV systems, based on LiDAR data. Applied Energy, 102, 803–812. doi:10.1016/j.apenergy.2012.08.04210.1016/j.apenergy.2012.08.042
- Marszal, A. J., Heiselberg, P., Bourrelle, J. S., Musall, E., Voss, K., Sartori, I., & Napolitano, A. (2011). Zero energy building – A review of definitions and calculation methodologies. Energy and Buildings, 43, 971–979. doi:10.1016/j.enbuild.2010.12.02210.1016/j.enbuild.2010.12.022
- METEOTEST. (2009). Meteonorm. Switzerland: Bern.
- Mohamed, A., Hasan, A., & Sirén, K. (2014). Fulfillment of net-zero energy building (NZEB) with four metrics in a single family house with different heating alternatives. Applied Energy, 114, 385–399. doi:10.1016/j.apenergy.2013.09.06510.1016/j.apenergy.2013.09.065
- Nault, E., Rey, E., & Andersen, M. (2013). Early design phase evaluation of urban solar potential: Insights from the analysis of six projects. Paper presented at the 13th International Conference of the International Building Performance Simulation Association (IBPSA), Chambery, France.
- O’Brien, W. T. (2010). The relationship between net energy use and the urban density of solar buildings. Environment & Planning B, Planning & Design, 37, 1002–1021.
- Pikas, E., Thalfeldt, M., & Kurnitski, J. (2014). Cost optimal and nearly zero energy building solutions for office buildings. Energy and Buildings, 74, 30–42. doi:10.1016/j.enbuild.2014.01.03910.1016/j.enbuild.2014.01.039
- Sartori, I., Napolitano, A., & Marszal, A., Pless, S., Torcelli, I., & Voss, K. (2010). Criteria for definintion of net zero energy buildings. Paper presented at the EUROSUN 2010, Graz, Austria.
- Sartori, I., Napolitano, A., & Voss, K. (2012). Net zero energy buildings: A consistent definition framework. Energy and Buildings, 48, 220–232. doi:10.1016/j.enbuild.2012.01.03210.1016/j.enbuild.2012.01.032
- SVEBY. (2012). Brukarindata bostäder [user data for residential buildings]. Retrieved from http://www.sveby.org/wp-content/uploads/2012/10/Sveby_Brukarindata_bostader_version_1.0.pdf
- van den Dobbelsteen, A., & de Wilde, S. (2004). Space use optimisation and sustainability—Environmental assessment of space use concepts. Journal of Environmental Management, 73, 81–89. doi:10.1016/j.jenvman.2004.06.00210.1016/j.jenvman.2004.06.002
- Wien Energie. (2012). BürgerInnen Solarkraftwerke. Retrieved from www.buergersolarkraftwerk.at