
ABSTRACT
The focus of this research is to assess the impact of COVID-19 outbreak in 2020 on the Capital Bikeshare (CaBi) ridership in Washington, D.C. area compared to 2019. Correlation analysis was conducted and mixed-effects negative binomial (MENB) models were developed to assess CaBi ridership by the type of CaBi user, as the available bike-sharing trip data followed a time-series cross-section panel data structure and the variables (season, stay-at-home order and lift, and weekday) have time-specific effects. The correlation coefficients between CaBi variables, COVID-19 variables, and characteristics of D.C.’s population profile and their statistical significance are sensitive to the year (2019 or 2020), the season of the year (Winter, Spring, Summer, or Fall), and the type of CaBi user (member or casual user). The number of stations between pickups and drop-offs, and the dummy variables representing the before and after stay-at-home order and lift were found significant in the MENB models. There was no significant difference in travel time of CaBi casual users and members during the outbreak. Riding for leisure or commuting has been potentially limited with the stay-at-home order. The findings have practical implications and help bike-sharing operators to increase their resilience during unexpected situations such as the pandemic.
Introduction
The use of bicycles (referred to as bikes in this research) has been increasing over the years worldwide. In the U.S., it has become an effective transportation option, especially for short trips. According to the U.S. Census Bureau, bike commuting has increased by more than 60% nationwide since 2000 (McKenzie, Citation2014). Furthermore, bike-sharing systems have emerged and substantially grown in New York, Chicago, and Washington, D.C. during the past decade.
Capital Bikeshare (CaBi), one of the largest bike-sharing systems in North America (largest network by far in Washington, D.C.), was officially launched in 2010. As of the year 2021, CaBi had 5,000 bikes spread over 600+ stations across seven jurisdictions: Washington (District of Columbia), Arlington County (Virginia), the City of Alexandria (Virginia), Montgomery County (Maryland), Prince George’s County (Maryland), Fairfax County (Maryland), and the City of Falls Church (Virginia) (Capital Bikeshare (CaBi), Citation2021a). Bikes are available 24 hours a day year-round and can be rented for a relatively nominal fee based on annual membership, 30-day membership, 3-day pass, 24-hour pass, and single trip plans (Capital Bikeshare (CaBi), Citation2021a).
On 7 March 2020, the District of Columbia announced the first COVID-19 case, declared the disease a public health emergency on March 11, and registered its first COVID-19 death on March 20 (District of Columbia (D.C.) Policy Center, Citation2020). On March 24, all non-essential businesses were requested to close (District of Columbia (D.C.) Policy Center, Citation2020). Businesses such as dine-in services at restaurants were banned, requiring them to operate on takeout or delivery-only capacity. D.C. schools and universities began distance learning. The stay-at-home order issued on 30 March 2020 (District of Columbia (D.C.) Government, Citation2020) by D.C.’s Mayor, Muriel Browser, reinforced the city’s direction to residents to stay at home to flatten the COVID-19 curve and prevent the D.C. community from the increase in the numbers of cases and patients. Unfortunately, these numbers increased and was reported equal to 3,475,797 COVID-19 cases and 49,199 patients by 31 December 2020 (District of Columbia (D.C.). Government, Citation2021).
As a micro-mobility system and an alternate and sustainable transportation option (Barbour et al., Citation2019), bike-sharing has the potential to alleviate the public health fear of crowded public transit systems due to the COVID-19 outbreak (Jobe & Griffin, Citation2021). Also, biking has been recommended by the Centers for Disease Control and Prevention (CDC) because it is one of the forms of transportation that minimizes close contact with others (Centers for Disease Control and Prevention (CDC), Citation2021). Bike-sharing makes socially distant transit possible while providing health benefits and low‐impact exercise to its users in addition to lessening carbon emissions and mitigating traffic congestion (Bullock et al., Citation2017; Fishman et al., Citation2014; Marshall & Ferenchak, Citation2019).
CaBi users’ perception and behavior towards shared mobility have changed in some ways and have led to greater or lesser bike-sharing ridership due to the COVID-19 outbreak, specifically, the related measures to slow its spread and people’s concerns on contracting the virus. Kanik (Citation2020) presented some interesting insights into the impact of the decisions made by cities about the COVID-19 outbreak on bike-sharing ridership in six U.S. cities: San Francisco Bay area, New York City, Boston metro, D.C. metro, Portland (Oregon), and Columbus (Ohio). Overall, there has been less bike-sharing ridership. People have been traveling less with the stay-at-home orders. Moreover, in the case of the Washington, D.C. area, vicinities of pharmacies and grocery stores were found among the top destinations of CaBi users in 2020 (Kanik, Citation2020).
While literature documents some findings, it is not comprehensive on how the impact varies with the type of bike-sharing user, season, stay-at-home order and lift. The focus of this research is to assess the impact of COVID-19 outbreak in 2020 on the CaBi ridership in Washington, D.C. area compared to the 2019 year while considering the seasonal effects. The daily number of trips and average travel time from and to different CaBi stations are examined based on the population profile in D.C. area. Also, the impact on CaBi ridership due to decisions made by the D.C. Government to tackle the COVID-19 outbreak is elucidated. The findings from this research have practical implications and help bike-sharing operators to increase their resilience during unexpected situations such as the pandemic.
The remainder of the paper is organized as follows. The first section presents a review of past research on bike-sharing ridership. The methodology used for the impact assessment is described in the following section. The results are then presented and discussed, followed by conclusions of the research.
Literature review
The literature review section is divided into two subsections, research on bike-sharing that was conducted before and after the COVID-19 outbreak.
Research on bike-sharing before the COVID-19 outbreak
Several efforts were expended on bike-sharing use prior to the COVID-19 outbreak. Fishman (Citation2016) reviewed the literature on bike-sharing in North America, Asia, Europe, and Australia. Among several themes that emerged from the review, convenience was the major motivator for bike-sharing use (Fishman, Citation2016). Faghih-Imani et al. (Citation2014), Noland et al. (Citation2016), Wergin and Buehler (Citation2017), Chen et al. (Citation2018), Sun et al. (Citation2018), and Caspi and Noland (Citation2019) studied bike-sharing ridership, pickups, and drop-offs for different days of the week (weekdays and weekend days), times of the day (peak hours and off-peak hours), types of the user (members and casual users), age groups (youngers and elders), income groups (low income, medium, and high income), andat different geographic area levels (city, traffic analysis zone, census block, bike route, and bike station).
Bike-sharing ridership was explored with consideration of different land use categories, demographics, socio-economic characteristics, proximity to transit, bike infrastructure, andweather conditions (Faghih-Imani et al., Citation2014; Noland et al., Citation2016; Sun et al., Citation2018; Wang et al., Citation2016; Wergin & Buehler, Citation2017). Pucher et al. (Citation2011), Buck et al. (Citation2013), Akar et al. (Citation2013), Goodman and Cheshire (Citation2014), and Harms et al. (Citation2014) focused more on the socio-demographics of bike-sharing users. For instance, Buck et al. (Citation2013) found that CaBi users were, on average, younger than regular cyclists. The average age of regular bikers is 42 years, whereas both CaBi casual users and members with the annual membership aged 34 or 35 years old, on average. Faghih-Imani et al. (Citation2014), Noland et al. (Citation2016), Chen et al. (Citation2017), and Shen et al. (Citation2018) found that areas with higher population density, more youngsters, higher income levels, and more bike infrastructure generate more bike ridership. Caspi and Noland (Citation2019) and Shaheen and Cohen (Citation2019) indicated that bike-sharing users are often younger, white males with higher education degrees and upper-to-middle income. Bike-sharing casual users are more likely to ride for leisure, while registered members ride more for commuting (Kaviti et al., Citation2019; McKenzie, Citation2019; Wang & Lindsey, Citation2019). Wergin and Buehler (Citation2017) observed strong differences in trip characteristics between types of bike-sharing members. Their findings indicate that trips made by short-term bike-sharing users were longer in distance, slower than long-term bike-sharing users’ trips, and concentrated in and around a mall, whereas long-term bike-sharing users’ trips were more predominant in mixed-use neighborhoods.
Bike-sharing is considered a sustainable mode of transportation since it does not involve harmful emissions while providing flexibility and convenience (Barbour et al., Citation2019). In addition, to be a valuable alternative to reduce vehicle trips in urban areas, such an argument was also supported by Fishman et al. (Citation2014), Shaheen et al. (Citation2016), and Lu et al. (Citation2018). Jia et al. (Citation2021) explored bike-sharing behavior affected by public transportation disruption in Washington, D.C. during the metro shutdown. Spatio-temporal analysis revealed that bike-sharing members and casual users ride on weekdays and weekend days, respectively. Moreover, ridership by casual users increased by 191% on the day of the metro shutdown.
Generalized regression methods like Poisson, negative binomial, and zero-inflated negative binomial distribution-based models were used to study bike-sharing ridership (Faghih-Imani et al., Citation2014; Noland et al., Citation2016; Wang et al., Citation2016). Barbour et al. (Citation2019) used the random parameter logit model to explore potential vehicle-trip substitution by bike-sharing ridership.
Research on bike-sharing after the COVID-19 outbreak
According to the U.S. Bureau of Transportation Statistics (BTS), docked bike-sharing ridership decreased by 44% in Spring 2020 (March, April, and May of 2020) compared with Spring 2019 (BTS, Bureau of Transportation Statistics (BTS), Citation2020). This reduction in bike-sharing ridership was attributed to the COVID-19 outbreak that occurred in the U.S. in March 2020. In cities such as New York, CitiBike ridership decreased by 71% in 2020, while subway trips dropped by 90% in February and March 2020 compared with the same period in 2019 (Teixeira & Lopes, Citation2020). The average travel time increased from 13 min to 19 min, indirectly implying that some transit users would have shifted to bikes (Teixeira & Lopes, Citation2020). Wang and Noland (Citation2021) found evidence of bike-sharing resiliency when comparing bike-sharing ridership to subway ridership in New York City. Research by Hu et al. (Citation2021) also led to the same conclusion after comparing bike-sharing with transit in Chicago.
These studies provide clues for transitioning to a post-COVID-19 society where bike-sharing can be a substitute for subway use (Osorio et al., Citation2022). Such a conclusion was earlier claimed by Campbell and Brakewood (Citation2017) who found a reduction in bus ridership after introducing bike-sharing. The relationship between transit ridership and bike-sharing ridership could be not only complementary but also substitutive. Further evidence was found in Budapest (Hungary) where public transportation dropped by 80% due to the COVID-19 outbreak, while the use of personal bikes and bike-sharing experienced the lowest decrease of 23% and 2%, respectively (Bucsky, Citation2020). Similarly, Nikiforiadis et al. (Citation2020) showed that the number of bike-sharing users is not substantially affected by the COVID-19 outbreak in Thessaloniki (Greece). The lower decrease in bike-sharing ridership is explained by the fact that people considered bike-sharing as a safer mode to limit contact during the outbreak (Hu et al., Citation2021). In Chicago, transit, taxi, and ride-hailing services were considered the highest risky modes of transportation from the residents’ perspective (Shamshiripour et al., Citation2020).
Hu and Chen (Citation2021), Bonasccorsi et al. (Citation2020), and Pase et al. (Citation2020) measured the impact of the COVID-19 outbreak based on the economic status of the population. People in wealthier areas were observed to socially distance themselves compared to those who live in impoverished areas. The outbreak affected more areas with higher fiscal capacity (Bonasccorsi et al., Citation2020). Adjei-Fremah et al. (Citation2022) revealed that there was high variability in the early transmission of the COVID-19 across the geographic regions (wards) in Washington, D.C., and this variability was positively associated with area deprivation index (ADI), age, and race.
Li et al. (Citation2021) and Padmanabhan et al. (Citation2021) assessed the impacts of the COVID-19 on bike-sharing trips in 2020 during the initial wave of the outbreak using interrupted times series approach and random parameters ordinary least squares model estimations, respectively regardless of the seasonal effects. Kim (Citation2021) used quantitative analysis and negative binomial models to compare patterns of bike-sharing ridership in 2019 and 2020 based on trip history data, weather data (temperature, humidity, wind speed, and precipitation), population, and some other attributes related to people’s points of interest such as companies, tourist attractions, parks, schools, and universities.
Overall, past research did not fully integrate the seasonal effects while assessing the impact of the COVID-19 outbreak on bike-sharing ridership. This research addresses this gap by measuring the impact the outbreak had on CaBi ridership in Washington, D.C. area in 2020 in comparison with the 2019 year while considering the seasonal effects. The CaBi variables, i.e. the daily number of trips and the average travel time from and to different CaBi stations, were also examined. Correlations between COVID-19 cases, COVID-19 patients, CaBi variables, and the population profile by ward during 2019 and 2020 are investigated. Finally, mixed-effects negative binomial (MENB) models of the daily number of trips are developed for CaBi members and casual users since they might have been affected differently.
Many statistical techniques such as multiple regression assume that the observations in a dataset are independent, i.e. they cannot be correlated with one another. However, CaBi ridership might vary from one season to another. Moreover, within a season in 2020, the ridership could have varied with the COVID-19 outbreak after the issue of the stay-at-home order followed by its lift. Therefore, mixed-effects models are proposed in this research to account for unobserved heterogeneity and avoid potentially biased estimation results.
Methodology
Washington, D.C. is considered as the study area. The two-step approach proposed in this research is to: (1) conduct an exploratory analysis and examine correlations between the number of CaBi trips, COVID-19 positive cases (referred to as cases), and the population profile in 2019 and 2020 with regard to seasons, and (2) assess the impact of COVID-19 outbreak on CaBi ridership using MENB models with random effects components that estimate the extent to which the ridership varies across seasons and before and after the stay-at-home order and lift.
Data description
Four types of data from three sources were used. The bike-sharing trip history data were obtained from the CaBi system data (Capital Bikeshare (CaBi), Citation2021b), while the road network was downloaded as a shapefile from Open DC data (Citation2022). COVID-19 data are available on the D.C. website dedicated to the COVID-19 surveillance (District of Columbia (D.C.). Government, Citation2021) and are provided as a comma-separated file. The daily numbers of cases and patients are the two COVID-19 variables of interest in this research. The population profile split in terms of demographics, socio-economics, and transportation mode used, and COVID-19 cases by ward can also be accessed from the Open DC data (Citation2022).
The bike-sharing trip history data contains basic trip information. Details such as the trip start time and end time, station names of the pickup and drop-off locations, their geographic coordinates, the user’s membership type, the bike ID, and bike type (regular or electric bike) are provided for the majority of trips. The 2019 and 2020 years were considered to account for the before and after the COVID-19 outbreak. The daily numbers of COVID-19 cases and patients are available from 6 May 2020, and 1 April 2020, respectively (District of Columbia (D.C.). Government, Citation2021). However, COVID-19 cases from the Open DC data (Citation2022) were used in this research since the data are provided for the eight wards of the Washington, D.C. area, and are available from 1 April 2020. The population profile is disaggregated by ward and based on the employment status, mode of transportation, income level, number of households, males, and females.
Data processing
CaBi data are available at the trip level and were aggregated to the day level to match the COVID‐19 data. The following variables were created using the raw data: total number of trips, average travel time, day of the week, COVID-19 cases, and COVID-19 patients. Travel times are times between CaBi pickups and drop-offs.
Since Washington, D.C. is the study area, only trips that started and ended at D.C.’s CaBi stations were considered. Data cleaning, which is an intrinsic part of any data analysis, was performed. It includes the removal of data errors caused by imperfect data collection and removal of anomalous or incomplete information regarding CaBi trips. Screening of outliers was also conducted during the data evaluation process. CaBi ridership was also aggregated based on D.C.’s wards to explore their correlations with COVID-19 cases and the D.C.’s population profile.
Data evaluation and modeling
The shortest trip in Fall 2019 clocked zero minutes while the longest was a 1437-minute trip (approximately, a 24-hour trip). Such trips that are excessively short or long have to be removed from the data. Trips with less than 1-minute duration were removed since they are potentially false starts or users are trying to re-dock a bike to ensure it is secure (Capital Bikeshare (CaBi), Citation2021b). In other words, a 1-minute trip was considered as the lower bound. Kaviti (Citation2018) found that CaBi trips that exceed the length of 120 minutes (2 hours) are mostly outliers. Thus, considering a 120-minute trip as the upper bound, 0.51% of CaBi trips were removed from the dataset to avoid any bias in the results.
Both, CaBi trip history data and COVID-19 data were divided into four quarters of the year to account for the seasonal effects. Quarters are described as follows.
1st quarter, Winter (from December of the previous year to February of the current year)
2nd quarter, Spring (from March to May)
3rd quarter, Summer (from June to August)
4th quarter, Fall (from September to November)
Correlations between COVID-19 cases, COVID-19 patients, CaBi variables, and the population profile were explored using Pearson correlation coefficients and considering quarters individually in 2019 and 2020. To estimate trip generation densities and visualize areas of different levels of CaBi activities, daily CaBi trips were aggregated at the station level for the 2019 and 2020 years. Kernel density was computed to better visualize and identify locations where more CaBi trips were generated and to allow a spatial comparison between 2019 and 2020.
To further assess the outbreak impacts on CaBi trips made by registered members and casual users, the MENB models were applied to account for unobserved heterogeneity caused by spatial and temporal dependencies of some variables of interest used in this research. The variables are related to the seasonal effects, COVID-19 cases, the stay-at-home order, and its lift that went into effect respectively on 1 April 2020 and 29 May 2020.
Results and discussions
Exploratory data analysis
Descriptive statistics of COVID-19 and CaBi data were computed to notice changes in COVID-19 positive cases, COVID-19 patients, the daily number of CaBi trips, and average travel time throughout the 2019 and 2020 quarters. Minimum, maximum, mean, median, standard deviation and ratio are summarized in and for CaBi variables and COVID-19 variables, respectively.
Table 1. Descriptive statistics of CaBi variables by quarter of the 2019 and 2020 years
Table 2. Descriptive statistics of COVID-19 variables by quarter of the 2020 year
indicates that the number of stations from which CaBi trips were generated in 2020 decreased at least by 13%, but not more than 17%, through quarters. Compared to 2019ʹs first quarter, CaBi trips increased by 15% in 2020. However, they decreased by 62% in the second quarter, by 37% in the third quarter, and by 29% in the fourth quarter. The drastic reduction in CaBi trips in the second quarter could be explained by the COVID-19 outbreak and the stay-at-home order to flatten the COVID-19 curve and prevent the D.C. community from the increase in the number of cases and patients. People shifted to remote work, therefore, reducing CaBi ridership. The average travel time remained the same in the first quarter of 2020 compared with the same period in 2019. shows that it increased by 29% in the second 2020 quarter, 24% in the third quarter, and 6% in the fourth quarter. These general observations align with results from Padmanabhan et al. (Citation2021) in the case of bike-sharing in New York City, Boston, and Chicago where bike-sharing systems experienced a decrease in the number of trips but an increase in the average travel time during the COVID-19 outbreak. The increase in travel time could be justified by the fact that CaBi users traveled for longer distances than usual, preferring the bike-sharing system rather than the public transit since bikes promote social distancing. Both, numbers of trips and average travel times within quarters are spread out. The standard deviation of CaBi trips is closer to the mean, particularly in the second quarter. In the case of average travel times, standard deviations are closer to the means throughout the four quarters.
COVID-19 cases increased gradually over the subsequent quarters as indicated in . The number of COVID-19 patients followed a different trend. Compared with the first quarter, the number of patients increased suddenly in the second quarter, whereas it decreased in the third and fourth quarters.
Standard deviations show the average amounts in variability of COVID-19 cases and patients. A minimum of 28 COVID-19 cases and 19 COVID-19 patients lie from their respective means. D.C. Government seemed to have adequately responded to the COVID-19 outbreak. The mean of daily number of COVID-19 cases decreased in the third and fourth quarters in comparison with the second quarter. A 38% decrease and 8% decrease were registered in the third and fourth quarters. The mean of COVID-19 patients decreased gradually from 236 in the second quarter of the year 2020 to 101 in the fourth quarter of the same year. These reductions in COVID-19 cases and patients may be due to the travel restrictions imposed to all to prevent the spread of the disease within the D.C. community. Although COVID-19 data are available, they have few drawbacks. Delays in testing and reporting refrain health departments and CDC from providing more accurate data since updates are made over time as they receive more complete information. Also, not every infected person will be a patient, and some patients need more medical care than others and need to stay longer at hospitals.
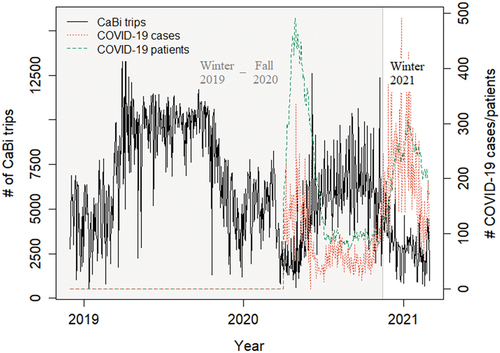
To visualize the variations in CaBi and COVID-19 data, CaBi trips, COVID-19 cases, and COVID-19 patients were plotted at the day level as shown in . Both data show variations over time and periodically. Furthermore, when COVID-19 cases and patients increased, CaBi trips decreased in the same period, implying potential causal-effect relationships. Alternatively, CaBi trips increased when COVID-19 cases and patients decreased. In the figure, the gray area limits the study period, whereas data for Winter 2021 were added to visually confirm trends in variations of CaBi trips and COVID-19 cases and patients. However, it is unclear if reduction in ridership is only due to the outbreak. For instance, CaBi experienced substantial reduction in ridership in the first quarter of the year for both the before and after the outbreak. There is a need to assess to what extent the outbreak had an impact on CaBi ridership while accounting for the seasonal effects and other possible contributing factors.
Figure 1. Daily CaBi trips and COVID-19 cases and patients.
Washington, D.C. area is divided into eight wards. Descriptive statistics of the D.C.’s population profile are presented in . The data are disaggregated by ward. The population profile is assumed to be constant throughout the 2019 and 2020 years.
Table 3. Descriptive statistics of the population profile
Correlation analysis
Correlations between CaBi variables and characteristics of the population profile were examined. To determine the level of correlation present between variable pairs and select those that did not exhibit strong interdependence and multicollinearity, Pearson correlation coefficients were computed. The coefficient of 0.50 was considered the threshold for strong correlation. Using the spatial join feature in ArcGIS Pro 2.10.1, CaBi trips were aggregated based on the eight wards of the Washington, D.C. area. Pearson correlation coefficients were then computed.
presents correlation coefficients between the daily number of CaBi trips, the number of stations from which trips were generated, the average travel time in 2019, and characteristics of D.C.’s population profile. Strong positive and significant correlations were found between the number of stations and the number of daily trips, the number of households, the population of +16 years old who commute to work, and the population +16 years old who walk to commute to work or use other means of transportation rather than cars, trucks, vans or public transportation. Although statistically not significant at the 95% confidence level or higher, strong negative correlations were found between the number of stations and the population of +16 years old who use cars, trucks, or vans to commute to work.
Table 4. Correlations between CaBi variables and the population profile (demographics, socio-economics, and transportation)
Similar positive and negative correlations were noticed between the number of daily trips and characteristics of the population profile. Exclusively for CaBi members, positive correlations between the number of daily trips and the population of +16 years old who commute to work and use other means of transportation than cars, trucks, vans or public transportation were found significant. In the case of casual users, correlation between the number of trips and the population of +16 years old who use cars, trucks, or vans to commute to work is found negative and significant.
Regarding the average travel time between pickups and drop-offs, correlations with characteristics of the population profile are mostly negative for CaBi members and positive for casual users. However, whatever the type of CaBi user, correlations are not significant at the 95% confidence level. Only correlations between the average travel time and the number of households and per capita income were found significant during Fall 2019 for casual users.
As it was inferred from , COVID-19 cases and patients are strongly correlated. The computed correlation coefficients for Spring, Summer, and Fall of the year 2020 are respectively 0.8, 0.8, and 0.7. Correlations for Spring and Fall are significant at the 99% confidence level (2-tailed). Correlations between COVID-19 variables, CaBi variables, and characteristics of the population profile were examined to identify highly correlated variables as their inclusion in the MENB models might yield biased results. The population profile was split into demographics related to socio-economics and those of transportation. Their respective correlations with CaBi variables and COVID-19 cases were computed and are presented in . Values in frames represent significant correlations coefficients.
Figure 2. Correlations between COVID-19 cases, CaBi variables and population profile (demographics and socio-economics) in 2020.
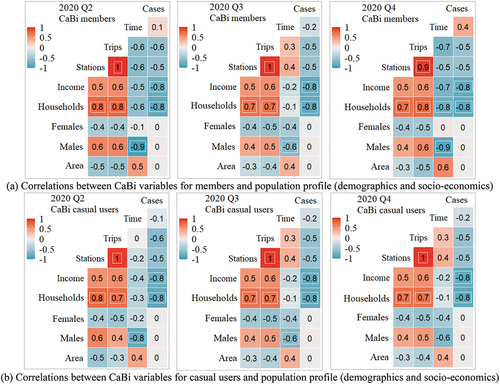
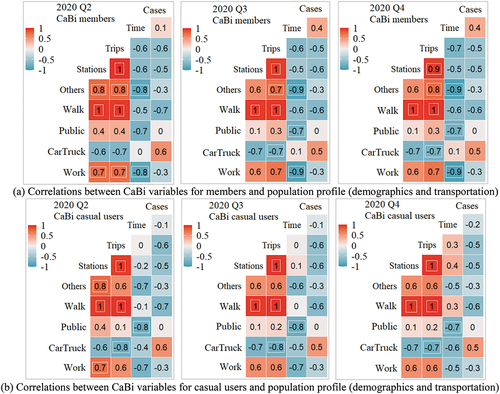
Figure 3. Correlations betweenCOVID-19 cases, CaBi variables and population profile (demographics and transportation) in 2020.
indicates that throughout the COVID-19 time in 2020, the number of cases is negatively and highly correlated with the number of households in a ward, as well as with per capita income at the 95% confidence level. While highly correlated with each other, the number of stations and trips made by both registered and casual users increased with the number of households, and inversely. Contrary to 2019, the travel time between stations and the male population have a negative and strong correlation with each other regardless of the season, except for Fall 2020 in the case of casual users.
indicates that there is no significant correlation between the population profile in terms of transportation mode and COVID-19 cases. However, their correlations with CaBi variables differ based on the season and the type of CaBi user. In 2020, the number of trips and stations are positively correlated with the population of +16 years old who walk to work irrespective of the season of the year and the type of CaBi user.
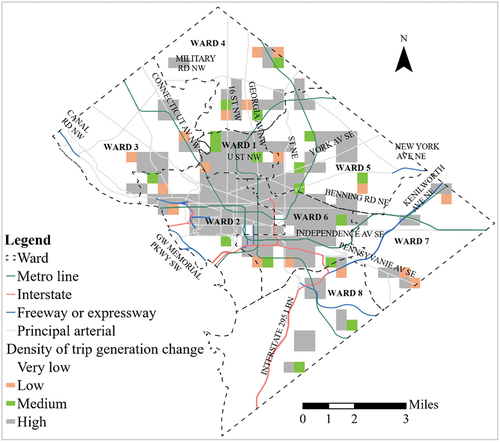
Figure 4. Density map of the 2019-to-2020 change in average daily trip generation.
From March to November of the same year, strong and positive correlations were found between the number of trips made by CaBi members and the number of pickup stations they used, and the population +16 years old who commute to work using other means rather than cars, trucks, or vans. Particularly for Spring 2020, the correlation of this category of the total population with the number of stations was strong and increased highly. In the same season, the numbers of trips and stations were positively correlated with the population who commute to work. Travel times between pickups and drop-offs have a strong negative correlation with both the population who commute to work and the category who use other transportation means. Regarding casual users, the number of trips they made from Spring to Fall 2020 decreased with the population of +16 years old who use cars or trucks to commute to work. The travel time between stations and the population of +16 years old are also negatively correlated during the same period. Exceptionally for Spring 2020, the number of stations is positively correlated with the category of the population that does not rely on cars, trucks, vans, or public transportation. Moreover, their travel times have a negative correlation with the population that commutes to work using public transportation.
Overall, the levels of correlation between CaBi variables, COVID-19 variables, and characteristics of D.C.’s population profile, the values of correlation coefficients, and their statistical significance are sensitive to the year (2019 or 2020), the season of the year (Winter, Spring, Summer, or Fall), and type of the CaBi user (member or casual user).
Trip generation densities
This section focuses on spatially identifying areas of very low, low, medium, and high CaBi trip generation based on the CaBi station names and their geographic coordinates. 61,303 CaBi trips in 2020 (representing 3.27% of the total number of CaBi trips in the same year) were not considered due to the lack of CaBi station names and/or inaccurate geographic coordinates.
shows changes in the average daily trip generation as a density map using Kernel density estimation analysis. Differences in trips generated in 2020 and 2019 were computed and used to identify areas of different levels of trip generation change according to the following criteria based on the 2019 CaBi trip data: >13 daily trips per square mile (high change in trip generation), ≤13 and >5 daily trips per square mile (medium change in trip generation), ≤5 and >1 daily trips per square mile (low change in trip generation), and ≤1 daily trips per square mile (very low change in trip generation). Areas with very low change in trip generation also comprise the scenario where there were possibly more trips in 2020 compared to 2019. The mean and median of daily CaBi trips per station in 2019 are 19 and 11, respectively. Also, there are between 102 and 106 stations in 2019 that fell into each level of change in trip generation.
In 2019, high CaBi activities were more aggregated in the center of Washington, D.C., and areas along the metro line. In 2020, as shown in , those areas experienced a substantial reduction in CaBi trip generation. This could be explained by the fact that CaBi is also used as a first-and-last mile mobility means, and since public transit does not allow efficient social distancing, people refrained from using the CaBi system around the metro line. Moreover, the stay-at-home order forced businesses to shift to remote working, decreasing the use of public transit.
MENB models
Both the seasonal effects, the number of COVID-cases, and the stay-at-home order and lift issued to minimize the impact of the outbreak could have led to unobserved heterogeneity and serial correlations with CaBi ridership. Standard Poisson and negative binomial models seem to be inappropriate since they require the CaBi ridership data to be uncorrelated in time and the assumed effects on ridership are fixed. Therefore, MENB models are proposed to assess the impacts the COVID-19 outbreak had on CaBi ridership throughout quarters of the year while accounting for other factors including the stay-at-home order and lift. The results from exploratory analysis and correlation analysis indicate that CaBi members and casual users are differently associated in 2019 and 2020 quarters with CaBi variables (number of trips, travel time, and day of travel), COVID-19 variables (number of cases and patients, stay-at-home order and its lift), and D.C.’s characteristics of the population profile (demographics, socio-economics, and transportation) in terms of levels of correlation and values of correlation coefficients. Additionally, findings from recent bike-sharing research by Jia et al. (Citation2021) indicate that bike-sharing members and casual users ride on weekdays and weekend days, respectively. Therefore, MENB models were developed in order to measure the scope of each explanatory variable that could vary individually respective to the type of the CaBi user.
The negative binomial models were preferred to correct the variance-to-mean ratios of the ridership of CaBi members and that of casual users. Their means (variances) are respectively 3414.9 (2,133,386) and 1702.2 (2,289,014). The MENB models contain fixed effects of the day of the week (weekdays and weekend days), the average travel time between pickup and drop-off stations, the number of stations from which trips were generated, the number of daily COVID-19 cases, the stay-at-home order, and its lift. In addition, three levels of randomness structure (season, stay-at-home order, and stay-at-home lift) were incorporated. Four MENB models with log-link distribution were fitted by maximum likelihood (Laplace approximation). Each model is nested with two or three random-slope structures and three random-intercept structures. Different combinations of variables of interest were made and the appropriateness of the MENB models were confirmed based on the corrected variance-to-mean ratio and the goodness-of-fit statistics. A dummy-coding scheme for the weekday, the stay-at-home order, and the stay-at-home lift were used. Weekend days, the period before April 1, and the period before 29 May 2020 were respectively considered as the reference levels and therefore coded as 0 in the MENB models.
and present MENB models of ridership for CaBi members and casual users, respectively. The model comparison points out that MENB 1, MENB 2, and MENB 4 have the highest Akaike information criterion (AIC) and Bayesian information criterion (BIC) regardless of the CaBi user. In addition, the model with a more complex random effect structure (MENB 4) has fewer number of significant fixed-effect variables. Meanwhile, the model with the random slopes of average travel time and number of stations (MENB 3) has a significantly better fit to the CaBi ridership data regardless of the type of CaBi user. MENB 3 has the lowest AIC and BIC on top of a quasi-perfect overdispersion parameter. The results from MENB 3 in and indicate that the number of stations between pickup and drop-off stations, the stay-at-home order, and its lift had significant impacts on ridership of both CaBi members and casual users. Besides the variability due to the random effects, the difference between MENB 3 for CaBi members and casual users relies on the significance of an additional fixed-effects variable, i.e. weekday, that impacted ridership of casual users.
Table 5. MENB Models for ridership of CaBi members
Table 6. MENB models for ridership of CaBi casual users
From the results of MENB 3 for CaBi members, for every one station increase, assuming other explanatory variables are constant, the difference in the logs of expected number of CaBi daily trips is expected to increase by 0.02041, exponentiating this gives 1.021. This implies a 2.1% increase in the number of trips. Regardless of the influence of other variables, there is a 14.9% decrease in daily trips after the stay-at-home order, and a 115.0% increase in daily trips following the period of the stay-at-home lift.
The standard deviation for by-season, by-stay-at-home order, and by-stay-at-home lift random slopes of the number of stations indicate that the daily number of trips varied around the average slope of 2.1%-increase, respectively by about 0.13%, 0.30%, and 0.35%. The estimates of MENB 3 in indicate that there was a 60.2% decrease in the number of daily trips made by casual users during the stay-at-home order period, assuming no influence of other factors. CaBi experienced a 114.3% increase in casual trips after the lift of the stay-at-home order. When shifting from a weekday to a weekend day, the impact on the daily number of CaBi trips by casual users is much more noticeable with a decrease of 11.1%.
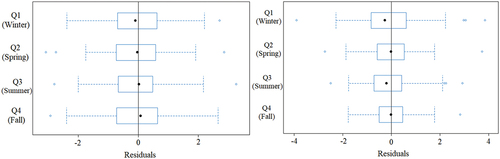
shows diagnostics of MENB 3 that focused on the random effect structure through the seasonal effects in 2020. It indicates that there are some outliers and the differences in residuals between random effect levels are larger for MENB 3 of casual users compared with that of members. In the MENB 3 of CaBi members, the variability of trips within seasons is greater in the fourth quarter than in others. In the case of casual users, trips vary more in the first quarter.
Figure 5. MENB 3 diagnostics on the seasonal effects for CaBi members (left) and casual users (right).
Conclusions
The focus of this research was to assess the impact of the COVID-19 outbreak on the CaBi ridership in 2020 compared to 2019. Previous research assessed the impacts of the outbreak on bike-sharing systems without fully considering seasonal effects. The randomness effects of seasons as well as the stay-at-home order and lift on CaBi pickups in Washington, D.C. area was examined using MENB models for CaBi members and casual users.
The results revealed variations in daily ridership and inversely proportional relationship with COVID-19 cases and patients. The trend in 2020 implies a decrease in the daily number of trips whenever COVID-19 cases and patients increase. The correlation analysis confirmed a strong negative correlation between the daily CaBi ridership, the average travel time, and, both, COVID-19 cases and patients, especially during the second 2020 quarter (Spring). Overall, the levels of correlation between CaBi variables, COVID-19 variables, and characteristics of D.C.’s population profile, the values of correlation coefficients, and their statistical significance are sensitive to the year (2019 or 2020), the season of the year (Winter, Spring, Summer, or Fall), and type of the CaBi user (member or casual user).
In general, the daily number of trips and the number of stations from which they are generated are positively correlated with the number of households. The male population and the average travel time are negatively correlated. The number of COVID-19 cases has a strong negative correlation with the number of households and per capita income. Moreover, the number of daily trips and stations and the population of +16 years old who walk to work have a strong positive correlation. Particularly for CaBi members, the daily numbers of trips and stations have a strong positive correlation with the population of +16 years old who commute to work using other means of transportation rather than cars, trucks, vans, public transportation, or walking. This category of the population has more likely used bikes for commuting. A strong negative correlation was found between the number of daily CaBi trips and the population of +16 years old who commute to work using cars, trucks, or vans.
Also, CaBi experienced a substantial decrease in trip generation in 2020 compared to 2019. Washington D.C. area was divided into areas with four levels of trip generation change in 2020 with 2019 as the reference year. The results pointed out that the city center was more affected by this reduction in CaBi daily trips since many stations are in the first and second wards. These areas are identified as those of high trip generation change, i.e. where there were more than 13 daily trips per square mile compared to 2019.
MENB models were developed separately for CaBi members and casual users. The day of the week (weekdays and weekend days), the average travel time between pickup and drop-off stations, the number of stations from which trips were generated, the number of daily COVID-19 cases, the stay-at-home order, and its lift were considered in the fixed-effects component. Season, stay-at-home order, and stay-at-home lift were incorporated in MENB models to account for randomness in variations of the daily number of trips. The results revealed the significance of the number of stations between pickups and drop-offs, and the dummy variables for the before and after stay-at-home order and lift. For the MENB models for casual users, weekend days and weekdays have a significant impact on CaBi ridership. The stay-at-home order was effective since it led to a decrease in CaBi ridership regardless of the type of user. However, casual users were more impacted than registered members. Following the lift of the stay-at-home order, both ridership of CaBi members and casual users experienced a similar increase. Contrary to previous research that confirmed a significant difference in travel time of bike-sharing casual users and members (Kaviti et al., Citation2019; McKenzie, Citation2019; Wang & Lindsey, Citation2019), this research reveals that it was not the case during the COVID-19 outbreak. Riding for leisure or commuting has been potentially limited with the stay-at-home order.
There is still a need for more research from different perspectives. Autoregressive integrated moving average (ARIMA) and machine learning models may better quantify the COVID-19 impacts on the daily CaBi ridership. Trip destinations of CaBi members and casual users could also be explored based on the land use categories. Nevertheless, the results from this research provide practical implications and help bike-sharing operators to increase their resilience during unexpected situations such as the pandemic. Also, insights from this research could serve policy makers to improve sustainable mobility options such as biking and walking by making places more accessible and roads shared by all.
Disclaimer
This paper is disseminated in the interest of information exchange. The views, opinions, findings, and conclusions reflected in this paper are the responsibility of the authors only and do not represent the official policy or position of the University of North Carolina at Charlotte (UNC Charlotte) or other entity. The authors are responsible for the facts and the accuracy of the data presented herein. This paper does not constitute a standard, specification, or regulation.
Acknowledgments
The authors thank the Capital Bikeshare system and Open Data DC for their help with data used in this research.
Disclosure statement
No potential conflict of interest was reported by the author(s).
References
- Adjei-Fremah, S., Lara, N., Anwar, A., Garcia, D. C., Hemaktiathar, S., Ifebirinachi, C. B., Anwar, M., Lin, F. C., & Samuel, R. (2022). The effects of race/ethnicity, age, and area deprivation index (ADI) on COVID-19 disease early dynamics: Washington, DC case study. Journal of Racial and Ethnic Health Disparities, 9(1), 1–10. https://doi.org/10.1007/s40615-022-01238-1
- Akar, G., Fischer, N., & Namgung, M. (2013). Bicycling choice and gender case study: the Ohio state university. International Journal of Sustainable Transportation, 7(5), 347–365. https://doi.org/10.1080/15568318.2012.673694
- Barbour, N., Zhang, Y., & Mannering, F. (2019). A statistical analysis of bike sharing usage and its potential as an auto-trip substitute. Journal of Transport & Health, 12, 253–262. https://doi.org/10.1016/j.jth.2019.02.004
- Bonaccorsi, G., Pierri, F., Cinelli, M., Flori, A., Galeazzi, A., Porcelli, F., Schimdt, A. L., Valensise, C. M., Scala, A., Quattrociocchi, W., & Pammolli, F. (2020). Economic and social consequences of human mobility restrictions under COVID-19. Proceedings of the National Academy of Sciences, 117(27), 15530–15535. https://doi.org/10.1073/pnas.2007658117.
- Buck, D., Buehler, R., Happ, P., Rawls, B., Chung, P., & Borecki, N. (2013). Are bikeshare users different from regular cyclists? A first look at short-term users, annual members, and area cyclists in the Washington, DC, region. Transportation Research Record, 2387(1), 112–119. https://doi.org/10.3141/2387-13
- Bucsky, P. (2020). Modal share changes due to COVID-19: the case of Budapest. Transportation Research Interdisciplinary Perspectives, 8, 100141. https://doi.org/10.1016/j.trip.2020.100141
- Bullock, C., Brereton, F., & Bailey, S. (2017). The economic contribution of public bike-share to the sustainability and efficient functioning of cities. Sustainable Cities and Society, 28, 76–87. https://doi.org/10.1016/j.scs.2016.08.024
- Bureau of Transportation Statistics (BTS). (2020). Bikeshare ridership down 44% during COVID-19. https://www.bts.gov/newsroom/bikeshare-ridership-down-44-during-covid-19
- Campbell, K. B., & Brakewood, C. (2017). Sharing riders: how bikesharing impacts bus ridership in New York City. Transportation Research Part A: Policy and Practice, 100, 264–282. https://doi.org/10.1016/j.tra.2017.04.017
- Capital Bikeshare (CaBi). (2021a). Declare your Independence. https://www.capitalbikeshare.com/
- Capital Bikeshare (CaBi). (2021b). System data. https://www.capitalbikeshare.com/system-data
- Caspi, O., & Noland, R. B. (2019). Bikesharing in Philadelphia: do lower-income areas generate trips? Travel Behaviour and Society, 16, 143–152. https://doi.org/10.1016/j.tbs.2019.05.004
- Centers for Disease Control and Prevention (CDC). (2021). COVID-19 employer information for office buildings. https://www.cdc.gov/coronavirus/2019-ncov/community/office-buildings.html
- Chen, P., Zhou, J., & Sun, F. (2017). Built environment determinants of bicycle volume: A longitudinal analysis. Journal of Transport and Land Use, 10(1), 655–674. https://doi.org/10.5198/jtlu.2017.892
- Chen, P., Shen, Q., & Childress, S. (2018). A GPS data-based analysis of built environment influences on bicyclist route preferences. International Journal of Sustainable Transportation, 12(3), 218–231. https://doi.org/10.1080/15568318.2017.1349222
- District of Columbia (D.C.) Government (2020). Stay Home DC. https://coronavirus.dc.gov/stayhome
- District of Columbia (D.C.). Government (2021). COVID-19 surveillance. https://coronavirus.dc.gov/data
- District of Columbia (D.C.) Policy Center. (2020). A timeline of the D.C. region’s COVID-19 pandemic. https://www.dcpolicycenter.org/publications/covid-19-timeline
- Faghih-Imani, A., Eluru, N., El-Geneidy, A. M., Rabbat, M., & Haq, U. (2014). How land-use and urban form impact bicycle flows: Evidence from the bicycle-sharing system (BIXI) in Montreal. Journal of Transport Geography, 41, 306–314. https://doi.org/10.1016/j.jtrangeo.2014.01.013
- Fishman, E., Washington, S., & Haworth, N. (2014). Bike share’s impact on car use: evidence from the United States, Great Britain, and Australia. Transportation Research Part D: Transport and Environment, 31, 13–20. https://doi.org/10.1016/j.trd.2014.05.013
- Fishman, E. (2016). Bikeshare: A review of recent literature. Transport Reviews, 36(1), 92–113. https://doi.org/10.1080/01441647.2015.1033036
- Goodman, A., & Cheshire, J. (2014). Inequalities in the London bicycle sharing system revisited: Impacts of extending the scheme to poorer areas but then doubling prices. Journal of Transport Geography, 41, 272–279. https://doi.org/10.1016/j.jtrangeo.2014.04.004
- Harms, L., Bertolini, L., & Te Brömmelstroet, M. (2014). Spatial and social variations in cycling patterns in a mature cycling country exploring differences and trends. Journal of Transport & Health, 1(4), 232–242. https://doi.org/10.1016/j.jth.2014.09.012
- Hu, S., Xiong, C., Liu, Z., & Zhang, L. (2021). Examining spatiotemporal changing patterns of bike-sharing usage during COVID-19 pandemic. Journal of Transport Geography, 91, 102997. https://doi.org/10.1016/j.jtrangeo.2021.102997
- Hu, S., & Chen, P. (2021). Who left riding transit? Examining socioeconomic disparities in the impact of COVID-19 on ridership. Transportation Research Part D: Transport and Environment, 90, 102654. https://doi.org/10.1016/j.trd.2020.102654
- Jia, J., Zhang, H., & Shi, B. (2021). Exploring bike-sharing behavior affected by public transportation disruption: case of Washington, DC, metro shutdown. Journal of Transportation Engineering, Part A: Systems, 147(3), 04020163. https://doi.org/10.1061/JTEPBS.0000495
- Jobe, J., & Griffin, G. P. (2021). Bike share responses to COVID-19. Transportation Research Interdisciplinary Perspectives, 10, 100353. https://doi.org/10.1016/j.trip.2021.100353
- Kanik, A. (2020). The decisions cities made about coronavirus had a big impact on bike-share ridership. City Monitor. https://citymonitor.ai/transport/the-decisions-cities-made-about-coronavirus-had-a-big-impact-on-bike-share-ridership
- Kaviti, S. (2018). Profiles, preferences, and reactions to price changes of bikeshare users: A comprehensive look at Capital Bikeshare data. Doctoral dissertation, George Mason University. https://www.proquest.com/openview/9eae0bf40c722d7d5518a895a756c9ff/1?pq-origsite=gscholar&cbl=18750&diss=y
- Kaviti, S., Venigalla, M., & Lucas, K. (2019). Travel behavior and price preferences of bikesharing members and casual users: A capital bikeshare perspective. Travel Behaviour and Society, 15, 133–145. https://doi.org/10.1016/j.tbs.2019.02.004
- Kim, K. (2021). Impacts of COVID-19 on usage patterns of a bike-sharing system: case study of Seoul. Journal of Transportation Engineering, Part A: Systems, 147(10), 05021006. https://doi.org/10.1061/JTEPBS.0000591.
- Li, H., Zhang, Y., Zhu, M., & Ren, G. (2021). Impacts of COVID-19 on the usage of public bicycle share in London. Transportation Research Part A: Policy and Practice, 150, 140–155. https://doi.org/10.1016/j.tra.2021.06.010
- Lu, M., Hsu, S. C., Chen, P. C., & Lee, W. Y. (2018). Improving the sustainability of integrated transportation system with bike-sharing: A spatial agent-based approach. Sustainable Cities and Society, 41, 44–51. https://doi.org/10.1016/j.scs.2018.05.023
- Marshall, W. E., & Ferenchak, N. N. (2019). Why cities with high bicycling rates are safer for all road users. Journal of Transport & Health, 13, 100539. https://doi.org/10.1016/j.jth.2019.03.004
- McKenzie, B. (2014). Modes less traveled: bicycling and walking to work in the United States, 2008-2012 ( No. ACS-25). US Department of Commerce, Economics and Statistics Administration, US Census Bureau. https://usa.streetsblog.org/wp-content/uploads/sites/5/2014/05/acs-25.pdf
- McKenzie, G. (2019). Spatiotemporal comparative analysis of scooter-share and bike-share usage patterns in Washington, DC. Journal of Transport Geography, 78, 19–28. https://doi.org/10.1016/j.jtrangeo.2019.05.007.
- Nikiforiadis, A., Ayfantopoulou, G., & Stamelou, A. (2020). Assessing the impact of COVID-19 on bike-sharing usage: The case of Thessaloniki, Greece. Sustainability, 12(19), 8215. https://doi.org/10.3390/su12198215
- Noland, R. B., Smart, M. J., & Guo, Z. (2016). Bikeshare trip generation in New York city. Transportation Research Part A: Policy and Practice, 94, 164–181. https://doi.org/10.1016/j.tra.2016.08.030
- Open DC data. (2022). Engaging with the district through government open data. https://opendata.dc.gov/
- Osorio, J., Liu, Y., & Ouyang, Y. (2022). Executive orders or public fear: what caused transit ridership to drop in Chicago during COVID-19? Transportation Research Part D: Transport and Environment, 105, 103226. https://doi.org/10.1016/j.trd.2022.103226
- Padmanabhan, V., Penmetsa, P., Li, X., Dhondia, F., Dhondia, S., & Parrish, A. (2021). COVID-19 effects on shared-biking in New York, Boston, and Chicago. Transportation Research Interdisciplinary Perspectives, 9, 100282. https://doi.org/10.1016/j.trip.2020.100282
- Pase, F., Chiariotti, F., Zanella, A., & Zorzi, M. (2020). Bike sharing and urban mobility in a post-pandemic world. IEEE Access, 8, 187291–187306. https://doi.org/10.1109/ACCESS.2020.3030841
- Pucher, J., Buehler, R., & Seinen, M. (2011). Bicycling renaissance in North America? An update and re-appraisal of cycling trends and policies. Transportation Research Part A: Policy and Practice, 45(6), 451–475. https://doi.org/10.1016/j.tra.2011.03.001
- Shaheen, S., Cohen, A., & Zohdy, I. (2016). Shared mobility: Current practices and guiding principles ( No. FHWA-HOP-16-022). United States. Federal Highway Administration. https://rosap.ntl.bts.gov/view/dot/42193
- Shaheen, S., & Cohen, A. (2019). Shared micromoblity policy toolkit: Docked and dockless bike and scooter sharing. University of California, Berkeley, CA. https://escholarship.org/content/qt00k897b5/qt00k897b5.pdf
- Shamshiripour, A., Rahimi, E., Shabanpour, R., & Mohammadian, A. K. (2020). How is COVID-19 reshaping activity-travel behavior? Evidence from a comprehensive survey in Chicago. Transportation Research Interdisciplinary Perspectives, 7, 100216. https://doi.org/10.1016/j.trip.2020.100216.
- Shen, Y., Zhang, X., & Zhao, J. (2018). Understanding the usage of dockless bike sharing in Singapore. International Journal of Sustainable Transportation, 12(9), 686–700. https://doi.org/10.1080/15568318.2018.1429696
- Sun, F., Chen, P., & Jiao, J. (2018). Promoting public bike-sharing: A lesson from the unsuccessful pronto system. Transportation Research Part D: Transport and Environment, 63, 533–547. https://doi.org/10.1016/j.trd.2018.06.021
- Teixeira, J. F., & Lopes, M. (2020). The link between bike sharing and subway use during the COVID-19 pandemic: The case-study of New York’s citi bike. Transportation Research Interdisciplinary Perspectives, 6, 100166. https://doi.org/10.1016/j.trip.2020.100166.
- Wang, X., Lindsey, G., Schoner, J. E., & Harrison, A. (2016). Modeling bike share station activity: effects of nearby businesses and jobs on trips to and from stations. Journal of Urban Planning and Development, 142(1), 04015001. https://doi.org/10.1061/(ASCE)UP.1943-5444.0000273.
- Wang, J., & Lindsey, G. (2019). Neighborhood socio-demographic characteristics and bike share member patterns of use. Journal of Transport Geography, 79, 102475. https://doi.org/10.1016/j.jtrangeo.2019.102475
- Wang, H., & Noland, R. B. (2021). Bikeshare and subway ridership changes during the COVID-19 pandemic in New York City. Transport Policy, 106, 262–270. https://doi.org/10.1016/j.tranpol.2021.04.004
- Wergin, J., & Buehler, R. (2017). Where do bikeshare bikes actually go?: analysis of capital bikeshare trips with GPS data. Transportation Research Record, 2662(1), 12–21. https://journals.sagepub.com/doi/10.3141/2662-02