
 ?Mathematical formulae have been encoded as MathML and are displayed in this HTML version using MathJax in order to improve their display. Uncheck the box to turn MathJax off. This feature requires Javascript. Click on a formula to zoom.
ABSTRACT
The diagnosis of influenza A virus is essential since it can be confused with influenza A like illness and lead to inaccurate drug prescription. In this study, the M2e peptide, a strategic antigen that is conserved in all virus subtypes, was used as a diagnostic marker of influenza A. For the first time, M2e-specific IgY antibody was covalently conjugated to alkaline phosphatase (ALP) enzyme in the presence of glutaraldehyde. The antibody-enzyme bioconjugate was characterized by fluorescence and Fourier-transform infrared spectroscopy. Subsequently, the diagnostic value of this bioconjugate was evaluated by direct sandwich ELISA using nasopharyngeal swab samples positive/negative for H1N1 and H3N2, which were previously analyzed by rRT-PCR for influenza. In conclusion, the M2e-specific IgY-ALP bioconjugate demonstrated positive results for Influenza A in samples that were diagnosed as Influenza A via the RT-PCR method.
Introduction
Influenza A virus is a viral pathogen associated with high morbidity and mortality rates, and it causes several epidemics and pandemics every year worldwide, especially in the winter season [Citation1,Citation2] The annual epidemics caused by influenza A can be attributed to major mutations in the HA and NA glycoproteins [Citation3–Citation5]. Unlike mutations in HA and NA, the M protein on the surface of influenza A virus is the most conserved structural protein and is similar among influenza A virus species [Citation6]. The M gene of influenza A virus encodes M1 (a capsid protein) and M2 (an ion channel protein) [Citation7]. The M2 protein has a homotetrameric structure and acts as an ion channel that regulates the pH of the viral core and functions in the transportation of protons [Citation8–Citation14]. The protein is composed of 97 amino acids, which include 24 amino acids in the N-terminus (ectodomain-M2e), a transmembrane domain that contains 19 amino acids, and an intracellular domain that contains 54 amino acids in the C-terminus [Citation8–Citation14].
Influenza A virus constantly changes its structure, however the M2e peptide, which is composed of 24 amino acids, is highly conserved among human influenza A viruses [Citation2,Citation8,Citation12,Citation15–Citation18]. In particular, the N-terminal epitope of M2e, SLLTEVET (residues 2–9), is conserved among all subtypes of influenza A viruses [Citation2]. Furthermore, M2e is highly expressed on infected cell surfaces and exhibits antigenic properties. Therefore, M2e-specific antibodies can bind to cells infected by the virus [Citation19] . For this reason, the M2e peptide is considered to be an excellent tool for the diagnosis of influenza A virus [Citation6].
The diagnosis of influenza A virus is required for preventing outbreaks at health centers, outpatient management, and ruling out other influenza-like illnesses (ILIs) [Citation20] . Various methods have been used to diagnose influenza A, such as serologic tests, molecular methods, viral culture, and rapid diagnostic tests [Citation21] . Nevertheless, the rapidity and specificity of diagnosis are vital [Citation3] . Among the different diagnostic tests, ELISA is commonly used for the rapid and specific detection of influenza A antigens particularly in clinical applications [Citation22–Citation24]. Monoclonal antibodies are commonly used in sandwich ELISA systems [Citation25]. However, the production of monoclonal antibodies is difficult, expensive, and time-consuming. Therefore, antibodies that are cheaper and easier to produce are needed. IgY antibody, developed as an alternative to monoclonal antibodies, has been used to diagnose several infectious diseases [Citation26].
IgY includes the majority of immunoglobulins that are found in chicken eggs (~100 mg/yolk). Although IgY is structurally different from IgG, it is homologous to the IgG of mammals and plays a similar role [Citation27] . In addition, the use of chickens as a host for antibody production provides antibodies in a non-invasive way, is sustainable, and requires fewer immunization doses over an extended period of time [Citation28].
In particular, in contrast to IgG, IgY does not bind to protein G, protein A, and rheumatoid factor, which is important for avoiding false positives in diagnosis [Citation29]. However, covalent attachments with an enzyme that forms a chromogenic substrate are required for the use of the antibody in ELISA. Therefore, biotin-streptavidin, horseradish peroxidase, and alkaline phosphatase (ALP), which is mostly found in nature, highly stable, and easy to evaluate in enzymatic tests, are widely used [Citation30–Citation32].
The aim of this study was to covalently conjugate M2e-specific IgY antibody to ALP using glutaraldehyde for the detection of influenza A. The novel structure was characterized by fluorescence and Fourier-transform infrared (FTIR) spectroscopy. Furthermore, a sandwich ELISA was developed to evaluate M2e-specific IgY-ALP conjugation and validate nasopharyngeal specimens tested positive for influenza A by real-time reverse transcriptase PCR (rRT-PCR).
Results
The protein concentration of the M2e-specific IgY antibody purified by affinity chromatography was determined by spectrophotometry. As shown in ), a marked increase in antibody concentration during first and second months after immunization was observed. This increase may be attributed to the booster doses of M2e, which were administered in the first week.
Figure 1. (a) Protein concentration in the control and experimental groups (by month).(b) Indirect ELISA of the M2e-specific IgY antibody.

Assessment of M2e-specific IgY antibody specificity with indirect ELISA
The M2e peptide antigen specificity of the two-stage purified M2e-specific IgY antibody was analyzed by indirect ELISA. As shown in ), the antibodies obtained from the immunized group had a higher absorbance value than those obtained from the control group.
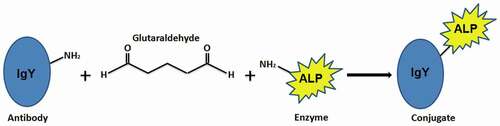
shows the conjugation reaction of the M2e-specific IgY antibody with the ALP enzyme in the presence of the homobifunctional crosslinker glutaraldehyde. The bioconjugation process involved the primary amine groups of the antibody and the primary amine groups of the enzyme. After the synthesis of the M2e-specific IgY-ALP bioconjugate, it was characterized by fluorescence and FTIR spectroscopy.
Figure 2. Schematic illustration of the antibody-enzyme conjugation method.
Fluorescence spectroscopy analysis
Antibodies contain hundreds of amino acid residues in their structures. Tryptophan, tyrosine, and phenylalanine, which are aromatic amino acid residues, exhibit specific fluorescence characteristics. The conjugation reaction of the proteins containing these amino acid residues can be characterized by fluorescence spectroscopy through Stokes’ shift, which can be observed in their characteristic fluorescence spectra.
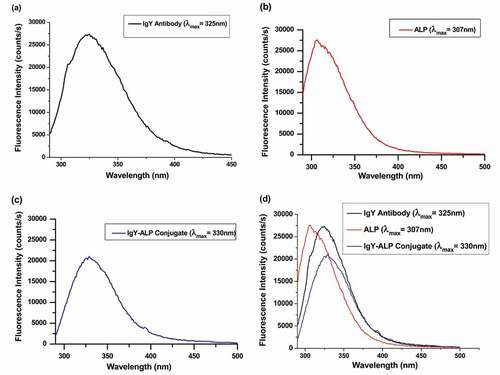
) shows the fluorescence spectrum of the M2e-specific IgY antibody. The maximum fluorescence intensity and maximum wavelength of the fluorescence spectrum were 20,400 and 325 nm, respectively. ALP also exhibited fluorescence properties due to the presence of aromatic amino acids. As shown in ), the maximum fluorescence intensity and maximum wavelength of the fluorescence spectrum were 27,625 and 307 nm, respectively. The M2e-specific IgY-ALP bioconjugate exhibited a specific fluorescence emission spectrum. As shown in ), the maximum fluorescence intensity and maximum wavelength of the fluorescence spectrum of the M2e-specific IgY-ALP bioconjugate were 20,868 and 330 nm, respectively. The fluorescence spectrum of the antibody-enzyme bioconjugate was different from the characteristic fluorescence spectrum of both the antibody and enzyme. As shown in ), a Stokes’ shift of 5 nm was observed in the fluorescence spectrum of the antibody-enzyme bioconjugate compared with that of the free antibody.
Figure 3. (a) Fluorescence spectrum of the M2e-specific IgY antibody. (b) Fluorescence spectrum of the ALP enzyme. (c) Fluorescence spectrum of the M2e-specific IgY-ALP bioconjugate. (d) A comparison of the fluorescence spectra following conjugation reaction.
FTIR spectroscopy analysis
The conjugation reaction can be explained by examining the incorporation of new functional groups or the loss of functional groups, the sharp peaks of the major functional groups, or the decrease in peak intensities in FTIR spectra of the constituent components of the bioconjugate. Therefore, the bioconjugate formed by the conjugation reaction can be characterized by FTIR spectroscopy.
FTIR analysis was performed to clarify whether M2e-specific IgY antibody was conjugated with the ALP enzyme. , , and indicate the FTIR spectra of M2e-specific IgY antibody, ALP enzyme, and M2e-specific IgY-ALP bioconjugate, respectively. The different characteristic bands that belong to different functional groups have been obtained.
Figure 4. FTIR spectrum of the M2e-specific IgY antibody.
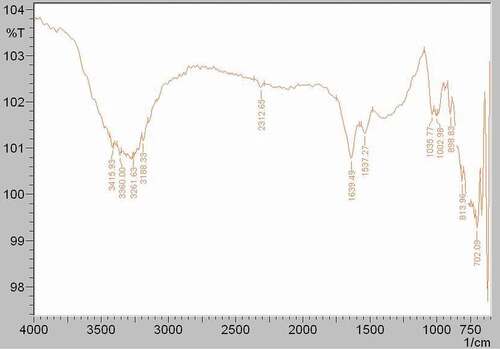
Figure 5. FTIR spectrum of the ALP enzyme.
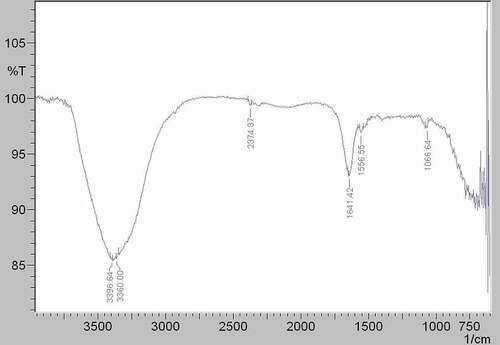
Figure 6. FTIR spectrum of the M2e-specific IgY-ALP bioconjugate.

As seen in , the spectrum of the M2e-specific IgY-ALP bioconjugate observed absorption bands at 3,381 cm−1, 2,387 cm−1, 2,308 cm−1, 1,924 cm−1, 1,784 cm−1, 1,647 cm−1, 1,543 cm−1, 1,409 cm−1, 1,315 cm−1, 997 cm−1, 773 cm−1, and 721 cm−1. The peak found at 1,647 cm−[Citation1] in the M2e-specific IgY-ALP bioconjugate spectrum indicated the presence of M2e-specific IgY antibody in the conjugate. The peaks seen at 1,639 cm−1 in the spectrum of the M2e-specific IgY antibody () at 1,641 cm−1 in the spectrum of the ALP enzyme () were the amid I peak. Due to the bioconjugation reaction between the antibody and enzyme, the amid I band of the M2e-specific IgY antibody shifted to 1,647 cm−1 with a shifting value of 8 cm−1.
Another indication of the bioconjugation was that the amid II band of the M2e-specific IgY-ALP bioconjugate () had a higher intensity than the amid II bands of M2e-specific IgY antibody at 1,537 cm−1 and ALP enzyme at 1,556 cm−1. The shifting value of the peak was 6 cm−1 according to the spectrum of the M2e-specific IgY antibody.
In addition, as seen from , the peak of the M2e-specific IgY antibody at 997 cm−1 was also seen at 1,002 cm−1 in the M2e-specific IgY-ALP bioconjugate spectrum () with shifting value of 5 cm−1 [Citation33,Citation34].
Overall, fluorescence and FTIR spectroscopy results demonstrated the formation of the bioconjugate from the M2e-specific IgY antibody and ALP enzyme.
Results of rRT-PCR analyses
Forty-two nasopharyngeal specimens were used and the results of real-time PCR were evaluated according to the amplification results. The Light Cycler 480 II system makes a logarithmic calculation as the efficiency will be 2. The samples that have a cycle point (Cp) value for the real-time PCR curve greater than 15 and smaller than 35 are evaluated as positive. It is important that a smooth amplification curve is generated. However, no amplification curve exists in the negative samples; the curve is a straight line on zero. At the end of the analyses, 26 of the samples were negative and 16 of the samples were positive.
Assessment of M2e-specific IgY-ALP bioconjugate activity with direct ELISA
The activity of the antibody-enzyme bioconjugate was evaluated using the direct ELISA method. To determine the optimal M2e peptide amount for conjugation with M2e-specific IgY antibody for ELISA, preliminary experiments were conducted (data not shown). The results indicated that 20 μg/ml of M2e peptide antigens with a 1:1 ratio of the antibody-enzyme bioconjugate would be optimal.
Detection of M2e peptide antigens in nasopharyngeal specimens by sandwich ELISA
Direct sandwich ELISA was used to evaluate the specific binding of the M2e-specific IgY-ALP bioconjugate in samples tested positive or negative for influenza A. The cut-off value of the data was around 0.26. As shown in , six H3N2 and seven H1N1 swab samples had high positive values and one H1N1 and two H3N2 swab samples were close to the cut-off value. The diagnosis results of 42 nasopharyngeal swab samples analyzed using the rRT-PCR method were consistent with those of the samples evaluated using the M2e-specific IgY-ALP bioconjugate.
Figure 7. Sandwich ELISA of M2e peptide antigens in nasopharyngeal specimens. (I: H3N2; II: H1N1), Error bars indicate the standart deviation. Mean value of negative control is 0.2184, and cut-off value is 0.257.

Discussion
Among the various methods used to identify influenza A virus [Citation35], ELISA is an attractive choice in diagnosis because of its low cost, ease of use, rapidity, and sensitivity and specificity for both antibodies and antigens. Enzymatic labeling of the antibodies used in this method enhances signal strength; thus, it has the advantage of detecting samples at low concentrations [Citation36].
In this study, IgY antibody, which is specific for influenza A M2e peptide antigen, was conjugated with ALP enzyme in the presence of glutaraldehyde. After the antibody-enzyme bioconjugate was characterized by spectroscopic methods, its use in virus detection was evaluated with nasopharyngeal swab samples, previously identified as positive or negative by rRT-PCR, using the direct sandwich ELISA method. Nasopharyngeal swab samples positive for both H1N1 and H3N2 were successfully detected using the M2e-specific IgY-ALP bioconjugate. The results are theoretically as expected since the M2e peptide sequence is a common region among most influenza subtypes including H1N1 and H3N2. In some cases, despite being positive, the absorbance was high, whereas others were close to the cut-off value. This may be caused by the virus amount in the nasopharyngeal swap samples taken from different patients. The results of all negative samples were also consistent with rRT-PCR results.
M2e peptide and M2 protein have been used to diagnose or produce specific antibody by different researchers. Ingrole et al. used M2e peptide to produce antibody in mice regarding the highly conserved structure of M2e [Citation37]. However, we obtained a high amount of IgY antibodies against M2e (not mammalian). In addition, many diagnostic studies have been conducted with M2e peptide. As an example, M2e (2–24) peptide was used for the serodiagnosis of H5N1 in one of these studies and they showed the broad reactivity of post-infection sera against M2e peptide [Citation38].
Studies in the literature showed the value of M2e peptide for the diagnosis of the influenza virus [Citation39] and our present study also showed the diagnostic potential of M2e antibody instead of as a peptide antigen. Consequently, the results were in agreement with literature findings, which indicate the potential of the M2e peptide as a diagnostic marker that can detect different types of influenza A viruses.
This study aims to demonstrate that the production of influenza A virus M2e peptide sequence-specific IgY antibody, which was not previously available in the literature, and the applicability of the conjugate of this IgY antibody and ALP enzyme, for influenza A diagnosis in ELISA. Thus, a novel diagnostic method involving the use of the anti-M2e-specific IgY antibody for the detection of influenza A virus was developed. The results obtained suggest that the M2e-specific IgY-ALP bioconjugate may be used as a rapid and specific diagnostic tool for influenza. The ‘detection efficiency and sensitivity’ parameters are important and definitely need to be researched before we can produce a diagnostic kit in our future studies.
Material and methods
Materials
Chickens were immunized with antigen which is the synthesized peptide sequence (influenza A M2e (98% purity)), commercially purchased from Bio-Synthesis (Lewisville, TX, USA). The peptide sequence was NH2-Met-Ser-Leu-Leu-Thr-Glu-Val-Glu-Thr-Pro-Ile-Arg-Asn-Glu-Trp-Gly-Cys-Arg-Cys-Asn-Asp-Ser-Ser-Asp-OH. The molecular weight of the peptide was 2756.02 g/mol. ALP from bovine intestinal mucosa buffered aqueous solution (2,000–4,000 DEA units/mg protein) and glutaraldehyde solution (Grade II, 25% in H2O) were purchased from Sigma-Aldrich. PBS buffer and PEG 6000 (Santa Cruz Biotechnology) were used for the purification of the eggs. Carboxylink™ Couplink Gel (Prot: 20266; Thermo Scientific, USA) and 1-ethyl-3-(3-dimethylaminopropyl)carbodiimide hydrochloride (EDC; Sigma-Aldrich, Carlsbad, CA, USA) were used for affinity chromatography. PBS buffer, coupling buffer, PBS-T solution, and blocking buffer were used for ELISA. The PBS buffer for ELISA was prepared from Na2HPO4(12H2O) (Merck), (KH2PO4) (Merck cat no. 7778–77-0), KCl (Merck cat no. 7447–40-7), HCl (Merck), NaOH (Merck), and NaCl (Duchefa Biochemie, cat no. 7647–14-5). The coupling buffer consisted of Na2CO3 (Sigma-Aldrich, cat no.497–19-8), NaHCO3 (Merck, cat no. 144–55-8), NaN3 (Meck, cat no. 011–004-00–7), HCl (Merck), and NaOH (Merck). Na2HPO4(7H2O) (Merck, cat no. 7782–85-6)), NaH2PO4(2H2O) (Duchefa Biochemie), Tween-20 (Merck) were used to prepare the PBS-T solution. In addition, bovine serum albumin (BSA; Sigma-Aldrich) was added to PBS to obtain the blocking buffer. The substrate, paranitro phenyl (pNPP) was obtained from Sigma-Aldrich (Sigma-cat No. 0009001789).
Production of M2e-specific IgY antibody
In total, 20 Lohmann Brown hens (22-weeks-old) were used in this study. There were two experimental groups: the control group and treatment group. In total, 15 hens were immunized with influenza A virus, and five hens were used as the control group. The hens of the control group were injected with phosphate-buffered saline (PBS). Hens in the treatment group were immunized with the M2e peptide dissolved in PBS and emulsified in Freund’s adjuvant. The subsequent booster doses of peptide emulsified in incomplete Freund’s adjuvant were given at two-week intervals after the first injection. IgY was isolated with polyethylene glycol 6000 (PEG 6000; Sigma-Aldrich) using a precipitation method [Citation40–Citation43]. Briefly, after disinfection of the eggshells with 70% ethanol, the yolks were poured into a 50 mL Falcon™ tube and mixed with PBS. Then, polyethylene glycol (PEG)-6000 was added to the egg yolk and vortexed three times at 3.5%, 8.5% and 12% (w/v), respectively. In each step, following centrifugation at 4 °C for 20 min (13,000 × g, Hettich® 320R Fixed Angle Rotor), the supernatant was poured and filtered. Finally, the extract was dissolved in PBS and dialyzed against a 0.1% saline buffer (w/v) overnight. Subsequently, affinity chromatography was performed to obtain M2e-specific IgY antibody.
Purification of m2e-specific IgY antibody via affinity chromatography
To obtain the M2e-specific IgY antibody, the affinity column was prepared using Carboxylink™ Couplink Gel (Prot: 20266; Thermo Scientific, USA) according to manufacturer’s protocol. The water-soluble carbodiimide, 1-ethyl-3-(3-dimethylaminopropyl) carbodiimide hydrochloride (EDC), was added and covalently bound to the M2e peptide resin. Then, the IgY antibody was added to the column, and elution of M2e-specific IgY was conducted by changing the pH.
Determination of the protein content isolated from eggs
The concentration of proteins isolated from the eggs was evaluated using a Shimadzu® BioSpec-Nano spectrophotometer (Shimadzu, Tokyo, Japan) with a 3 nm bandwidth in the 230–800 nm range at 280 nm. Protein concentration was calculated and presented as the number of micrograms per milliliter.
Determination of M2e-specific IgY antibody binding capacity with indirect ELISA
Initially, 96-well plates were coated with M2e peptide antigens and incubated overnight at 4 °C. On the next day, the plates were washed three times with PBS-T. Then, the plates were coated with blocking buffer (10 mg/mL BSA) and incubated for 1 h at 37 °C, and the washing step was repeated. A 1:100 dilution of the obtained M2e-specific IgY antibody was added to the wells (n = 5) with PBS-T and incubated for 1 h at 37 °C. Subsequently, the plates were washed with PBS-T, and ALP-conjugated anti-chicken IgY antibody (Novus Biologicals, Littleton, CO, USA) was added at a 1:1000 dilution before the plates were incubated. Finally, 100 µL of p-nitrophenyl phosphate (pNPP) substrate solution (SIGMAFAST) was added to each well and incubated for 45 min in the dark. The absorbance was measured at 405 nm with a microtiter plate reader (Thermo Labsystems Multiskan Ascent 354 Microplate Photometer).
Conjugation of igy antibody with ALP enzyme
IgY antibody (0.5 mg) and ALP enzyme (1.5 mg) were added to 100 µl PBS. Then, glutaraldehyde was added at a final concentration of 0.2% (v/v) and stirred at room temperature for 2 h. The mixture was diluted with 1 ml of PBS and dialyzed against 2 l of PBS at 4 °C overnight. Subsequently, the mixture was re-diluted with 10 mL of 50 mM Tris-HCl buffer.
Characterization of the M2e-specific IgY-ALP bioconjugate by spectroscopy
Fluorescence spectroscopy
Fluorescence emission spectra were obtained using a QM-4/2003 Quanta Master Steady State Spectrofluorometer (Photon Technology International, London, Canada) operating in quanta-counting mode. The slits of the excitation and emission monochromators were adjusted to 1–2 nm. The excitation wavelength was set to 280 nm, and the maximum fluorescence intensities of the emission spectra were measured with the five repeats between 320–340 nm.
FTIR spectroscopy
An IR Prestige 21 FTIR spectrophotometer (Shimadzu, Tokyo, Japan) was used for chemical analyses of the functional groups of the IgY antibody, ALP enzyme, and IgY-ALP bioconjugate. IgY-ALP, IgY, and ALP were measured separately in universal attenuated total reflectance (ATR) mode. FTIR spectra were obtained with 10 scans per sample ranging from 4000 to 750 cm–1 and a resolution of 4 cm–1.
Collection, transportation, and storage of nasopharyngeal specimens
Fourty-two nasopharyngeal specimens were obtained within the first 72 h after patients were diagnosed with ILI and brought to the laboratory by a courier system at Istanbul University Faculty of Medicine, Medical Microbiology Department, Virology and Basic Immunology Unit of the Influenza Reference Laboratory. Swabs without PCR inhibitor and with a synthetic tip and plastic handle (polyester or dacron) were used during the collection of the samples. The specimens were collected with Virocult transport medium (Medical Wire Equipment Co., Corsham, United Kingdom), which removed the cold chain requirement. In the laboratory, all procedures were carried out in the laminar flow cabinet. Viral RNA extraction was performed. On the same day, positive and negative samples were identified by rRT-PCR.
Viral RNA extraction and rRT-PCR
EZ1 Virus Mini Kit V 2.0 (QIAGEN, Germany) was used for viral RNA extraction. The extraction process was performed in an EZ1 Advanced XL device following the manufacturer’s instructions. Influenza A, influenza AH3, influenza AH1, influenza AH1pdm, RNase P forward primer and reverse primer, and probe sequences for rRT-PCR were prepared according to a Centers for Disease Control and Prevention (CDC) protocol by TIB MOLBIOL (Syntheselabor GmbH, Berlin, Germany). According to this protocol, ‘Matrix’ was selected as the target region for the detection of influenza A. The hemaglutinin gene region was selected for sub-typing. The primer sequences are as shown in [Citation44,Citation45]. Positive control samples were provided by the World Health Organization (WHO). Amplification was performed using LightCycler 480 II (Roche, Mannheim, Germany) with Real Time ready RNA Virus Master enzyme mixture (Roche, Mannheim, Germany). For each sample, 5 µl RNA isolates were added to 15 µL mixtures prepared with 8.6 µL molecular water, 0.5 µl primer, 1 µL probe, 0.4 µl enzyme, and 4 µL reaction buffer. Amplification conditions were as follows: 8 min at 50 °C, 30 s at 95 °C (0.1 s at 95 °C, 20 s at 55 °C, 0.1 s at 72 °C) × 45 cycles, and 30 s at 40 °C.
Table 1. Primer-probe sequences.
Disruption of nasopharyngeal samples
Nasopharyngeal samples in PBS-T solution were disrupted by sonication for 1 min at 50 W. An ice bath was used to prevent the heating of the samples.
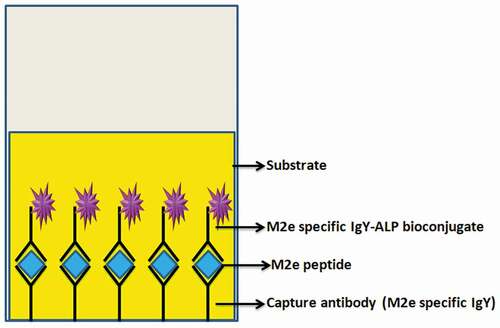
Sandwich ELISA
IgY antibody (capture antibody) was prepared at a concentration of 100 μg/ml in coating buffer (1 M, pH = 9.6) (). Samples (100 μL) were added to a 96-well flat-bottom plate (n = 5) and incubated at 4 °C overnight. After washing three times with 1 M PBS (pH = 7) containing 0.05% Tween-20, 100 μL of 5% BSA (in PBS) was added and incubated for 1 h at 37 °C. Subsequently, the plate was washed three more times, and 100 μl of the M2e peptide (positive control) and the prepared swab samples were loaded on the plate and incubated at 37 °C for 2 h. The plate was washed again, and 100 μl of the synthesized IgY-ALP bioconjugate was added to each well and incubated for 2 h at 37 °C. Then, the plate was washed seven times. The substrate pNPP was added, and absorbance values were measured at 405 nm with a multiscan spectrophotometer after incubation at 37 °C for 1 h. The cut-off value for sandwich ELISA was determined using the following formula [Citation46]:
Statistical analysis
The averages of data obtained from the experiment and control groups were compared using SPSS version 24.0 (Statistical Package for the Social Sciences) and the statistical analysis of data were performed. After comparing experimental and control groups using ANOVA, the differences between the averages were compared with the Tukey HSD test. All statistical evaluations were accepted at P > 0.05 significance.
Figure 8. Schematic illustration of the sandwich ELISA method.
Ethical Approval
This study was reviewed and approved by the Institutional Ethical Committee of Eskisehir Osmangazi University, Turkey. All applicable international, national, and/or institutional guidelines for the care and use of animals were followed.
Approval for nasopharyngeal swab sample collection was provided by Istanbul University, Faculty of Medicine, Clinical Research Ethics Committee. Patients with influenza-like symptoms were selected for the study. Nasopharyngeal samples were collected using Virocult swabs (Medical Wire Equipment Co., Corsham, United Kingdom). The swab samples were added to 1 ml liquid medium, mixed thoroughly with a vortex mixer, and stored at 4°C until use for rRT-PCR.
Acknowledgements
The authors would like to thank Assoc. Prof. Dr. Serda Kecel-Gunduz for the FTIR analyses.
Disclosure statement
No potential conflict of interest was reported by the authors.
Additional information
Funding
Related Research Data
References
- Poon LL, Leung CS, Chan KH, et al. Detection of human influenza A viruses by loop-mediated isothermal amplification. J Clin Microbiol. 2005;43:427–430.
- De Filette M, Martens W, Roose K, et al. An influenza A vaccine based on tetrameric ectodomain of matrix protein 2. J Biol Chem. 2008;283:11382–11387.
- Grubu KVTSÇ. İnfluenza ve Avian İnfluenzanın Mikrobiyolojik Tanısı. In: Bakanlığı TCS, editor. Ulusal Mikrobiyoloji Standartları. Ankara: T.C. Sağlık Bakanlığı Yayınları; 2015. p. 2–17.
- Rosas-Murrieta N, Herrera-Camacho I, Millán-Pérez-Peña L, et al. Molecular diagnostics as an indispensable tool for the diagnosis of infectious diseases of viral origin and global impact. In: Shailendra KS, editor. Trends in infectious diseases. India: InTech; 2014.
- Amano Y, Cheng Q. Detection of influenza virus: traditional approaches and development of biosensors. Anal Bioanal Chem. 2005;381:156–164.
- Bucher D, Mikhail A, Popple S, et al. Rapid detection of type A influenza viruses with monoclonal antibodies to the M protein (M1) by enzyme-linked immunosorbent assay and time-resolved fluoroimmunoassay. J Clin Microbiol. 1991;29:2484–2488.
- Kamps BS, Hoffmann C, Preiser W. Influenza report 2006. Germany: Flying Publisher;2006.
- Zhao G, Lin Y, Du L, et al. An M2e-based multiple antigenic peptide vaccine protects mice from lethal challenge with divergent H5N1 influenza viruses. Virol J. 2010;7:9.
- Yong CY, Yeap SK, Ho KL, et al. Potential recombinant vaccine against influenza A virus based on M2e displayed on nodaviral capsid nanoparticles. Int J Nanomedicine. 2015;10:2751.
- Zhong W, He J, Tang X, et al. Development and evaluation of an M2-293FT cell-based flow cytometric assay for quantification of antibody response to native form of matrix protein 2 of influenza A viruses. J Immunol Methods. 2011;369:115–124.
- Hemmatzadeh F, Sumarningsih S, Tarigan S, et al. Recombinant M2e protein-based ELISA: A novel and inexpensive approach for differentiating avian influenza infected chickens from vaccinated ones. PloS one. 2013;8:e56801.
- De Filette M, Jou WM, Birkett A, et al. Universal influenza A vaccine: optimization of M2-based constructs. Virology. 2005;337:149–161.
- Zebedee SL, Lamb RA. Influenza A virus M2 protein: monoclonal antibody restriction of virus growth and detection of M2 in virions. J Virol. 1988;62:2762–2772.
- Pejoski D, Zeng W, Rockman S, et al. A lipopeptide based on the M2 and HA proteins of influenza A viruses induces protective antibody. Immunol Cell Biol. 2010;88:605–611.
- Lee Y-N, Kim M-C, Lee Y-T, et al. Mechanisms of cross-protection by influenza virus M2-based vaccines. Immune Netw. 2015;15:213–221.
- Zeng W, Tan ACL, Horrocks K, et al. A lipidated form of the extracellular domain of influenza M2 protein as a self-adjuvanting vaccine candidate. Vaccine. 2015;33:3526–3532.
- Muto NA, Yoshida R, Suzuki T, et al. Inhibitory effects of an M2-specific monoclonal antibody on different strains of influenza A virus. Jpn J Vet Res. 2012;60:71–83.
- Mardanova ES, Kotlyarov RY, Kuprianov VV, et al. Rapid high-yield expression of a candidate influenza vaccine based on the ectodomain of M2 protein linked to flagellin in plants using viral vectors. BMC Biotechnol. 2015;15:42.
- Saelens X. The influenza matrix protein 2 as a vaccine target. Future Medicine 2008;3: 167-178.
- Boivin G, Hardy I, Kress A. Evaluation of a rapid optical immunoassay for influenza viruses (FLU OIA test) in comparison with cell culture and reverse transcription-PCR. J Clin Microbiol. 2001;39:730–732.
- Shojaei TR, Tabatabaei M, Shawky S, et al. A review on emerging diagnostic assay for viral detection: the case of avian influenza virus. Mol Biol Rep. 2015;42:187–199.
- Soema PC, Kompier R, Amorij J-P, et al. Current and next generation influenza vaccines: formulation and production strategies. Eur J Pharm Biopharm. 2015;94:251–263.
- Kumar S, Henrickson KJ. Update on influenza diagnostics: lessons from the novel H1N1 influenza A pandemic. Clin Microbiol Rev. 2012;25:344–361.
- Coughlan L, Lambe T. Measuring cellular immunity to influenza: methods of detection, applications and challenges. Vaccines (Basel). 2015;3:293–319.
- Stanker LH, Hnasko RM. A double-sandwich ELISA for identification of monoclonal antibodies suitable for sandwich immunoassays. ELISA. New York: Springer; 2015. p. 69–78.
- Li X, Wang L, Zhen Y, et al. Chicken egg yolk antibodies (IgY) as non-antibiotic production enhancers for use in swine production: a review. J Anim Sci Biotechnol. 2015;6:40.
- Hatta H, Kim M, Yamamoto T. A novel isolation method for hen egg yolk antibody,“IgY”. Agric Biol Chem. 1990;54:2531–2535.
- Tong C, Geng F, He Z, et al. A simple method for isolating chicken egg yolk immunoglobulin using effective delipidation solution and ammonium sulfate. Poult Sci. 2014;94:104–110.
- Justiz Vaillant A, Ramirez N, Cadiz A, et al. Separation and reactivity of avian immunoglobulin Y. J Chromatogr Sep Tech. 2013;4:173.
- Suzuki U, Yoshimura K, Takaishi M. Ueber ein Enzym “Phytase” das “Anhydro-oxy-methylen diphosphorsaure” Spaltet. Tokyo Imper Univ Coll Agric Bull. 1907;7:503–512.
- Rankin S, Christiansen A, Lee W, et al. Invited review: the application of alkaline phosphatase assays for the validation of milk product pasteurization. J Dairy Sci. 2010;93:5538–5551.
- Gibbs J, Kennebunk M. Selecting the detection system—colorimetric, fluorescent, luminescent methods. Corning Life Sci ELISA Tech Bull. 2001;5;14.
- Lü H. FTIR analysis of the impact of covalent coupling on the secondary structure of antibody protein. Spectrosc Spectral Anal. 2012;32:630–634.
- de La Fournière L, Nosjean O, Buchet R, et al. Thermal and pH stabilities of alkaline phosphatase from bovine intestinal mucosa: a FTIR study. Biochim Biophys Acta (BBA)-Protein Struct Mol Enzymol. 1995;1248:186–192.
- Kilinç Y, Cakır-Koc R, Badur S. The development of a universally conserved m2e and hemagglutinin peptide-based elisa method against influenza a. J Clin Anal Med. 2017;8:320–323.
- Engvall E, Perlmann P. Enzyme-linked immunosorbent assay (ELISA) quantitative assay of immunoglobulin G. Immunochemistry. 1971;8:871–874.
- Ingrole RS, Tao W, Tripathy JN, et al. Synthesis and immunogenicity assessment of elastin-like polypeptide-M2e construct as an influenza antigen. Nano Life. 2014;4:1450004.
- Khurana S, Sasono P, Fox A, et al. H5N1-SeroDetect EIA and rapid test: a novel differential diagnostic assay for serodiagnosis of H5N1 infections and surveillance. J Virol. 2011;85:12455–12463.
- Budama‐Kilinc Y, Cakir‐Koc R. Influenza diagnosis with a specific emphasis on the M2e antigen as a diagnostic tool. In: Manal MB, editor. Steps forwards in diagnosing and controlling influenza. Rijeka: InTech; 2016.
- Polson A, Caton J, Yeaple R, et al. Histological determination of probe tip penetration into gingival sulcus of humans using an electronic pressure‐sensitive probe. J Clin Periodontol. 1980;7:479–488.
- Pauly D, Chacana PA, Calzado EG, et al. IgY technology: extraction of chicken antibodies from egg yolk by polyethylene glycol (PEG) precipitation. J vis exp. 2011.
- Walczak M, Grzywa R, Łupicka‐Słowik A, et al. Method for generation of peptide‐specific igy antibodies directed to Staphylococcus aureus extracellular fibrinogen binding protein epitope. Pept Sci. 2015;104:552–559.
- Áf J, Santiago FM, Silva MV, et al. Production, characterization and applications for Toxoplasma gondii-specific polyclonal chicken egg yolk immunoglobulins. PLoS One. 2012;7:e40391.
- WHO. CDC protocol of realtime RTPCR for influenza A(H1N1). USA: WHO; 2009.
- WHO. WHO information for molecular diagnosis of influenza virus – update. China: WHO; 2018.
- He Q, Velumani S, Du Q, et al. Detection of H5 avian influenza viruses by antigen-capture enzyme-linked immunosorbent assay using H5-specific monoclonal antibody. Clin Vaccin Immunol. 2007;14:617–623.