
ABSTRACT
This paper identified the dominant protozoan species in the four layers of rhizosphere soil during the six growth stages of Beta vulgaris L. and analyzed the correlations of the abundance and diversity of the dominant protozoan species with soil properties at different growth stages and soil depth. A total of 15 species of protozoa were identified; among them, Colpoda sp., Bodo sp., two kinds of Oxytricha sp., and Tachysoma sp. were the most dominant species of Beta vulgaris L. rhizosphere soil. The Colpoda sp. was eurytopic species in the Beta vulgaris L. rhizosphere soil and Tachysoma sp., Vorticella sp., Colpoda sp., Oxytricha sp.1, and Oxytricha sp. 2 were noted closely related to the acceleration function of circulation of N and P elements in soils. These dominant protozoan species were proposed to play a significant role of fertilization on N supply in rhizosphere soil during the initial growth of Beta vulgaris L.
KEYWORDS:
1. Introduction
Beta vulgaris L. (sugar beet) is the second largest sugar crop globally, whose demand was continuously increased [Citation1]. The growth of Beta vulgaris L. is closely related to the rhizosphere soil microbes with plant roots providing habitats and nutrient sources for soil organisms and driving the interaction between soil organisms and the environment [Citation2]. Rhizosphere soil is enriched with a huge number of living organisms [Citation3], among which the number of microorganisms and protozoa being the largest and their interaction directly affects the physicochemical properties and biochemical processes of rhizosphere soil [Citation4–Citation6].
Numerous microorganisms in soil play essential roles for food web security [Citation7,Citation8,]. Protozoa are the higher trophic members of the soil food chain than microorganisms. As the third largest group of soil organism after bacteria and fungi, protozoa have different nutritional types, such as photosynthetic autotroph, humus, and predatory, whose predation behavior not only controls the bacterial community but also promotes nutrient transformation and carbon cycle, and is an important biological regulator of soil biological and biochemical activities [Citation9]. Therefore, the study of protozoan community structure and ecological function forms the basis to elucidate soil fertility and plant growth [Citation10]. However, the characteristics and changes of protozoan communities in rhizosphere soil are rarely discussed.
The protozoan community in soil samples has been studied by high throughput sequencing technique probing the 18 S rRNA genes [Citation11,Citation12,]. However, the rRNA sequencing technique cannot differentiate the live and functional cells and the dead cells or cysts, leading to possible overestimation of the roles of the probed microbial communities [Citation13]. The soil ciliate has been identified with the non-flooded Petri dish method with pre-dried then reactivated resting cysts of the ciliates [Citation14]. This method was applied for estimating the species richness of benthic protozoan community in a mangrove site [Citation15], of testate amoebae species from moss samples collected at high altitude Himalayan region [Citation16], and of ciliate species in soil samples collected in Brazil and China [Citation17]. Commonly only the ones that can survive after drought storage and can revive will be counted. Surely this is not a naïve environment as noted in the rhizosphere environment of a growing plant. But it can be applied as a nice indicator for the constituent members of the community. Therefore, the non-flooded Petri dish method can be applied as a qualitative indicator for protozoan cryptic diversity [Citation18].
In this paper, the Beta vulgaris L. growing area in northeast China was selected as the research objective to identify the dominant protozoan species and soil physicochemical properties in four soil layers during the six planting periods of Beta vulgaris L. The vivo observation of protozoan cells in the soil samples was performed with ammonia silver staining and protein silver staining technique. The spatial and temporal distribution characteristics of the dominant protozoan species in Beta vulgaris L. rhizosphere and the correlations with the recorded soil physicochemical properties were then discussed based on the observation results. The results of this study are the basis to estimate the possible contributions of protozoan species to nitrogen fertilization during the growth period of Beta vulgaris L. The effective fertilization is essential to successful plantation, which is manipulated by the entire rhizosphere microbial communities, including the involved, abundant protozoan species.
2. Materials and methods
2.1. Field sites
The field sites were located at Hulan campus of Heilongjiang University, northeast China, N45°59”, E126°38”. The soil samples were collected with the main crop being Beta vulgaris L.
2.2. Sampling and measurement
The sampling time was selected according to the growing period and farming time of Beta vulgaris L. () in 2018, including pre-sowing stage (May), seedling stage (June), foliage rapid growth stage (July), root and sugar increasing stage (August), sugar accumulating stage (September), and post-harvest stage (October) [Citation19]. The Beta vulgaris L. was planted at gap of 30 cm and row gap of 50 cm, with plantation density of around 67,000/hectare. On 25 April, synthetic fertilizer containing 18% w/w nitrogen was added to the site at dosage of 210 kg/hectare, giving a dosage of 0.56 g nitrogen (N) per Beta vulgaris L. The soil sampling times were on 25 May, 28 June, 28 July, 29 August, 26 September and 27 October 2018. The isometric sampling method [Citation20] was used to collect 50 g rhizosphere soil samples from planted Beta vulgaris L. at different depths from surface (0‒5 cm, 5‒10 cm, 10‒15 cm, 15‒20 cm). The plant sampling times were on 1 June, 9 July and 20 August, 2018. The average dry weights for single Beta vulgaris L. were 1.26 g, 102.3 g, and 157.7 g on 1 June, 9 July and 20 August, respectively.
Figure 1. Illustration of sampling time points
2.3 Soil physicochemical properties
The physicochemical properties of soil samples were determined including soil water content (SWC), organic matters (OM), total nitrogen (TN), available phosphorus (A-P), ammonium nitrogen (NH4+_N), and nitrate nitrogen (NO3–N), soil pH, and temperature (T). The determination methods of these properties followed the Chinese National Standard (GB 15,618–1995) [Citation21]. The soil temperature was measured in situ. All collected soil samples were chernozemic soils.
2.4. Classification and identification of soil protozoa
The dominant protozoan species were cultured by the non-flooded Petri dish method [Citation22], in which 10 g of soil samples were placed in Petri dishes, 30 ml of distilled water were added, and then the dishes were incubated in an incubator under light and 25°C. The soil leaching solutions were collected daily for sequential 15 days for protozoan identification and counting. The protozoan species were identified with reference to Soil Animal Retrieval Atlas of China [Citation23] using living observation and silver staining methods. The identified protozoa were regarded as dominant living ones. The protargol method was used to identify the group of protozoa according to [Citation24]. Silver carbonate [Citation25] and Chatton-Lwoff silver nitrate stains [Citation26] were also used to classify and identify certain kinds of protozoa, respectively. After magnifying the stained specimens of 100–1250×, then counts and measurements are ready to be performed.
2.5. Statistics analysis
The Microsoft Excel 2003 software, SPSS20.0 statistical software, Origin 8.0 software, PRIMER 7.0 multivariate analysis software and R were used for data processing and correlation analysis of experimental data. R software packages used include maptools, ggplot2, mapproj, pheatmap, and corrplot. The SIMPER subroutine of PRIMER multivariate statistical software was used to calculate and rank the abundance and contribution rate of identified protozoa species in each soil layer. Spearman correlation analysis and biota-environment (BIOENV) analysis were carried out on protozoan abundance detected in Beta vulgaris L. rhizosphere soil and physicochemical properties. The community diversity indices used included the Shannon–Wiener index (H’), Pielou evenness index (J) and Margalef species richness index (d) [Citation27].
3. Results
3.1. Dominant protozoan species of Beta vulgaris L. rhizosphere soil
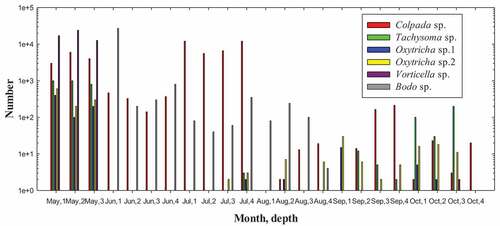
A total of 15 species of protozoa were identified in soil samples during the present survey, composing of two classes Ciliata and Mastigophora, belonging to 13 species of ciliates and two species of flagellates. The abundance and contribution rate of the 15 identified protozoa species in each soil layer was listed in , with the count numbers of major species being shown in . In May with fertilization, Vorticella sp. counted 13,000‒24,000 ind/g, followed by Colpada sp. (3000‒6000 ind/g), Tachysoma sp. (800‒1000 ind/g), and Oxytricha sp. (a few hundred ind/g). In June the seeding stage, the dominant species became Bodo sp. (27,000 in top soil) and Colpada sp. (a few hundreds). In foliage rapid growth stage (July), the order of dominant species reversed: Colpada sp. (5600‒12,000) followed by Bodo sp. (40–350 ind/g). In the root and sugar increasing stage (August), only some Bodo sp. was presented in the top 15 cm soil (80–240 ind/g). In the sugar accumulating stage (September), and the post-harvesting stage (October), some Colpada sp. and Tachysoma sp. appeared in number of a few tens to a few hundred ind/g. Overall, the protozoan species were abundant in May–July but were almost wiped out afterward.
Table 1. List of protozoa species recorded at the four layers of soil, including average abundance (ind*ml−1), occurrence, and rank by contribution of each species to the average Bray–Curtis similarity at each of the four layers in sites soil the whole growing period of Beta vulgaris L. May to October 2018. n: average abundance; %: contribution; rank: abundance ranking
Figure 2. Count number of principal living protozoan species noted in the studied soil samples. Depth 1: 0–5 cm; 2: 5–10 cm; 3: 10–15 cm; 4: 15–20 cm
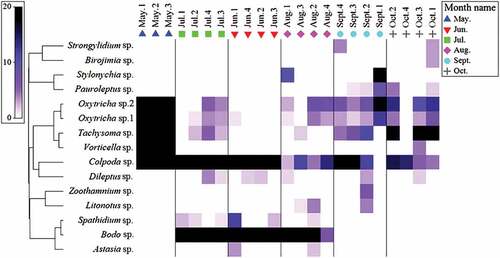
The heatmap showed the abundance and occurrence frequency of 15 protozoa in the six sampling months (). Colpoda sp. had a great advantage in all sampling periods while Bodo sp. was the dominant species in the seedling stage (June), foliage rapid growth stage (July), and root and sugar increasing stage (August). Oxytricha sp.1 and Oxytricha sp.2 had obvious advantages in the pre-sowing stage (May) and sugar accumulating stage (September). The advantages of Tachysoma sp. were mainly expressed in pre-sowing stage (May) and post-harvest stage (October).
Figure 3. The abundance and occurrence frequency of protozoa in the rhizosphere of B. vulgarisL. and in four layers of soil within 6-months sampling period. 1: 0–5 cm soil, 2: 5–10 cm soil, 3: 10–15 cm soil, 4: 15–20 cm soil
The Bray-curtis similarities of dominant protozoan species in the six sampling periods and four soil layers are shown in . A significant temporal difference in soil protozoan communities occurred over the sampling periods ()). From June to September, the dominant species were divided into the left side of CAP1 axis, while the samples in May and October were on the right side. The May to July samples were on the upper side of CAP2 axis, and September to October samples were on the lower side. Vector projection on the CAP axis of the five dominant species that contributed the most to the abundance of protozoa community in the sample showed that: In May, the community was controlled by Colpoda sp., Oxytricha sp.1, and Tachysoma sp. From June to July, it turned to be dominated by Colpoda sp., Bodo sp., and Oxytricha sp.1. In August, it was controlled by Colpoda sp., Bodo sp., and Oxytricha sp.1. In September, it was dominated by Bodo sp., Oxytricha sp.2. In October, it was turned into Colpoda sp., Bodo sp., Oxytricha sp.2, and Tachysoma sp.
Figure 4. Canonical analysis of principal coordinates on Bray–Curtis similarities from log-transformed species-abundance data in B. vulgaris L. rhizosphere soil from May 2018 to October 2018, and correlations of 5dominant species with the two CAP axes. (a) Time difference analysis, (b) Space difference analysis
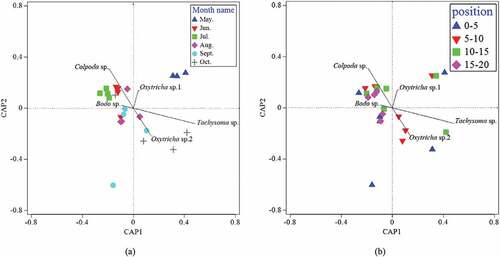
The spatial distributions of dominant protozoan species in the four soil layers were also different over time (). Among them, communities in 0‒5 cm and 5‒10 cm soil layer were mainly distributed on the right side of CAP1 axis, while communities in 10‒15 cm and 15‒20 cm soil layer were concentrated on the left side. Vector projections of five dominant species on the CAP axis indicate that: most soil protozoan communities were controlled by Colpoda sp., Bodo sp., Oxytricha sp.2., and Tachysoma sp. The same rule was also found in the analysis of frequency heatmap () of protozoa distribution in different soil layers at different periods.
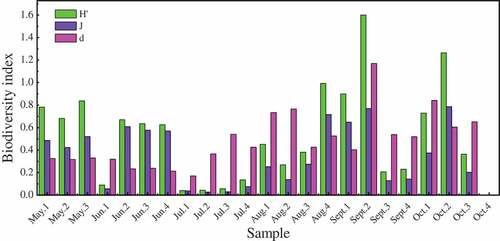
The three diversity indices for the dominant protozoan species of B. vulgaris L. rhizosphere soil at different depths and different sampling periods show that the highest diversity indices were noted in the September and October samples, then followed by August samples. Higher diversity of soil dominant protozoan species generally occurred at 0‒10 cm of topsoil, except for an expected high diversity noted on August 15‒20 cm soil sample that is regarded as an outliner ().
Figure 5. Protozoan diversity indexes of soils and the four layers of soil. Shannon–Wiener index (H’), Pielou evenness index (j), Margalef species richness index (d). 1: 0–5 cm soil, 2: 5–10 cm soil, 3: 10–15 cm soil, 4: 15–20 cm soil
3.2. Soil physicochemical properties
The eight physicochemical properties of four soil layers (0‒20 cm) in the Beta vulgaris L. rhizosphere from May to October 2018, were recorded (). Except for the relatively stable soil pH ranging 5.8‒6.8, the remaining seven physicochemical properties experienced significant changes with the growth of Beta vulgaris L.
Figure 6. Physiochemical properties of soil samples. (a) left: T, right: pH (b) left: SWC, right: OM (c) left: NH4+-N, right: NO3–N (d) left: TN, right: A-P
Soil temperature is obviously affected by seasons. The average temperature of soil layers in May was 11.8°C, and that in June was 16.4°C. The average temperature of soil rose to 18.1°C in July, and the highest average temperature was 21.0°C in August. The soil temperature gradually decreases with the increase of soil depth, roughly by 0.7‒2.1°C for every 5 cm of soil depth.
The change of soil water content was mainly manifested in the sudden increase from 3% to 8% on average to 30‒44% in July, and the water content of deep soil was higher than that of surface soil. The overall trend of the content of soil organic matter (OM) was a gradual increase from May to October, with the highest content reaching 601.7 g/kg after a sharp decrease in July. The content of OM in 0‒10 cm soil fluctuated greatly under the influence of irrigation and rainfall.
The contents of TN were declined monotonically from May to August, and the second fertilization of farmland in September increased the TN content, with the TN contents of 0‒5 cm topsoil being higher than those of other soil layers. The overall trend of NO3–N in soil layers correlated with that of TN. The highest content of NO3–N at 3.0‒4.6 mg/kg occurred in May, owing to fertilization in April before sowing. The content of NO3–N continued to decrease from June to October. In September, the second fertilization was carried out in the sampling site, which suddenly increased the NO3–N contents in topsoil to 3.81 mg/kg. This content was then decreased rapidly to 0.71‒1.26 mg/kg within 1 month. The content of NH4+-N mildly fluctuated among different sampling times and soil layers. The contents of NH4+-N peaked at 309.2 mg/kg in August, minimized at 155.2 mg/kg in October, and fluctuated between 173 and 246 mg/kg in other months. The contents of NH4+-N in the 0‒10 cm soil layer were slightly higher than that in the 10‒20 cm soil layer.
The general change trend of soil A-P content was that it decreased slowly with time, and the difference in each soil layer was not insignificant.
4. Discussion
4.1. Correlation between soil properties and protozoan community structure in Beta vulgaris L. rhizosphere soil
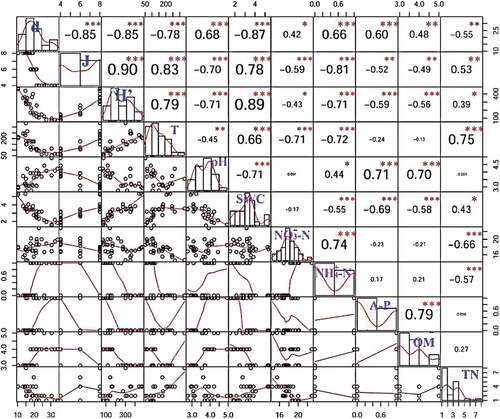
The three diversity indices correlated differently with the eight soil physicochemical properties (). The top four physicochemical properties noted are T, pH, SWC, and NH4+-N in the order of the degree of impact on protozoan diversity. T, SWC, and TN were positively correlated with Shannon–Wiener index (H ‘) and Pielou evenness index (J), while pH, NH4+-N, NO3–N, OM, and A-P were negatively correlated. Margalef species richness index (d) had an opposite trend.
Figure 7. Pearson correlation analysis between soil physicochemical properties and protozoan diversity indexes (relative abundance and their ratios). Shannon–Wiener index (H’), Pielou evenness index (j), Margalef species richness index (d).***Significant correlation at p < 0.001 level, **Significant correlation at p < 0.01 level, *Significant correlation at p < 0.05 level
Spearman correlation analysis ( and ) shows that the physicochemical properties of soil samples that greatly influenced the abundance of the five dominant population were pH and A-P, followed by T and NO3–N, with NH4+-N and TN having the minimum influence. The Colpoda sp. was significantly positively correlated with SWC, NO3–N, and OM, and Tachysoma sp was positively correlated with pH and negatively correlated with soil temperature. Oxytricha sp.1 and Oxytricha sp.2 were significantly positively correlated with pH. The soil A-P negatively regulated Oxytricha sp.1, but positively regulated Oxytricha sp.2. Bodo sp. was mainly negatively regulated by pH, NO3–N and A-P.
Table 2. Spearman correlation analysis between soil physicochemical properties and protozoa
Figure 8. Pearson correlation analysis between soil physicochemical properties and protozoan (relative abundance and their ratio).**Significant correlation at p < 0.01 level; *significant correlation at p < 0.05 level
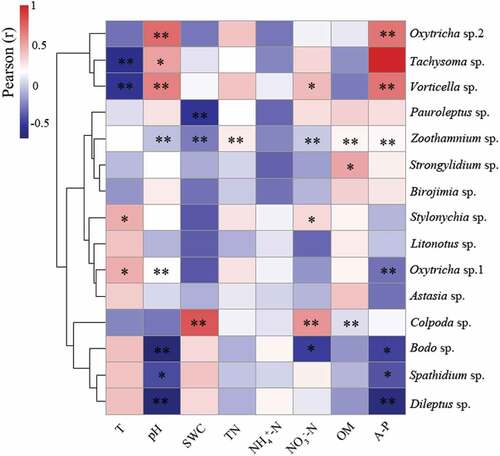
Among the physicochemical properties that affect the abundance of non-dominant protozoa, the soil A-P and pH were still the most influential properties, followed by NO3–N, OM, and SWC. The Zoothamnium sp. and Vorticella sp. were the protozoan species being affected by many physicochemical properties. However, Astasia sp., Litonotus sp. and Birojimia sp. showed an insignificant correlation with the eight recorded physicochemical properties. BIOENV analysis () also indicates that multiple physicochemical properties can affect protozoan abundance through jointed interactions. Ranking by the R value, pH and A-P combination had the highest correlation with protozoan abundance, followed by T, pH, NO3–N, A-P, and TN combination.
Table 3. Summary of results from biota-environment (BIOENV) analysis showing the eight best matches of environmental variables with temporal variations in protozoa abundances at four layers in B. vulgarisL. rhizosphere soil from May 2018 to October 2018
4.2. Contributions of rhizosphere soil dominant protozoan species on growth of Beta vulgaris L
The dominant protozoan species in rhizosphere soil revealed signification variations over the growth of Beta vulgaris L. In pre-sowing stage both Vorticella sp. and Colpada sp. were the most dominant species and in the next seeding stage and the foliage rapid growth stage, the most dominant species became only Bodo sp. and Colpada sp., respectively. Afterward, few protozoan cells were noted in the rhizosphere soil. The protozoa are bacteria grazers that contribute to regulating the number and species of bacteria communities and manipulate the carbon and nitrogen fluxes in the rhizosphere soil. The possible contributions of the carbon and nitrogen fluxes over the growth stages of Beta vulgaris L. can be estimated as the first approximation.
Taking the following parameters for the calculations: soil density 1.3 g/cm3 [Citation28], bacteria biovolume 0.65 μm3 [Citation29], each cm3 of bacterial biovolume has 0.22 g C [Citation30], bacterial grazing rates by ciliates and flagellates are 523/hr and 17.4/hr, respectively [Citation31]; rhizosphere for Beta vulgaris L. covers 25*25 cm2 projection area; then together with the numbers of protozoan cells obtained in , the carbon flows per planted Beta vulgaris L. with 25*25*15 cm3 projection area via bacteria grazing by the identified protozoa were estimated as 1.53 g, 1.33 g, 5.19 g, 0.01 g, 0.05 g, and 0.09 g for May to October, respectively. Restated, the first approximation of carbon flows through protozoa in the rhizosphere soil ranged 1.33–5.19 g per month from pre-sowing stage to foliage rapid growth stage, but were decreased to negligible levels afterward.
If further taking the C/N ratios for typical bacteria and protozoa to be 5.2:1 and 6.8:1, respectively [Citation32], and assuming 100% carbon catabolism, the fixation of 1 g of C to protozoa cells will release 0.045 g N to the soil. Therefore, an approximation of N release by protozoa activities ranged 0.06–0.23 g per planted Beta vulgaris L. during the pre-sowing to rapid growth periods. This quantity ranged 10.7–41.1% of the fertilized N quantity (0.56 g); restated, the protozoan activity can account a significant role of fertilization on N supply.
5. Conclusions
The current study for the first time revealed the spatio-temporal distributions of dominant protozoan species in the rhizosphere soil of planted Beta vulgaris L. Fifteen species of protozoa were identified in soil samples with the Vorticella sp., Colpada sp., Tachysoma sp., and Bodo sp. being the dominant species. The dominant protozoan species were abundant up to fast-growing stage, but were almost wiped out in the sugar increasing accumulating stages of the growth of Beta vulgaris L. The diversity indices of dominant protozoan species correlated with the eight soil physicochemical properties recorded, with the pH and A-P most influencing the diversities of dominant and non-dominant species. Based on the reported data, the possible role of dominant protozoan species in the carbon and nitrogen flows in the rhizosphere soil during the growth of the growth of Beta vulgaris L. was discussed.
Highlight
Dominant protozoan species in rhizosphere soil of Beta vulgaris L. were identified.
Correlation between soil properties and protozoan species was noted.
Role of dominant protozoan species on plant fertilization was discussed.
Acknowledgements
The authors gratefully acknowledge financial supports from project by National Natural Science Foundation of China (Project No. 31672249, 31471950).
Disclosure statement
No potential conflict of interest was reported by the authors.
Additional information
Funding
References
- Anar MJ, Lin Z, Hoogenboom G, et al. Modeling growth, development and yield of sugar beet using DSSAT. Agric Syst. 2019;169:58‒70.
- Habteweld AW, Brainard D, Kravchenko A, et al. Effects of plant and animal waste-based compost amendments on the soil food web, soil properties, and yield and quality of fresh market and processing carrot cultivars. Nematology. 2018;20:147‒168.
- Egamberdieva D, Wirth S, Li L, et al. Microbial cooperation in the rhizosphere improves liquorice growth under salt stress. Bioengineered. 2017;8:433‒438.
- Melakeberhan H, Maung ZTZ, Lee CL, et al. Soil type-driven variable effects on cover- and rotation-crops, nematodes and soil food web in sugar beet fields reveal a roadmap for developing healthy soils. Eur J Soil Biol. 2018;85:53‒63.
- Joergensen RG, Wichern F. Alive and kicking: why dormant soil microorganisms matter. Soil Biol Biochem. 2018;116:419‒430.
- Spohn M, Zavisic A, Nassal P, et al. Temporal variations of phosphorus uptake by soil microbial biomass and young beech trees in two forest soils with contrasting phosphorus stocks. Soil Biol Biochem. 2018;117:191‒202.
- Li F, Liang X, Zhang H, et al. The influence of no-till coupled with straw return on soil phosphorus speciation in a two-year rice-fallow practice. Soil Till Res. 2019;195:104389.
- Rodgers D, McPhee J, Aird P, et al. Soil arthropod responses to controlled traffic in vegetable production. Soil Till Res. 2018;180:154‒163.
- Weidner S, Agaras ELB, Valverde C, et al. Protozoa stimulate the plant beneficial activity of rhizospheric pseudomonads. Plant Soil. 2017;410:509‒515.
- Clarholm M. Interactions of bacteria, protozoa and plants leading to mineralization of nitrogen. Soil Biol Biochem. 1985;17:181‒187.
- Venter PC, Nitsche F, Arndt H. The hidden diversity of flagellated protists in soil. Protist. 2018;169:432‒449.
- Xue Y, Chen H, Yang JR, et al. Distinct patterns and processes of abundant and rare eukaryotic plankton communities following a reservoir cyanobacterial bloom. Isme J. 2018;12:2263‒2277.
- Venter PC, Nitsche F, Domonell A, et al. The protistan microbiome of grassland soil: diversity in the mesoscale. Protist. 2017;168:546‒564.
- Foissner W. Estimating the species richness of soil protozoa using the ‘non–flooded petridish method. In: Lee JJ, Soldo AT, editors. Protocols in Protozoology. Lawrence, Kansas: Allen Press; 1992. p. B–10.1–10.2.
- Chen Q, Li J, Zhao Q, et al. Changes in the benthic protozoan community during succession of a mangrove ecosystem in Zhanjiang, China. Ecosphere. 2018;9:e02190.
- Bindu L. Extended distribution of testate amoebae (Protozoa: rhizopoda) to Indian fauna from Sangla Valley, Himachal Pradesh, India. Int J Biodiv Conserv. 2019;11:183‒186.
- Deng Y, Lu X, Li J, et al. Morphology of two Eschaneustyla species (Ciliophora, Urostylida), with noted on morphogenesis of Eschaneustyla lugri. Acta Protozool. 2018;57:69‒78.
- Pierozzi M, da Consolacao Javaroti DD, Seleghim MHR. Effects of fire stress to soil protozoan abundance and richness in a Brazilian savanna. Revista Brasileira de Zoociências. 2016;17:91‒111.
- Milford GFJ. The growth and development of the storage root of sugar beet. Ann Appl Biol. 1973;75:427‒438.
- MacEachren AM, Davison JV. Sampling and isometric mapping of continuous geographic surfaces. Am Cartogr. 1987;14:299‒320.
- Ministry of Environmental Protection. Soil environmental quality standard (GB 15618-1995). Beijing: China Standard Press; 1995.
- Foissner W, Al-Rasheid K. Notes on soil ciliates (Protozoa, Ciliophora) from the Netherlands, with description of Keronopsis schminkei nov. spec. and Apobryophyllum schmidingeri nov. spec. Acta Protozool. 2007;46:201‒220.
- Yin W. An Atlas of Soil Fauna in China. Beijing: Science Press; 1998.
- Wilbert N. Eine verbesserte Technik der Protargol imprägnation für Ciliaten. Mikrokosmos. 1975;64:171–179.
- Ma H, Choi JK, Song W. An improved silver carbonate impregnation for marine ciliated protozoa. Acta Protozool. 2003;95:431–519.
- Wilbert N, Song W. A further study on littoral ciliates (protozoa, ciliophora) near King George Island, Antarctica, with description of a new genus and seven new species. J Nat Hist. 2008;42:979–1012.
- Eros T, Kuehne L, Dolezsai A, et al. A systematic review of assessment and conservation management in large floodplain rivers – actions postponed. Evol Indic. 2019;98:453‒461.
- Lal R Effects of soil moisture and bulk density on growth and development of two cassava cultivars. Proc. The First Triennial Root Crops Symposium of the International Society for Tropical Root Crops. 104–110. International Development Research Centre. Ottawa, Canada, 1981.
- Hahn MW, Höfle MG. Flagellate predation on a bacterial model community: interplay of size-selective grazing, specific bacterial cell size, and bacterial community composition. Appl Environ Microbiol. 1999;65:4863–4872.
- Lee S, Fuhrman JA. Relationships between biovolume and biomass of naturally derived marine bacterioplankton. Appl Environ Microbiol. 1987;53:1298–1303.
- Simek K, Grujcic V, Nedoma J, et al. Microbial food webs in hypertrophic fishponds: omnivorous ciliate taxa are major protistan bacterivores. Limnol Oceanogr. 2019;64:2295–2309.
- Anderson MR, Rivkin RB. Seasonal patterns in grazing mortality of bacterioplankton in polar oceans: a bipolar comparison. Aqua Microbiol Ecol. 2001;25:195–206.