
 ?Mathematical formulae have been encoded as MathML and are displayed in this HTML version using MathJax in order to improve their display. Uncheck the box to turn MathJax off. This feature requires Javascript. Click on a formula to zoom.
ABSTRACT
In the screening of cervical cancer cells, accurate identification and segmentation of nucleus in cell images is a key part in the early diagnosis of cervical cancer. Overlapping, uneven staining, poor contrast, and other reasons present challenges to cervical nucleus segmentation. We propose a segmentation method for cervical nuclei based on a multi-scale fuzzy clustering algorithm, which segments cervical cell clump images at different scales. We adopt a novel interesting degree based on area prior to measure the interesting degree of the node. The application of these two methods not only solves the problem of selecting the categories number of the clustering algorithm but also greatly improves the nucleus recognition performance. The method is evaluated by the IBSI2014 and IBSI2015 public datasets. Experiments show that the proposed algorithm has greater advantages than the state-of-the-art cervical nucleus segmentation algorithms and accomplishes high accuracy nucleus segmentation results.
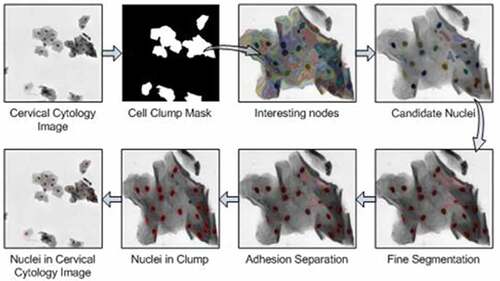
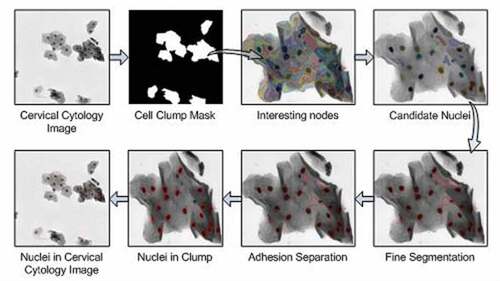
Graphical abstract
Introduction
Cervical cancer is the second common type of cancer in women, with more than 250,000 women dying from it every year [Citation1]. Fortunately, if early cancerous lesions caused by human papillomavirus HPV are detected in time, cervical cancer can be cured. The cure rate of cervical lesions depends on the stage of the lesion at the time of diagnosis. If not treated in time, it is likely to cause death.
A pathologist observes a Papanicolaou smear of HPV-positive patient through a microscope, and determines whether there are diseased cells in the image according to the morphology of cervical cells and nuclei. This process is called Papanicolaou (PAP) test. Pap test is one of the most effective detecting methods for cervical cancer through manual screening. However, Pap screening is a time-consuming and repetitive task and requires a high degree of concentration. After a long period of work, the pathologists, who have significant experience in the screening area, may make mistakes due to fatigue and decreased attention. Therefore, a computer-aided diagnosis system (CAD) is needed to assist pathologists in segmenting and identifying cervical cancer cells.
The application of the CAD system reduces the workload of the pathologists and allows them to focus more on the diagnosis and identification of abnormal cervical cells. This improves the accuracy of cervical cancer detection, and further reduces the mortality and incidence of cervical cancer. In response to developing countries with a lack of pathologists, CAD improves the diagnostic efficiency of pathologist; therefore, CAD is also beneficial for the early detection of cervical cancer for developing countries.
When cervical cells are infected, the shape, color, texture, and other characteristics of their nuclei are abnormal. The CAD system must accurately segment the nucleus and determine whether the cells have lesions through feature extraction and classification. The accuracy of nucleus segmentation, as the first step in cancer cell screening, has an effect on the accuracy of the CAD system. A nucleus usually corresponds to a cervical cell; thus, the accuracy of nucleus detection directly affects the subsequent cytoplasm segmentation and recognition. The overlapping, uneven staining, poor contrast, and the presence of neutrophils are also major challenges in cervical nucleus segmentation. Some scholars have studied the nucleus segmentation in single-cell regions and overlapping cervical cell images, respectively.
In the cervical cell images observed under a microscope, the cells are in a state of isolate, adhering or overlapping. Cervical cell samples containing only one isolate cell are shown in . Only one boundary (nucleus) or up to two boundaries (nucleus and cytoplasm) need to be detected in these sample images.
Figure 1. Cervical cell samples containing only one isolate cell
Bamford et al. [Citation2] segmented cervical nucleus using active contour method (ACM) based on Viterbi search which could solve the initialization and minimization of the ACM algorithm. Wu et al. [Citation3] utilized a cost function with a hypothetical parameter elliptical shape to detect the nucleus boundary of isolate cells in cervical cytology images. Plissiti et al. [Citation4] applied the local minimum value of the gradient image to identify the position of the nucleus candidate centroids in the Pap smear image, and screened centroids using the color feature of the centroid square neighborhood and the support vector machine classifier. Then, the centroids were regarded as the marker of the watershed algorithm and the false-positive regions were restricted by the binary support vector machine and the shape, texture, and intensity features.
Figure 2. Overlapping or adhering cervical cell Images. Image (a) is an adhering cell clump and image (b), image (c) are overlapping cell clumps
However, the common cervical cells are in adhesion or overlapping cell clumps as shown in . We cannot make any assumptions about the number of cells, or expect the cells in the image to be isolated from each other.
In 2014 and 2015, ‘Extended Depth of Field (EDF)-based Overlapping Cervical Cell Segmentation Challenge’ organized by the IEEE International Biomedical Imaging Symposium which published the ISBI2014 and ISBI2015 datasets of overlapping cervical cells, respectively. Many scholars have proposed different methods for nucleus segmentation based on the ISBI2014 and ISBI2015 public datasets. The algorithms for nucleus segmentation are mainly divided into simple linear iterative clustering (SLIC) method [Citation5–Citation8], region-based segmentation method [Citation7,Citation9–Citation13], convolutional neural network (CNN) [Citation14–Citation17], and clustering method [Citation18–Citation28]. SLIC superpixel algorithm is one of the most popular nucleus segmentation methods currently. It identifies nuclei by generating regular compact superpixels. For the ISBI2014 dataset, Lee et al. applied a triangular threshold method to extract cell clumps and candidate nuclei from superpixels obtained by SLIC method [Citation5]. Afaf et al. [Citation6] constructed the boundary feature vector to classify superpixels. It can solve the problem of over-segmentation of superpixel methods, but the problem of under-segmentation was not solved. For the ISBI2015 dataset, Lu et al. [Citation7] obtained a superpixel boundary map of cervical cytology images by the SLIC method and edge detection algorithm. Afterward, the boundary map was utilized to extract cell clumps and candidate nuclei by the Gaussian mixture model and maximally stable extremal region (MSER) algorithm. Tareef et al. [Citation8] applied a triangular transformation algorithm to identify cell clumps, and combined the SLIC algorithm with a marker-based watershed algorithm to extract candidate nuclei. The SLIC algorithm can accurately segment consistent size targets. The nucleus area at different growth stages has obvious differences. The area of the diseased nucleus is larger than that of the normal nucleus, and can even be six times the size of the normal nucleus. Therefore, it is difficult to accurately extract the nucleus in the cervical cytology image using the SLIC algorithm.
In recent years, region-based segmentation method and CNN have been applied in the field of nucleus segmentation. Jung et al. [Citation9] utilized the MSER algorithm to identify nuclei regions of cervical cytology image. Lu et al. [Citation7] used the MSER algorithm to identify cell clumps and candidate nuclei and applied the nucleus ellipticity feature to screen candidate nuclei. However, in the cervical cytology images with overlapping cells, the region-based method always presents the false positive and false negative nucleus detection. Song et al. [Citation14] used the CNN algorithm to classify each pixel in a cervical cytology sample into three categories: background, cell clump, and nucleus. This method has greatly improved the accuracy of nucleus extraction. However, the number of parameters that need to be adjusted by the algorithm, the amount of data of the training samples, and a large number of calculations are all problems that cannot be ignored.
Fuzzy C-means clustering (FCM) method [Citation18] was widely used in medical image segmentation, where the FCM algorithm and its improved algorithms were mainly utilized for the segmenting brain MR images [Citation19,Citation20]. Saha et al. [Citation22] adopted first the FCM algorithm for overlapping cervical cytology image segmentation, which added a circular function (CSF) to the FCM algorithm to increase the robustness of the FCM algorithm and improved the boundary segmentation performance. They did further work [Citation21] by adding the MSER algorithm to adaptively calculate the spatial shape force threshold. Compared to the [Citation22], it can get better results based on the recall and precision metrics. However, the segmentation results of the method [Citation21] are dependent on the categories number of clustering. Saha et al. [Citation21] obtained the appropriate categories number of clustering through training set statistics. The selection of the categories number of clustering is a key issue in the performance of FCM and its improved algorithms.
In our paper, we propose a nucleus segmentation algorithm based on multi-scale FCM to address the selection of the categories number of clustering algorithms. Then, we adopt a novel interesting degree based on area prior to measure the interesting degree of the segment. The nodes with appropriate size, uniform intensity distribution, and large solidity can be obtained by the interesting degree based on area prior. Experiments show that the proposed algorithm has greater advantages than the state-of-the-art cervical nuclei segmentation algorithms.
Method
The nucleus segmentation method is mainly divided into three steps in this paper. The first step is to identify the cell clumps, which is to separate the foreground and background region from the cervical cytology image. In the second step, the multi-scale segments are acquired by the multi-scale FCM algorithm, and then a hierarchical tree is constructed. Afterward, the interesting node in the hierarchical tree is identified in terms of the proposed interesting degree based on area prior. The third step is to achieve nuclei. The DRLSE [Citation29] method is used to finely segment the nucleus boundary and then concave point detection is applied to separate adherent nuclei to get candidate nuclei. Some non-nucleus regions with different shapes and intensity in the candidate nuclei after fine segmentation and adhesion separation are removed by utilizing the feature threshold method to acquire the nucleus region. The process of nucleus segmentation algorithm is shown in .
Figure 3. Nucleus segmentation algorithm
Cell clump extraction
We utilize the cell clump mask to limits the search range for reducing the computational complexity of nucleus segmentation, and separate the cell clump and background regions by the gray value. The FCM algorithm was proposed by Dunn et al. [Citation30] and improved by Bezdk et al. [Citation18]. Bezdk’s FCM method has the advantage of a small amount of calculations, so we use the Bezdk’s FCM algorithm [Citation18] to extract the cell clump region in the cervical cytology image.
We define I as the cervical cytology sample. Denote the gray value of the pixel pi at position of the sample I as
, where
represents the number of pixels in the sample I. We utilize the Bezdk’s FCM algorithm to cluster the
gray values into three categories, corresponding to the nucleus, cytoplasm, and background, respectively. Denote vk as the cluster centers,
. The fuzzy partition matrix is defined as
, where
represents the membership degree between gray value of pixels i and the category k, and the membership degree should satisfy (1) and (2).
The objective function of the FCM algorithm is defined as (3), where d is the Euclidean distance of the gray value grayi and the cluster center vk.
FCM is based on the minimization of the objective function. The cluster centers are updated by (4) iteratively.
Afterward, the membership degree matrix U is updated by (5).
Remarks: In actual cervical cell images, the nucleus, cytoplasm, and background areas generally exhibit three typical levels in grayscale. We take the value of category K = 3 in FCM clustering so that the nucleus, cytoplasmic and background regions can be recognized accordingly; On the basis of this, the nucleus region and the cytoplasmic region are combined into a cell clump region; thus, the cell clumps and the background regions can be separated.
Interesting node extraction
Uneven staining, insufficient light, and cell overlap have brought great challenges to the nucleus segmentation of cervical cell clump. Our method utilized three steps to extract the interesting node in the cell clump image. Firstly, the multi-scale FCM algorithm is used to divide the cell clusters at different scales. Afterward, we construct a hierarchical tree based on the inclusion relationship between the segments in the result of the multi-scale division. Finally, interesting nodes in the hierarchical tree are identified according to the proposed interesting degree based on area prior.
Cell clump segmentation based on multi-scale FCM algorithm
The multi-scale segmentation of the cell clump is to acquire cell clump divisions at different segmentation scales. Different scales can be regarded as segmentation granularity, that is, the smaller the scale, the finer the division of cell clusters. The gray value of the nucleus is generally lower than that of the surrounding cytoplasm, and its intensity of the area is consistent. However, the gray values of cervical cells and nuclei in different locations and growth periods are varied. For example, the surface layer of cervical squamous epithelial cells has a concentrated chromatin in the nucleus region, and its gray value is low, as shown in ); the squamous epithelial cells in the middle layer, by comparison, have loose chromatin and the nucleus gray value is higher than that of the surface nucleus as shown in ); in terms of the overlapping of cells in the cytoplasm area, the cytoplasm may have a lower gray value as shown in ).
Figure 4. Cervical cells in different locations and growth period. (a) The surface layer of cervical squamous epithelial cells. (b) The squamous epithelial cells in the middle layer. (c) The overlapping of cells in the cytoplasm area
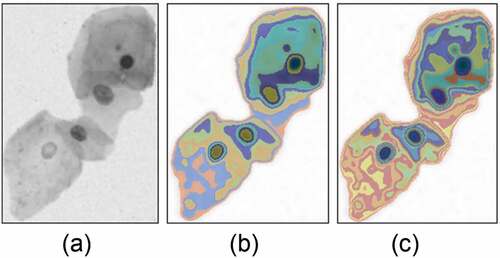
The cell clump generally contains multiple cervical cells with different growth periods. In this case, its intensity range is large, and the nucleus region with high intensity may be similar to that of the cytoplasmic region with low intensity caused by overlapping cells. A standard FCM algorithm with clustering category K = 2 is used to cluster all the pixels in the cell clump based on the intensity feature, which can only divide the clump into two parts: high-intensity region (cytoplasmic region and lighter nucleus region) and low-intensity region (nucleus region and darker cytoplasmic region) as shown in . The images in ) are cytoplasm with the low gray value and nucleus with the high gray value, respectively. The FCM algorithm with clustering category K = 2 cannot correctly divide the cell clump into nucleus and cytoplasm. By setting the appropriate categories number, the FCM algorithm can better extract the nucleus and cytoplasmic regions. As shown in ), the FCM algorithm with k = 10 can segment the nuclei in the cell clump well. The FCM algorithm with clustering category K = 20 can also accurately identify the nuclei in the cell clump, but it can be seen from that some nuclei are over-segmented.
Figure 5. FCM segmentation of the cell clump with clustering category K = 2. a) The original image. b) The segmented result with clustering category K = 2. c) Incorrect segmentation
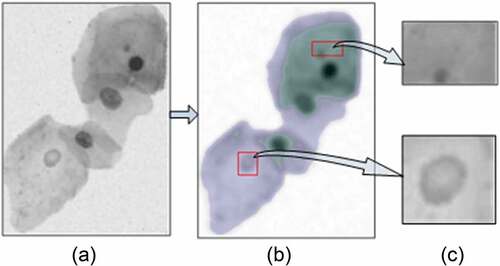
Figure 6. FCM segmentation of the cell clump with clustering category K = 10 and K = 20. (a) The original image. (b) The segmented result with clustering category K = 10. (c) The result with K = 20
The selection of categories number is a challenge for FCM algorithm in the nucleus segmentation of cervical cytology images. An appointed categories number applying to the different cells in the cervical cytology image may result in the simultaneous existence of over-segmentation and under-segmentation. We utilize the multi-scale FCM method to avoid the problem of the categories number selection.
If the region Rsi that is i-th region under the 1/2 s scale can be performed s + 1 consecutive binary classification from the clump according to divisible principle, it is called divisible region under the 1/2 s scale. Under the 1/2 s−1 scale, the divisible regions are divided by FCM with clustering category K = 2 and the segmented result is represented as Rsa, and other region is expressed as Rs−1b. We define the union set as the division of cell clump at the scale 1/2 s, expressed as Rs.
The original cell clump can be expressed as R0. The divisible principle of this paper is that when the region Rs−1i does not meet the area and intensity thresholds, it can only perform s-1 consecutive binary classification. As the scale decreases, the cell clump is divided into smaller segment. When the cell clump division satisfies
under scale 1/2 s, is the smallest scale division of the cell clump, where N is the number of segments in the cell clump; R is the cell clump area; Area(Ri) and Gray(Ri) are the area and average values of intensity of the segment Ri, respectively.
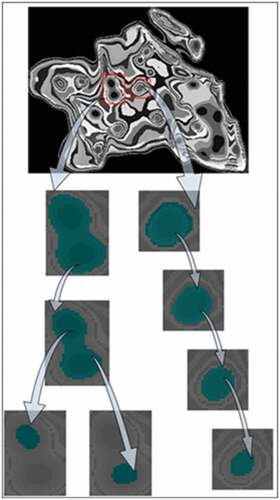
Hierarchical tree construction
To easy analysis attributes of the segments, we construct a hierarchical tree for the segments under different scales. The hierarchical tree can make full use of the inclusion relationship between the segments of adjacent scales. The prerequisite for constructing the hierarchical tree is that segments satisfy the nesting structure, which requires that the segment is consistent with or included in another segment in the larger scale. The proposed multi-scale clustering algorithm clusters the segments that meet the divisible principle in the larger scale, though it satisfies the requirements of the nesting structure between adjacent scales.
The segments of each scale are represented as a node of the hierarchical tree. If two nodes have nesting and continuous scale relationship, they are connected by one edge, and the node with large a area is expressed as a parent node. Therefore, the root node of the hierarchical tree is the cell clump, and the leaf nodes represent the segments not meeting the divisible principle. Because the cell clump mainly contains the nucleus and cytoplasm, we adopt K = 2 as the number of cluster categories. The cell clump is the highest layer of the hierarchical tree, and the leaf nodes are the lowest layer of the tree, as shown in .
Figure 7. Hierarchical tree structure of cell clusters
Recognition of interesting node and selection of candidate nuclei
We identify the interesting nodes from nodes in the hierarchical tree, and then classify them into candidate nucleus and cytoplasmic nodes.
Akçay et al. [Citation31,Citation32] utilized the standard deviation difference and the number of pixels of the nodes to evaluate the interesting degree of nodes, as shown in (7)
where the first term is the number of pixels of the node and the second term is the standard deviation difference between the parent of node parent and itself. The method introduced the number of pixels as another factor to overcome the disadvantages of using only the spectral homogeneity factor. However, these two methods overemphasize the area factor, which tends to identify a node with a large area as an interesting node. According to the area of the nucleus, these two methods are not suitable for measuring the degree of interesting node of the hierarchical tree in this paper.
The nucleus has the features of uniform intensity and large solidity. After the nucleus merges with the surrounding cytoplasm, the intensity value of the region changes drastically. However, in extreme cases, the solidity of a single pixel is the largest. Therefore, we look forward to obtain nodes with appropriate size, uniform intensity distribution, and large solidity.
In this paper, the similarity between nodes is calculated using the intensity consistency measure based on the area prior, which is shown as (8), (9).
where n1 represents the number of pixels in R1; and s1, s2 represents the variances of R1 and R2, respectively. The solidity S of the region is defined as the ratio of the area of the segment to the area of its convex hull, that is, . When the shape of the segment is non-concave, its solidity is the largest.
Finally, the interesting degree of node R is defined as shown in (10), and then it is calculated in the hierarchical tree.
Based on interesting degree, a node is observed when a node with moderate area and high solidity remains the same or merges with similar regions in the higher layer. The following steps are to identify the interesting nodes in the hierarchical tree.
Let N and P be the set of all nodes and their paths in the hierarchical tree, respectively. A subset N* of N is a set of interesting nodes. Nodes in N* meet three conditions: 1) the interesting degree of a node must be higher than that of its descendants; 2) any two nodes are not on the same path, that is, any interesting node do not overlap; 3) each path of the hierarchical tree contains only one node in N*, that is, these interesting nodes constitute a complete cell cluster area.
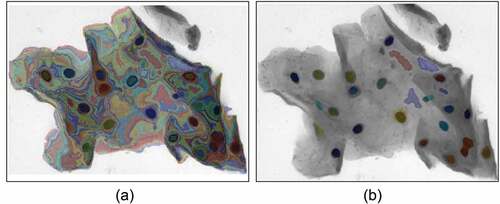
The interesting node in the hierarchical tree contains the nucleus region expected and cytoplasmic regions. We use support vector machines (SVM) to classify candidate nucleus and cytoplasm regions from interesting nodes. Radial basis function SVM classifier is trained using the features of intensity, solidity, and area in 400 nucleus regions and 2343 cytoplasmic regions from Baseline dataset [Citation33]. Utilize trained classifier to classify the interesting node to obtain the candidate nucleus, as shown in .
Figure 8. Interesting nodes and candidate nuclei. (a) Interesting nodes. (b) Candidate nuclei
Nuclei extraction
The boundary of the candidate nucleus region is around the true nucleus, which cannot accurately describe the true boundary of the nucleus. Therefore, the DRLSE [Citation29] method is used to finely segment the nucleus boundary, and then concave point detection method is applied to separate the adherent nucleus. There are some non-nucleus regions with different features such as shape and intensity in the candidate nuclei after fine segmentation and adhesion separation. These non-nucleus regions are removed by the feature threshold method.
Candidate nuclei refinement
The energy function defined by the DRLSE model is shown in (11), and the external term of the energy function is defined according to different application scenarios [Citation29].
We utilize a boundary-based active contour model as the external term of the level set evolution algorithm in this paper. Therefore, the energy functional of DRLSE is
where is the level set function;
is a distance regularization term maintaining the sign distance function property of the level set function;
,
are the parameters;
and
represent the length functional and area functional, respectively.
Distance regularization term is shown in (13), where
is defined as a potential function,
.
Functionals ,
, and
,
,
are defined as follows:
where is the Dirac Delta function;
is Heaviside step function. By Dirac Delta function, the energy
represents the curve integral of the function
along the zero level set contour of the level set function
. In (16),
represents the image on the domain
and
is the boundary indicator function.
represents the gradient value of the image after Gaussian denoising, where
is the Gaussian kernel with standard deviation
and ‘*’ is the convolution operation for the purpose of noise reduction.
When the contour of the zero level set is at the target boundary, the energy functional gets the minimum value. The area functional calculates the weighted area of the region. In special case
, the energy function is exactly equal to the area of the region
. The length functional
controls the evolution speed and direction of the zero level set contour. When the initializing contour lies far from the target boundary, the area functional
has an essential effect. The candidate nucleus is used as the initializing contour of level set in our paper.
In practice, the Dirac Delta function and Heaviside step function
are approximated by
and
in the
and
. The
and
are defined as (17) and (18).
Note that the derivative of is
, that is,
. The parameter
is generally set to 1.5. Then, the energy functional is approximated by (19).
The minimum value of the energy functionanl is obtained by solving the following gradient flow.
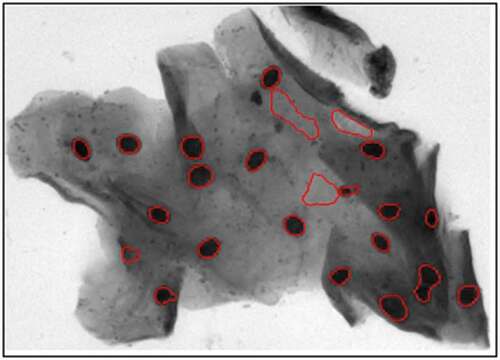
The candidate nuclei processed by the DRLSE algorithm are shown in , where most of them close to the nucleus boundaries and the red boundaries are obtained by the DRLSE algorithm.
Figure 9. Nucleus boundaries obtained by the DRLSE algorithm. The red boundaries are obtained by DRLSE
Adhesive nucleus segmentation and nucleus screening
The adhesion nucleus segmentation is an important part of the CAD systems. We utilize the concave point detection [Citation34,Citation35] method to segment the adhesive nuclei. Morphological features (geometric center and arc-to-chord ratio) and gradient features (radial symmetry center) are used to determine whether the nuclei are adherent. If the candidate nuclei meet adhesion conditions, the nuclei are called adhesion nuclei. The adhesion conditions are defined as follows:
Condition 1: , Condition 2:
where ri is the radial symmetry center; gi is the geometric center; and is the Euclidean distance. The shape parameter Fs is defined as Fs = L2/4πFa, where
is the perimeter and Fa is the area of the candidate nucleus. If the adhesion nuclei satisfy condition 1, the line connecting the two points with the largest arc-to-chord ratio is used as the segmentation boundary to segment the adherent nuclei. If the adherent nuclei satisfy Condition 2, a radial symmetry method [Citation34] is utilized to separate the adherent nuclei. The separation line obtained by the above two methods generally cannot accurately describe the occlusion boundary, which may affect the reliability of nucleus feature extraction. In this paper, these separated regions are used as the initial regions of the DRLSE algorithm, and then the precise nucleus regions are obtained by the level set method post-processing.
There are some pseudo-nuclei in the candidate nuclei, so-called outliers. In this paper, the area, solidity, and eccentricity features are used to screen candidate nuclei. Firstly, the nucleus whose area is smaller than the area threshold is filtered. Then, the candidate nuclei that do not meet the solidity and eccentricity are removed. Finally, the nuclei whose average value of intensity is larger than that of the cell cluster are filtered. The specific threshold value and its acquisition method are given in the experimental section.
Experiment and result analysis
Experimental sample
In this paper, the datasets published by the ISBI2014 and ISBI2015 challenges are used to evaluate the proposed cervical nucleus segmentation method, respectively. The ISBI2014 public dataset contains a total of 945 synthetic cervical cytology images with different cell numbers and overlap rates. The synthetic cell image generation process is as follows: A 40x objective Olympus BX40 microscope and a four-megapixel SPOT Insight camera are used to observe four cervical smear samples, and 16 non-overlapping fields of view are obtained. Each field contains about 20–60 Pap smear cervical cells. These cells are isolate (do not overlap with other cells) or overlapping with other cells. We can obtain at least 20 focus plane images from each field of view, and the cells show focus or defocus on different focus planes. An overcomplete discrete wavelet transform algorithm is used to generate an EDF (Extended Depth of Field Image) from the multiple focus plane images in a field of view. In the EDF image, every cell in this field of view is in focus. The background of the 16 EDF images and 53 isolate cells is labeled. Utilizing the labeled background and isolate cells, a synthetic cervical cytology image with a resolution of 512 * 512 is synthesized. The synthesis process is as follows:
Step 1: pixels are randomly selected from the labeled background to constitute the background of the synthetic image;
Step 2: a isolate cell is selected and performed random rigid transformation (rotation, translation scaling) and random linear brightness transformation; the cell passes through the alpha channel (sampling range [0.88, 0.99]); it is placed on the background obtained in step 1.
Step 3: another isolate cell is selected and transformed by the operation of step 2. The added cell need to overlap with the existing cells with one of the following overlap rate ranges [0, 0.1], [0.1, 0.2], [0.2, 0.3], [0.3, 0.4], [0.4, 0.5]. This process is repeated until the number of cells in the synthetic image meets the requirements. The formula for calculating the overlap ratio is
where A and B represent two cell regions; and represents the area of the region. In the synthetic process, the nucleus and cytoplasm boundaries are recorded as the artificial labeling results (gold standard) of these 945 synthetic images.
There are 17 samples in the ISBI2015 public dataset, and each sample contains 20 different focus plane images and an EDF image in the same field of view. The image in the dataset is a gray level image with a resolution of 1024 * 1024. Each sample contains about 40 cervical cells with different overlap ratio, contrast, and texture. Eight samples in the dataset are defined as the training set. The training set published the nucleus and cytoplasm labeled images. The remaining nine samples are used as the testing set and only the cytoplasm labeled images are published. The ISBI2014 dataset samples and the eight training set samples of ISBI2015 data are used to evaluate the performance of our nucleus segmentation algorithm.
Evaluation method
If nucleus segmentation results meet
and
, it is said that the nucleus
is correctly detected, where B is the artificial labeling of the nucleus (the gold standard) [Citation34]. The nucleus segmentation results are evaluated by precision Preobj and recall Recobj evaluation metrics based on the object. Preobj and Recobj are defined as follows:
where Cd indicates the number of detected nuclei correctly; D indicates the number of detected nuclei; Gt indicates the number of nuclei in the labeled image.
Nucleus segmentation accuracy is evaluated using pixel-based precision Prepix, recall Recpix, and Dice coefficient DC, which are defined as follows:
where Cdp indicates the number of correct detections; Dp indicates the number of detections; Gtp indicates the number of nucleus pixels in the labeled image.
The nucleus segmentation results also can be evaluated by the positive prediction accuracy (PPV), negative prediction accuracy (NPV), and the harmonic mean F of between PPV and NPV [Citation14], which are defined as follows [Citation35-Citation39]:
where TP indicates the number of pixels correctly predicted as a positive class; FP indicates the number of pixels incorrectly predicted as a positive class; TN indicates the number of pixels correctly predicted as a negative class; FN indicates the number of pixels incorrectly predicted as a negative class; positive type indicates that the pixel is inside the nucleus, and negative type indicates that the pixel is outside the nucleus.
Results
In our nucleus segmentation algorithm, we set iter_inner = 10, iter_outer = 5 for the DLRSE algorithm. To make the distance regularization term weight μ in (10) satisfy the Courant-Friedrichs-Lewy condition [Citation29], the distance regularization term weight μ is set to 0.04. We set the time step Δt = 5 to increase the evolution speed. When the difference of variance between areas within the adjacent two evolutionary zero-level set curves is less than δvar, it is considered that the level set function has no longer changed, and the zero level set contour at this time is the best approximation of the nucleus boundary. We set δvar = 0.001 as the stopping condition for the evolution of the level set function.
According to the energy functional of the DRLSE algorithm, the parameters λ and α of the length energy functional Lg(φ) and area energy functional Ag(φ) have a great influence on the evolution result of the level set function φ. Therefore, the performance of different combinations of λ and α for our algorithm is evaluated in terms of the precision, recall, and DC metric in the ISBI2014 training set. According to the position relation between the candidate nuclei and the true nuclei in the training set, 94% of the candidate nuclei are located inside the real nuclei. The area functional Ag(φ) controls the speed and direction of the evolution of the level set function. When the parameter α is greater than 0, it evolves into the region and vice versa. Therefore, −2, −4, and −6 are selected as the candidate value for parameter α. The energy functional requires the parameter λ of the length functional Lg(φ) is greater than 0, though we choose 4, 6 as the candidate value for the parameter λ. The performance of different combinations of λ and α for our algorithm is shown in .
Table 1. The performance of different combinations of λ and α for our algorithm
From , when the parameter α is fixed, the parameter λ change has little effect on the final experimental results. For example, when the parameter α is fixed with −4, the experimental result of λ = 6 is 1% higher than that of λ = 4 based on the pixel-based precision and DC metrics. However, when the value of the parameter λ is fixed and the parameter α is −2, −4, or −6, we can obtain different experimental results with the various parameter α.. The value of the α parameter is set to −2, a high pixel-based precision of 0.99 can be obtained, but the pixel-based recall is low. Therefore, the value of the parameter α parameter can’t be set to −2. The algorithm performance with α = −4 is not obvious different from performance with α = −6, and the DC metric of α = −4 is slightly higher than that of α = −6. Therefore, the best results are obtained from 45 synthetic cervical cell images in this paper by setting α and λ as −4 and 6, respectively.
We use 900 synthetic cervical cytology images from ISBI2014 and 8 EDF images from ISBI2015 training set as the testing set to evaluate the proposed nucleus segmentation method. The ISBI2014 dataset is synthesized by isolate nuclei in 16 EDF images from ISBI2014 challenge, and some of the EDF images of ISBI2014 are consistent with the EDF images published by the ISBI2015 challenge. Therefore, non-isolate nuclei from the test dataset of ISBI2015 are used as training nuclei for our study. This ensures that there is no intersection between the training set and the testing set, so that the proposed nucleus segmentation method can be evaluated more fairly. In nine EDF images, a total of 400 nuclei that meet the conditions are used as the training set in this paper. Adjust the thresholds of the area, shape, and solidity features based on the nucleus feature of the training set. All parameter settings in this paper are shown in .
Table 2. Parameter settings
Based on the 900 synthetic cervical cytology images, the nucleus detection performance and segmentation accuracy of the proposed method are evaluated. We also compared the method to the circular shape constraint FCM algorithm (CiscFC) [Citation21], the methods from ISBI2014 challenge [Citation7,Citation10,Citation36] and nucleus segmentation method proposed by Hady [Citation37], as shown in . In terms of nucleus detection performance, the object-based precision and recall of our algorithm are higher than that of the five other methods. And with regard to segmentation accuracy, pixel-based recall is 0.980 which is higher than that of other methods, and a competitive DC value is 0.936.
Table 3. Comparison with the state-of-the-art method
In this paper, experiments are performed on eight EDF images from the training set of the ISBI2015 public dataset, and the experimental results are compared quantitatively with different nucleus segmentation methods under different evaluation metrics, as shown in and .
Table 4. Compare with Lu’s algorithm
Table 5. Compare with the methods proposed by other scholars
On the ISBI2015 training dataset, our procedure and Lu’s procedure code [Citation7] are run on the same computer and software platform. On the basis of Preobj, Recobj, Prepix, Recpix, and DC metrics, the performance of the proposed algorithm is higher than that of Lu’s algorithm ().
Based on the EDF images from the testing dataset of ISBI2015, the algorithm in this paper is compared with the methods proposed by Hui [Citation11], Zhang [Citation32], Yousef [Citation12], Song [Citation41], respectively, on the three measurement methods of PPV, NPV, and F (). From , the nucleus segmentation method described in this paper shows excellent performance under these three metrics, and its performance is generally higher than the first four methods.
The algorithm runs 5 times on the training set of ISBI2014. The purpose is to identify the impact of random initialization of membership matrix and clustering center in the multi-scale FCM algorithm. Record the results of each algorithm run, and calculate the mean and variance, as shown in . From the results, the variance of the five experimental results is small based on the precision, recall, and DC metrics. Therefore, our multi-scale FCM nucleus segmentation algorithm is less affected by the random initialization of the membership matrix and clustering centers of the FCM algorithm.
Table 6. Experimental results of the algorithm run 5 times on the same dataset
Discussion
The cervical nucleus segmentation algorithm based on multi-scale FCM can accurately identify the nuclei in the cervical cytology image. From , on the ISBI2014 training set, the proposed algorithm achieved the best results compared with the five other nucleus segmentation algorithms mentioned in other literatures based on the object-based metric. The precision and recall of nucleus recognition of our algorithm reach 0.98 and 0.94, respectively. The precision of Lu’s algorithm is 0.977, which is the best result among the five other methods and is lower 0.4% than that of our method. In the metric of recall, Hady’s method of the five other methods obtains the best performance, and recall is 0.933, which is lower 0.63% than that of our method. From , the algorithm in this paper has achieved good results in terms of object-based precision and recall in the ISBI2015 training set. By comparison with Lu’s method, the precision and recall of the object-based algorithm in this paper are 7.2% and 7.8% higher than those of Lu’s algorithm, respectively.
Figure 10. Statistical histograms of pixel-based metrics
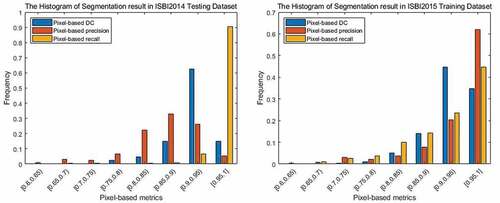
The statistical histograms of the experimental results on the ISBI2014 testing dataset and ISBI2015 training dataset under the pixel-based metrics are shown in . From (a), in the ISBI2014 testing dataset, pixel-based precision, recall, and DC values above 0.8 account for 0.870, 0.985, and 0.971 of all correctly identified nuclei, respectively. All correctly detected nuclei meet DC value is greater than 0.74, and the proportion of DC values that is higher than 0.95 reaches 34.7%.
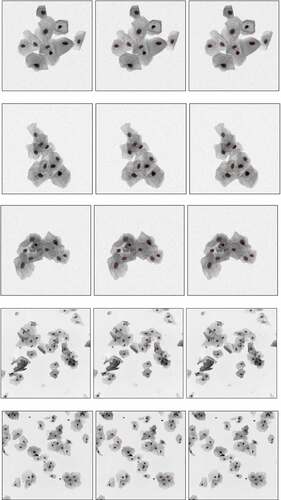
According to the above analysis, our algorithm can not only get a high detection rate of nucleus compared to other algorithms but also accurately segment the cell boundary. shows the final nucleus segmentation results of our method for synthetic datasets and EDF images.
Figure 11. Segmentation results. The left images are the synthetic image and the EDF image, the middle images are the labeled boundary images, and the right images are the nucleus boundary image obtained by the algorithm in this paper
The detailed results of the nucleus recognition with different numbers of cells and overlapping rate are shown in in the ISBI2014 testing dataset. When the number of cells is less than 3 and the overlap rate between cells is less than 0.3, the precision based on the object is 1, which means that the false recognition rate is 0. When the overlap rate is less than 0.2, even if the number of cells reaches 10, the proposed method can still get a lower false recognition result. When the number of cell nuclei is greater than 8 and the overlap rate is greater than 0.4, the error recognition rate of the algorithm reaches a maximum value of 0.08. If the overlap ratio is less than 0.2 among the cells, the recall obtained by the algorithm in this paper is greater than 0.95. As the degree of overlap among cells in the synthetic image increases, the recall rate decreases. When the overlap rate is greater than 0.4, the recall rate decreases obviously. When the number of overlapping cells increases to 9, the algorithm’s missed recognition rate reaches 20%. As the number of overlapping cells increases, the contrast decline and the nucleus occlusion cause misidentification. The nucleus gray value is not obvious and is occlusion, as shown in , where the rectangular marked area is the case where the nucleus contrast is reduced or occlusion.
Figure 12. Contrast reduction and occlusion in the area around the nucleus. The rectangular marked area is the case where the nucleus contrast is reduced or occlusion
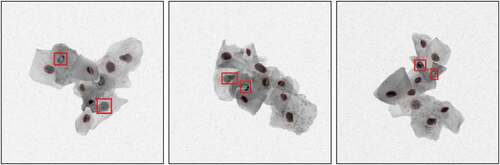
Table 7. Experimental results of samples with different cell numbers and overlap rates (object_based precision/object_based recall)
This experiment uses the following computer configuration: System: Windows7; Processor: Intel (R) core i5-3470; Memory: 12 GB; Hard disk: 500 G; experimental platform: Matlab R2018a.
For the ISBI2014 synthetic dataset, the average running time processing a cell is 2.5 S, and the average running time processing an image is 15 S. For real EDF images, the running time processing a cell and an image are 10 S and 360 S, respectively.
Conclusion
Nucleus segmentation of cervical smear images is a prerequisite for the widespread application of CAD systems. For the first time, the multi-scale FCM is used to segment the cervical nuclei. It addresses the problem of selection of the categories number of clustering algorithm and avoids the existence of over-segmentation and under-segmentation. Furthermore, a novel interesting degree based on area prior is proposed to measure the interesting degree of the node which can make full use of area and solidity feature of nuclei. The experimental results show that the proposed nucleus segmentation algorithm for cervical smear images has high segmentation precision and the performance of cervical nucleus detection greater than recent state-of-the-art methods.
Highlights
A multi-scale fuzzy clustering algorithm for nucleus segmentation is proposed.
The algorithm avoids selecting the categories number of the clustering algorithm.
A novel interesting degree based on area prior is adopted to measure the interesting degree of the segment.
The multi-scale FCM method can address over-segmentation and under-segmentation of FCM algorithm.
Disclosure statement
No potential conflict of interest was reported by the authors.
Additional information
Funding
Notes on contributors
Jinjie Huang
Jinjie Huang received his B.Sc. degree in 1990 from Harbin university of Science and Technology, received his M.Sc. degree in 1997 from Harbin university of Science and Technology, and received his Ph.D. degree in 2004 from Harbin Institute of Technology. Now he is a professor in Harbin university of Science and Technology. His main research interests include intelligent control of complex industrial process, pattern recognition and image processing.
Tao Wang
Tao Wang received his B.Sc. degree in 2010 from Harbin University of commerce, received his M.Sc. degree in 2013 from Harbin University of commerce. Now he is PhD student in Harbin University of Science and Technology. His main research interests include Image processing and pattern recognition.
Dequan Zheng
Dequan Zheng received his B.Sc. degree in 1991 from Heilongjiang University, received his M.Sc. degree in 1998 from Harbin Institute of Technology, and received his Ph.D. degree in 2006 from Harbin Institute of Technology. Now he is a professor in Harbin university of Commerce. His main research interests include data mining, electronic commerce, and artificial intelligence.
Yongjun He
Yongjun He received the B.S. degree in electrical engineering from the Harbin University of Science and Technology, Harbin, China, in 2003, the M.S. and Ph.D. degrees in the School of Computer Science from the Harbin Institute of Technology, Harbin, China, in 2006 and 2008, respectively. Currently, he is a Professor in the School of Computer Science and Technology, Harbin University of Science and Technology. His research interests include speech speaker recognition, machine learning, image processing, speech processing.
References
- World Health Organization, Comprehensive cervical cancercontrol: a guide to essential practice, World Health Organization, Department of Reproductive Health and Research and Department of Chronic Diseases and Health Promotion, Geneva, Switzerland, 2006.
- Bamford, P, and Lovell B. Unsupervised cell nucleus segmentation with active contours. Signal Process. 1998;71.2:203–213.
- Hai-Shan W, Barba J, Gil J. A parametric fitting algorithm for segmentation of cell images. IEEE Trans Biomed Eng. 1998;45.3:400–407.
- Plissiti ME, Nikou C, Charchanti A. Automated detection of cell nuclei in Pap smear images using morphological reconstruction and clustering. IEEE Transactions Inf Technol Biomed. 2011;15(2):233–241.
- Lee H, Kim J. Segmentation of overlapping cervical cells in microscopic images with superpixel partitioning and cell-wise contour refinement. Proceedings of the IEEE Conference on Computer Vision and Pattern Recognition Workshops; Las Vegas, USA, 2016. p. 1367–1373.
- Tareef A, Song Y, Cai W, et al. Automatic segmentation of overlapping cervical smear cells based on local distinctive features and guided shape deformation. Neurocomputing. 2017;221:94–107.
- Lu Z, Carneiro G, Bradley AP. An improved joint optimization of multiple level set functions for the segmentation of overlapping cervical cells. IEEE Trans Image Process. 2015;24.4:1261–1272.
- Tareef A, Song Y, Huang H, et al. Multi-pass fast watershed for accurate segmentation of overlapping cervical cells. IEEE Trans Med Imaging. 2018;37(9):2044–2059.
- Jung C, Kim C, S W C, et al. Unsupervised segmentation of overlapped nuclei using Bayesian classification. IEEE Trans Biomed Eng. 2010;57(12):2825–2832..
- Nosrati MS, Hamarneh G. A variational approach for overlapping cell segmentation. ISBI Overlapping Cervical Cytology Image Segmentation Challenge. 2014:1–2.
- Jia G, Han G, Jiang J, et al. Dynamic cloud resource management for efficient media applications in mobile computing environments. Pers Ubiquitous Comput. 2018;22(3):561–573.
- Jia G, Han G, Jiang J, et al. Dynamic time-slice scaling for addressing os problems incurred by main memory DVFS in intelligent system. Mobile Net Appl. 2015;20(2):157–168.
- Jia G, Han G, Jiang J, et al. PARS: A scheduling of periodically active rank to optimize power efficiency for main memory. J Network Comput Appl. 2015;58:327–336.
- Song Y, E L T, Jiang X, et al. Accurate cervical cell segmentation from overlapping clumps in pap smear images. IEEE Trans Med Imaging. 2017;36(1):288–300..
- Yin Y, Yueshen X, Wenting X, et al. Collaborative service selection via ensemble learning in mixed mobile network environments. Entropy. 2017;19(7):358.
- Yin Y, Chen L, Yueshen X, et al. location-aware service recommendation with enhanced probabilistic matrix factorization. IEEE Access. 2018;6:62815–62825.
- Yu J, Guo Y, Tao D, et al. Human pose recovery by supervised spectral embedding. Neurocomputing. 2015;166:301–308.
- Bezdek JC. Pattern recognition with fuzzy objective function algorithms. Kluwer Academic Publishers, New York, NY: Plenum; 1981
- Ahmed MN, Yamany SM, Mohamed N, et al. A modified fuzzy c-means algorithm for bias field estimation and segmentation of mri data. IEEE Trans Med Imaging. 2002;21(3):193–199.
- Adhikari SK, Sing JK, Basu DK, et al. Conditional spatial fuzzy c-means clustering algorithm for segmentation of {MRI} images. Appl Soft Comput. 2015;34:758–769.
- Saha R, Bajger M, Lee G. Circular shape constrained fuzzy clustering (CiscFC) for nucleus segmentation in Pap smear images. Comput Biol Med. 2017;85:13–23.
- Saha R, Bajger M, Lee G. Spatial shape constrained fuzzy C-Means (FCM) clustering for nucleus segmentation in pap smear images. 2016 international conference on digital image computing: techniques and applications (DICTA); Gold Coast, Australian; 2016. p 1–8
- Zhang J, Xiao J, Wan J, et al. A parallel strategy for convolutional neural network based on heterogeneous cluster for mobile information system. Mobile Inf Sys. 2017;2017: 1–12.
- Zhang J-L, Yuan J-F, Wan J, et al. Efficient parallel implementation of incompressible pipe flow algorithm based on SIMPLE. Concurrency Comput-pract Exp. 2016;28(6):1751–1766.
- Shrivastava S, Shrivastava L, Bhadauria SS. Performance analysis of wireless mobile ad hoc network with varying transmission power. Int J Sensor Appl Cont Sys. SERSC Australia, 2287-8467 (Print); 2207-6344 (Online). May 2015;3,(1):1–6.
- Yu Y, Rittle LJ, Bhandari V, et al. Supporting concurrent applications in wireless sensor networks. Proceedings of the 4th international conference on Embedded networked sensor systems. Boulder Colorado, USA; October, 2006: 139-152.
- Pradhan S, Sharma K. Cluster head rotation in wireless sensor network: a simplified approach. Int J Sen App Con Sys. SERSC Australia, 2287-8467 (Print); 2207-6344 (Online). May 2016;4(1):1–10.
- Dhakar JS, Parmar M. A survey on grid based data aggregation in wireless sensor networks. Int J Sen App Cont Syst. SERSC Australia 2287-8467 (Print); 2207-6344 (Online). May 2016;4,(1):11–18.
- Li C, Xu C, Gui C, et al. Distance regularized level set evolution and its application to image segmentation. IEEE Trans Image Process. 2010;19(12):3243–3254.
- Dunn JC. A fuzzy relative of the ISODATA process and its use in detecting compact well-separated clusters. J Cyber. 1973;3: 32–57.
- Akçay HG, Aksoy S. Automatic detection of geospatial objects using multiple hierarchical segmentations. IEEE Trans Geosci Remote Sens. 2008;46(7):2097–2111.
- GençTav A, Aksoy S, ÖNder S. Unsupervised segmentation and classification of cervical cell images. Pattern Recogn. 2012;45.12:4151–4168.
- Lu Z, Carneiro G, Bradley AP. Automated nucleus and cytoplasm segmentation of overlapping cervical cells. International Conference on Medical Image Computing and Computer-Assisted Intervention; Springer; Berlin, Heidelber; 2013.
- Kong H, Gurcan M, Belkacem-Boussaid K. Partitioning histopathological images: an integrated framework for supervised color-texture segmentation and cell splitting. IEEE Trans Med Imaging. 2011;30(9):1661–1677.
- Zhang L, Chen SP, Wang TF, et al. A practical segmentation method for automated screening of cervical cytology. Proc IEEE Int Conf Intell Comput Bio-Med Inst. Wuhan, China; Dec. 2011:140–143.
- Ushizima DM, Bianchi AGC, Carneiro CM. Segmentation of subcellular compartments combining superpixel representation with voronoi diagrams. No. LBNL-6892E. Berkeley (CA): Lawrence Berkeley National Lab. (LBNL); 2015.
- Phoulady HA, Goldgof D, Hall LO, et al. A framework for nucleus and overlapping cytoplasm segmentation in cervical cytology extended depth of field and volume images. Computerized Med Imaging Graphics. 2017;59:38–49.
- Li K, Lu Z, Liu W, et al. Cytoplasm and nucleus segmentation in cervical smear images using radiating GVF snake. Pattern Recogn. 2012;45(4):1255–1264.
- Zhang L, Kong H, Ting CC, et al. Automation-assisted cervical cancer screening in manual liquid-based cytology with hematoxylin and eosin staining[J]. Cytometry Part A. 2014;85(3):214–230.
- Lu Z, Carneiro G, Bradley AP, et al. Evaluation of three algorithms for the segmentation of overlapping cervical cells. IEEE J Biomed Health Inform. 2016;21(2):441–450.
- Al-Kofahi Y, Lassoued W, Lee W, et al. Improved automatic detection and segmentation of cell nuclei in histopathology images[J]. IEEE Trans Biomed Eng. 2010;57(4):841–852.