
ABSTRACT
Increasing evidence has shown that the tumor microenvironment (TME) plays an important role in tumor occurrence and development and can also affect patient prognosis. In this study, we screened key prognostic genes in the breast cancer (BC) TME by analyzing the immune and stromal scores of tumor samples to detect differentially expressed genes (DEGs) and also constructed a TME-related prognostic model. First, we obtained mRNA-Seq and related clinical information for patients with BC from The Cancer Genome Atlas (TCGA) and calculated the stromal and immune scores of tumor tissues using the ESTIMATE algorithm. Next, we performed functional enrichment analysis and generated protein–protein interaction networks from the DEGs that were highly related to the TME. Finally, Cox proportional hazards regression analysis was performed on BC datasets from TCGA, and analyses were conducted on infiltrating immune cells and the human protein atlas. Together, these analyses indicated that the KLRB1 and SIT1 genes could be used as independent prognostic factors for BC, while risk score, age, and clinical stage could be used as prognostic factors. In summary, we found that the prognosis of BC is closely related to immune regulation in the TME.
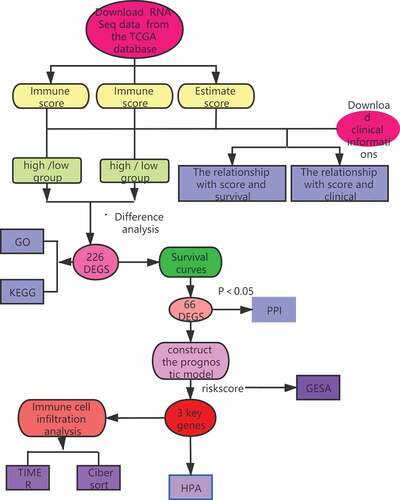
Graphical abstract
1. Introduction
Breast cancer (BC) is the second most common cancer after lung cancer and is a leading cause of cancer-related death among women [Citation1]. BC is a complex and heterogeneous disease with considerable variation in clinical manifestation, morphological and molecular properties, and treatment response [Citation2].
The internal environment of a tumor is known as the tumor microenvironment (TME) and includes both cellular and non-cellular components that have a significant effect on patient prognosis [Citation3]. The cellular components of the TME are considered to be markers of cancer regulation and exert important effects on tumor proliferation, angiogenesis, invasion and metastasis, and chemotherapy resistance [Citation4]. These include stromal cells, immune cells, blood vessels, lymphatic vessels, extracellular matrix (ECM), secreted proteins, RNA, and small organelles [Citation5]. Two-way communication between cells and their microenvironment is crucial for normal tissue homeostasis and tumor growth [Citation6]; however, studies have shown that the TME affects multiple stages of disease development, particularly local drug resistance, immune escape, and distant metastasis [Citation7].
Tumorigenesis and cancer progression are complex and dynamic processes, and considerable evidence has shown that the TME participates in the progression and metastasis of various types of cancer, including BC [Citation8]. Unlike tumor cells, stromal cells in the TME are genetically stable and have therefore become an attractive therapeutic target for reducing drug resistance and the risk of tumor recurrence [Citation9]. A variety of nonmalignant cell types in the TME can also affect the occurrence, development, metastasis, and treatment response of BC; however, the majority of the genetic mechanisms that contribute toward patient outcomes remain unclear [Citation10].Previous studies have demonstrated that the proliferation and metastasis of tumor cells are affected by immune cells and their mechanisms of action [Citation11], including tumor-associated macrophages (TAMs), myeloid-derived suppressor cells (MDSCs), CD4 + Th1 cells, CD8 + T cells, regulatory T cells (Tregs), and TH17 cells [Citation12]. Therefore, the TME and its infiltrating immune cells, cytokines, and growth factors play key roles in regulating BC [Citation13]and provide potential avenues for the development of first-line clinical interventions.
In this study, we screened key prognostic genes in the TME of BC by analyzing the immune and stromal scores of tumor samples to detect differentially expressed genes (DEGs) and constructed a TME-related prognostic model.
2. Materials and methods
2.1. Data acquisition and processing
We obtained the RNA-Seq data (HTSeq-FPKM) for patients with BC (lobular and ductal tumors) from TCGA database (http://portal.gdc.cancer.gov/), including (gdc_download_20200915_123045.956595, gdc_manifest_20200915_123011, metadata.cart.2020–09-15). Data were organized using perl software (http://www.perl.org/).
2.2. ESTIMATE
The immune and stromal scores for each BC sample were acquired using the ‘ESTIMATE’ and ‘limma’ packages in R (version 4.0.2). The estimation algorithm was used to compute the matrix and immune scores of BC tissues and to divide the samples into high (> median) and low (< median) scoring groups.
2.3. Identification of DEGs
The ‘limma Bioconductor’ software package in R (version 4.0.2) was used to identify DEGs and divide samples into high/low immune and stromal score groups based on the following cutoff conditions: |log2 fold change (log2FC)| > 1.0, false discovery rate (FDR) < 0.05. A Venn diagram was used to compare the up- and down-regulated intersecting genes related to immune/stromal score [Citation14]. The ‘pheatmap’ software package in R (version 4.0.2) was used to generate heatmaps [Citation15].
2.4. Functional enrichment analysis
The ‘clusterProfiler’, ‘enrichplot’, and ‘ggplot2’ software packages in R (version 4.0.2) were used to perform Gene Ontology (GO) and Kyoto Encyclopedia of Genes and Genomes (KEGG) enrichment analyses. GO has three independent branches: molecular function (MF), biological process (BP), and cellular component (CC). The KEGG database facilitates the systematic analysis of the intracellular metabolic pathways and functions of gene products. An FDR of <0.05 was defined as statistically significant [Citation16].
2.5. Survival curves
Kaplan-Meier (K-M) survival curves were plotted using the ‘survival’ package in R (version 4.0.2) to analyze the relationship between DEG expression and the overall survival of patients with BC. P values of <0.05 were considered statistically significant.
2.6. Protein–protein interaction (PPI) network analysis
STRING (https://string-db.org/) is a database that provides a function for predicted protein interactions, in which each PPI has one or more ‘scores’ that indicate the confidence in the interaction based on the available evidence. This score ranges from 0 to 1, with 1 being the highest possible confidence. The interaction relationships between the intersecting genes were acquired by PPI network analysis in STRING. Core genes were identified using the CytoHubba Cytoscape plug-in with the highest confidence (0.40) as a threshold.
2.7. Prognostic model construction
To simultaneously analyze the effect of many factors on overall survival (OS) we performed Cox regression analysis on BC patient samples in the TCGA database after excluding patients with no available (NA) survival time to obtain DEGs that affected patient prognosis. P values of <0.05 were considered statistically significant. A risk scoring formula was established based on the analysis results.
2.8. Gene set enrichment analysis (GSEA)
The selected KEGG gene set was downloaded from the MSigDB database and GSEA (version 4.0.3) was performed to explore the potential molecular mechanisms in the high- and low-risk groups and to acquire pathways for up- and down-regulation. An FDR of <0.05 was considered statistically significant.
2.9. Immune cell infiltration analysis
Using the TIMER database (https://cistrome.shinyapps.io/timer/), we retrieved correlations between DEG expression and immune infiltration levels. To estimate differences in the infiltration of 22 immune cell types between the low- and high-risk groups, CIBERSORT (https://cibersort.stanford.edu/about.php) was used to accurately estimate the immune cell components in tumor tissues.
2.10 Human protein atlas (HPA)
We obtained an immunohistochemistry expression graph of related genes from the HPA database (https://www.proteinatlas.org/). Multiple genes are differentially expressed in cancer, and many of these have an effect on the OS of patients.
3. Results
3.1. Effect of immune and stromal scores in patients with BC
The RNA-Seq data and clinical information for 1,049 patients with BC were downloaded from TCGA and tumor samples were evaluated using the ESTIMATE algorithm. Stromal scores ranged from −2070.44 to 2099.46, immune scores ranged from −1188.52 to 3661.56, and the ESTIMATE score ranged from −1188.52 to 3661.56. According to the median scores, all 1049 samples were divided into high- and low-score groups, and the relationships between each score and clinical characteristics were analyzed. The OS of patients with BC was significantly and positively correlated with a higher immune score (P = 0.015; ); however, there were no significant differences between stromal scores and ESTIMATE scores (). Patients in the low-age group were found to always show higher scores (), while clinical stage displayed a significant negative association with immune score (P = 0.022; ) but the stromal score was not statistically significant (P = 0.23; ). No other clinical factors displayed clear statistically significant effects (supplementary figure 1). These results indicating that stromal and immune scores of BRCA were positive factors in patient prognosis.
Figure 1. Analysis of correlations between clinical information and stromal/immune scores. Distribution of immune scores according to clinical OS (a), age (d) and stage (g). Distribution of stromal scores according to OS (b), age (e) and stage (h). Distribution of ESTIMATE scores according to OS (c), age (f) and stage (i). OS: overall survival
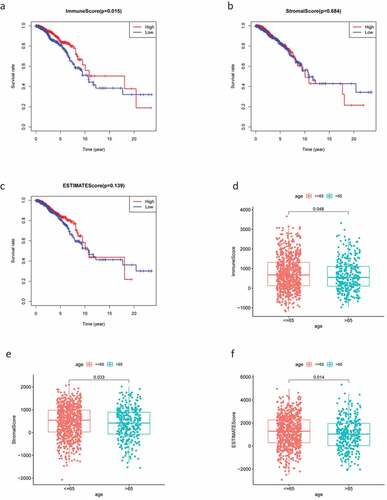
Figure 1. (Continued)
3.2. Identification of DEGs
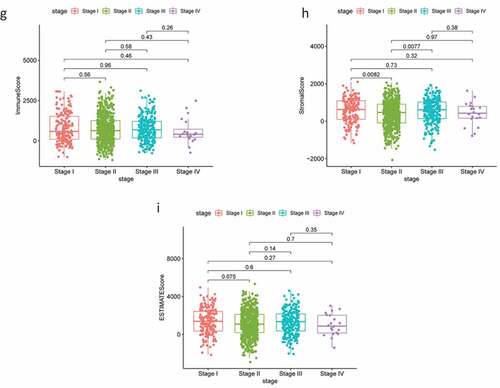
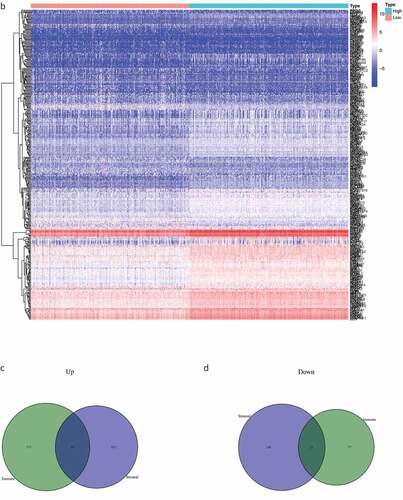
By comparing the gene expression levels of the high- and low-scoring groups, we screened DEGs with |log2FC| > 1.0 and FDR < 0.05, and displayed them as a heat map (). Statistical analysis identified 535 significantly upregulated and 77 significantly downregulated DEGs in the immune score group, as well as 452 significantly up-regulated and 108 significantly down-regulated genes in the stromal score group. These genes related to immune and stromal scores were visualized using Venn plots (,).
Figure 2. The DEGs between high and low stromal/immune score groups and the overlapping genes related to both stromal and immune score. The heatmap shows the DEGs between the high immune score group and the low immune score group (a). The DEGs between the high stromal score group and the low stromal score group (b). The color indicates the fold change of gene expression; the greater the change is, the darker the color (red is up, blue is down). The Venn diagram shows the upregulated genes related to both immune score and stromal score (c). Downregulated genes related to both immune score and stromal score (d). DEGs: differentially expressed genes
Figure 2. (Continued)
3.3. Functional enrichment analysis
Next, we conducted a functional enrichment analysis on 226 significant DEGs. GO analysis () revealed that the top five enriched BP terms were ‘alpha−beta T cell activation’, ‘mononuclear cell proliferation’, ‘lymphocyte proliferation’, ‘adaptive immune response based on somatic recombination’, and ‘lymphocyte-mediated immunity’. The top five enriched CC terms were ‘external side of plasma membrane’, ‘secretory granule membrane’, ‘tertiary granule’, ‘specific granule’, and ‘ficolin−1−rich granule membrane’. The top five enriched MF terms were ‘immune receptor activity’, ‘cytokine receptor activity’, ‘chemokine binding’, ‘C−C chemokine binding’, and ‘C − C chemokine receptor activity’. The Circos plots () showed that the GO terms were mainly related to α-β T cell activation, lymphocyte differentiation, the regulation of T cell activation, T cell activation, and T cell differentiation.
Figure 3. DEG functional enrichment analysis results. (a) GO enrichment results show the top 10 BP terms, CC terms and MF terms. (b) The circos plots show the enrichment relationship between genes and the main enriched terms in GO. (c) The KEGG enrichment results show the 13 paths. (B) The circos plots show the enrichment relationship between genes and the main enriched terms in KEGG. DEG: differentially expressed gene. GO: gene ontology. MF: molecular function, BP: biological process, CC: cellular component. KEGG: Kyoto City Encyclopedia of Genes and Genomes
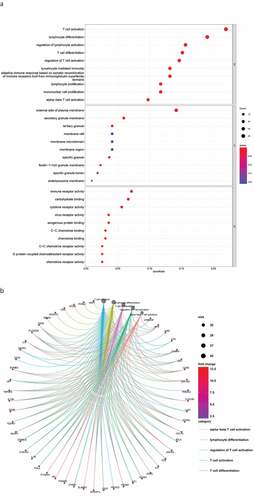
Figure 3. (Continued)
KEGG pathway analysis () revealed 13 major signaling pathways, including viral protein interaction with cytokines and cytokine receptors, cytokine −cytokine receptor interactions, viral protein interaction with cytokines and cytokine receptors, hematopoietic cell lineage, malaria, and chemokine signaling pathways. Circos plots () indicated that the KEGG pathways were mainly related to viral protein interaction with cytokines and cytokine receptors, malaria, cytokine−cytokine receptor interactions, hematopoietic cell lineage, and chemokine signaling pathways. In addition, these DEGs were significantly associated with immune regulation and thus require in-depth analysis.
3.4. Survival curves
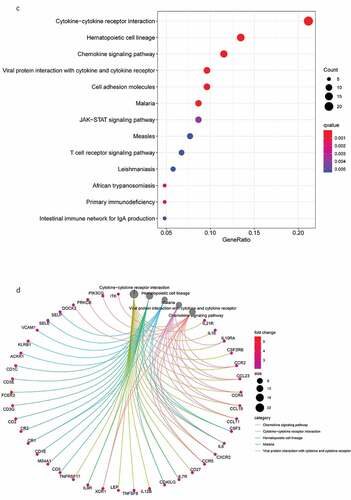
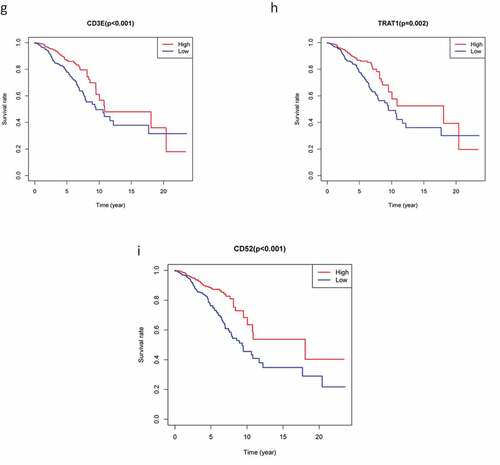
To explore the prognostic association between the DEGs and the OS of patients with BC, we conducted survival analysis on the 226 overlapping DEGs, 66 of which were associated with OS (P < 0.05). Representative K-M curves for several genes are shown in and further details are provided in Supplementary Table 1A.
Figure 4. The survival curve shows the effect of the expression levels of 9 DEGs. In the figure, the overall survival time of patients with high gene expression (red line) was compared with the overall survival time of patients with low gene expression (blue line). P < 0.05 means the difference is significant. DEGs: differentially expressed genes
Figure 4. (Continued)
3.5. PPI network analysis
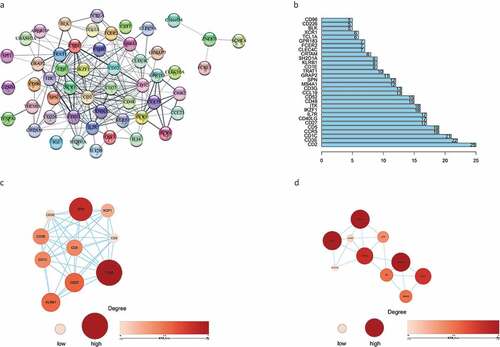
A PPI network was constructed from the 66 genes that may have prognostic value using the STRING network analysis tool and core genes were analyzed using the CytoHubba plugin in Cytoscape software. The PPI network consisted of 66 nodes and 214 edges. The subnetwork with the most nodes and edges is shown in . We identified the top 30 central genes in the PPI network (), of which the top 10 nodes ranked by degree were CD2, CD3E, CD1C, CCR5, CD5, CD27, CD40LG, IL7R, IKZF1, and ITK. After the entire PPI network had been loaded into the cell landscape, two important hub genes, CD48 and CD1E, were subjected to further analysis (,). Notably, the majority of the key nodes in the PPI network consisted of proteins/genes involved in immune regulation.
Figure 5. The PPI network was constructed, and two important modules were obtained by using Cytoscape. (a) PPI network of differentially expressed genes with integrated scores larger than 0.40. (b) The top 30 central genes identified in the PPI network. (c) CD48 module. (d) CD1E module. The darker the color of the node is, the greater the log2FC value of the gene expression and the larger the size of the node, the greater the number of edges between the gene and other genes. PPI: protein-protein interaction
3.6. Construction of a three-gene prognostic model for BC
To analyze the effect of various factors on OS, we constructed a Cox risk analysis model and simultaneously obtained a genetic signature related to the TME. Univariate Cox regression analysis of the 66 consensus genes identified 20 significant DEGs (P < 0.01; ), while multivariate Cox regression analysis narrowed this down to just three key genes ().
Table
Table
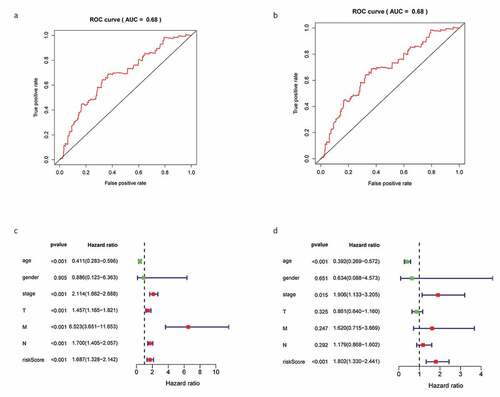
Risk score = (KLRB1 × −0.5685) + (SIT1 × 0.4474) + (GZMM × −0.3780)
K-M survival analysis and receiver operating characteristic (ROC) curves were used to describe the correlation between DEGs and the OS of patients with BC. K-M survival analysis revealed that high-risk patients displayed a significantly shorter survival time than low-risk patients (P = 0.008; ). The area under curve (AUC) of the 3-year ROC curve was 0.68 (). Cox regression analysis revealed that risk score, age, and clinical stage could be used as prognostic factors for BC () and that KLRB1 and SIT1 could be used as independent prognostic factors (P < 0.05).
Figure 6. Construction gene signatures related to the TME through COX analysis. (a) K-M survival analysis showed differential expression between low- and high-risk groups. (b) Analysis of ROC curves. (c) Univariate Cox regression analyses of the common prognostic factors of BC. (d) The Multivariatemultiple Cox regression model analyses of the common prognostic factors of breast cancer. TME: the tumor tumor microenvironment. K-M: Kaplan–Meier analysis. ROC: receiver operating characteristics
3.7. GSEA
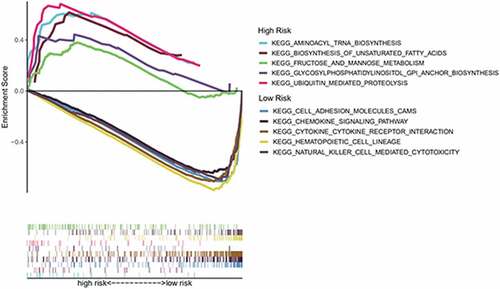
To further explore the difference in enrichment pathways between the high- and low-risk groups, we conducted GSEA. We found that pathways in the high-risk group were mainly related to metabolisms, such as aminoacyl tRNA biosynthesis, unsaturated fatty acid biosynthesis, fructose and mannose metabolism, glycosylphosphatidylinositol anchor biosynthesis, and ubiquitin-mediated proteolysis. Conversely, the low-risk group was associated with immune-related pathways, such as cell adhesion molecules, chemokine signaling pathways, hematopoietic cell line, natural killer cell-mediated cytotoxin, and cytokine–cytokine receptor interactions ().
Figure 7. Through GSEA, we explored the difference in enrichment pathways between high- and low-risk groups. GSEA: gene set enrichment analysis
3.8. Immune cell infiltration analysis
Next, we determined the relationship between the screened genes and immune cell infiltration using the TIMER database. We found that KLRB1, SIT1, and GZMM () were negatively correlated with tumor purity and positively correlated with the infiltration of B cells, CD4 T cells, CD8 T cells, neutrophils, macrophages, and dendritic cells.
Figure 8. The relationship between the genes and immune cell infiltration. (a) KLRB1. (b) SIT1. (c) GZMM. (d) Bar plot showed the proportion of 22 immune cells with each sample. (e)The heat map showed the level of immune cell infiltration of each sample between normal tissues and BC tissues. (f) Correlation matrix of all 22 immune cells proportions. high is red, low is blue, and the same association levels is white. (g) Violin plot showed the proportions of 22 immune cells between normal tissues with BC tissues
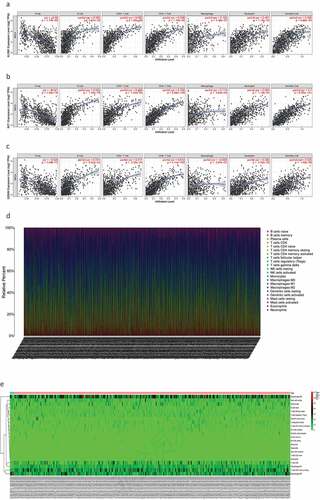
Figure 8. (Continued)
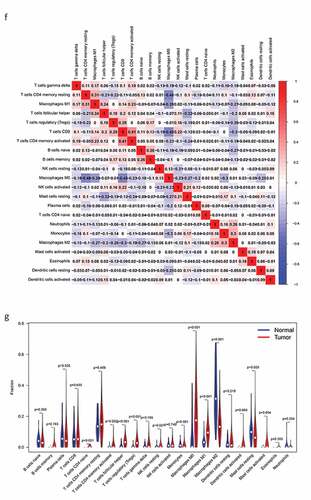
Therefore, we analyzed differences in immune infiltration between the low- and high-risk groups for 22 immune cells using Cibersort. First, we presented the proportion of each immune cell in all samples using a bar plot () and then used a heat map to compare the levels of immune cell infiltration between normal and BC tissues (). Low to moderate correlation was observed in various immunocyte subpopulations () and the violin plot () revealed that BC tissues displayed a higher proportion of activated CD4 memory T cells, follicular helper T cells, Tregs, resting natural killer (NK) cells, monocytes, M0, M1, and M2 macrophages, resting mast cells, and mast cells than normal tissues. Conversely, BC tissues displayed lower proportions of naïve and memory B cells, plasma cells, CD8T cells, resting CD4 memory T cells, gamma delta T cells, activated NK cells, resting and activated dendritic cells, eosinophils, and neutrophils. In addition, we compared immune cell infiltration in the high- and low-risk groups (Supplementary Figure 2).
3.9. HPA
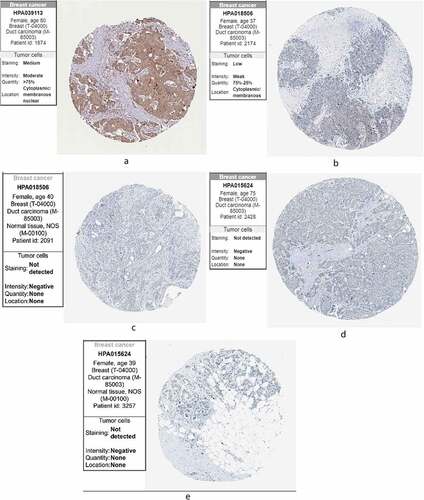
Finally, we compared the protein expression of the three core genes in control and BC tissues from the HPA, finding that KLRB1 () was moderately highly expressed in BC tissues. SIT1 () displayed low-medium expression, while it was negative in the adjacent tissues. GZMM () showed negative expression and was also negative in the adjacent tissues. This may be due to the small sample size of the HPA database.
Figure 9. The expression of the genes in breast cancer and normal tissues in HPA. (a) KLRB1. (b) SIT1. (c) GZMM. HPA: the Human Protein Atlas
4. Discussion
BC is the most common cancer among women and is the second most commonly diagnosed cancer worldwide [Citation17]. Increasing evidence has shown that the TME (including tumor-infiltrating immune cells) supports the growth and development of BC and affects tumor invasion, metastasis, and drug sensitivity [Citation18]. Although various components of the TME have been shown to promote cancer progression, such as immune cells, soluble factors, and extracellular matrix alterations, the relationship between TME-related genes and cancer prognosis remains unclear [Citation19]. TCGA database mining and analysis are commonly used to predict the prognosis of patients with cancer [Citation20]; therefore, we used the TCGA database to identify TME-related genes with a significant effect on BC prognosis, analyze the biological processes and signal transduction pathways of related DEGs, and evaluate the predictive ability of gene signatures.
First, we obtained stromal, immune, and ESTIMATE scores using the ESTIMATE algorithm and then investigated the relationship between these scores and the clinical information for 1,049 samples. A significant negative correlation was observed between clinical stage and immune score, while patients with BC that had higher immune scores had a longer OS than those with low scores and the stromal score did not significantly differ. These results indicate that immune cells may play a key role in the TME of BC. Consistently, previous studies have shown that infiltrating immune cells affect the biological and clinical processes underlying BC [Citation21]and that recurrence and disease-specific mortality rates increase as patient age increases [Citation22].
Next, we screened 226 DEGs by comparing the expression levels in the high- and low-scoring groups, with GO and KEGG pathway analyses revealing that these DEGs are related to the activation and differentiation of immune cells. In addition, KEGG pathway analysis indicated that these DEGs are mainly involved in immune regulatory pathways. These findings are consistent with previous studies which showed that activated T cells in the TME can promote tumor cell death [Citation23] and that chemokines and their receptors play a key role in determining the metastatic destination of tumor cells [Citation24].
We then constructed a PPI network from 66 DEGs that were closely related to prognosis and screened genes with the highest connectivity, identifying CD2, CD3E, CD1C, CCR5, CD5, CD27, CD40LG, IL7R, IKZF1, and ITK as the top 10 nodes ranked by degree. According to previous reports, CCR5 expression in human BC is associated with a poor prognosis [Citation25], while some of the other genes identified are involved in immune regulation. For instance, CD2 is known to mediate T and NK cell activation by interacting with CD58 [Citation26], while the CD1c+ DC subset is a major inducer of the CD4 T cell response [Citation27]. Moreover, CD5 is recognized as an important marker of malignant T cells that is expressed in almost all normal T cells [Citation28]. CD27 and its ligand CD70 are involved in the regulation of cellular immune responses to cancer and also enhance T cell proliferation and memory-cell formation [Citation29]. Furthermore, T lymphocytes have been found to lack CD40 ligand expression due to CD40LG gene inactivation [Citation30]. In BC, IL-7 promotes tumor growth by activating the JAK1/3-STAT5 and PI3K/AKT pathways [Citation29], while the IKZF1 gene plays important regulatory roles in lymphogenesis [Citation31]. Finally, ITK is a member of the TEC kinase family that is involved in regulating T cell receptor signaling and T cell differentiation [Citation32].
Consequently, we constructed a prognostic model and analyzed these 66 DEGs using Cox proportional hazard regression analysis to obtain three key genes. We found that risk score, age, and clinical stage can be used as prognostic factors for BC, while KLRB1 and SIT1 can be used as independent prognostic factors. Consistently, the expression of KLRB1 (encoding CD161) has been shown to reflect tumor-associated leukocytes [Citation33], while CD161 is generally regarded as a marker of NKT cells [Citation34]. In addition, previous studies have reported that the percentage of CD161(+) NKT cells in tumor and breast lymph nodes is significantly higher than in normal tissues [Citation35]. SIT is a transmembrane adapter protein that participates in receptor signal transduction in immune cells, exists in both T and B cell subpopulations [Citation36], and is an important regulator of TCR-mediated signaling, including T-cell homeostasis and tolerance [Citation37]. Therefore, these two key prognostic genes are closely related to immunity.
GSEA revealed key differences between the high- and low-risk groups; in particular, the low-risk group was mainly associated with immune-related pathways, while the high-risk group was mainly related to metabolism. Therefore, we investigated the potential molecular mechanisms related to immune and metabolic pathways in the BC microenvironment by studying the types and proportions of infiltrating immune cells in the BC microenvironment. TIMER analysis revealed that KLRB1, SIT1, and GZMM were negatively correlated with tumor purity and positively correlated with the infiltration of B cells, neutrophils, macrophages, CD4 T cells, CD8 T cells, and dendritic cells. Therefore, we compared the infiltration of 22 immune cell types in the high- and low-risk groups. CIBERSORT revealed that the immune cell subpopulations were low to moderate and that BC tissues contained higher proportions of activated CD4 memory T cells, follicular helper T cell, Tregs, resting NK cells, monocytes, M0, M1, and M2 macrophages, as well as resting and activated mast cells. Conversely, BC tissues displayed lower proportions of naïve and memory B cells, plasma cells, CD8T cells, resting memory CD4 T cells, gamma delta T cells, activated NK cells, resting and activated dendritic cells, eosinophils, and neutrophils. Tregs have been shown to support a hostile TME to promote BC progression [Citation38] and play an important role in inhibiting cancer progression to suppress cancer-promoting inflammatory processes [Citation39]. Tumor-associated macrophages (TAMs) can be divided into M1 inflammatory and M2 anti-inflammatory subgroups that express inflammatory or non-inflammatory chemokines, respectively. TAM infiltration in the TME contributes toward cancer progression and metastasis via several pathways, including stimulating angiogenesis, tumor growth, and cellular migration and invasion [Citation40]. Indeed, M2 macrophages (CD163-positive) are associated with progression to invasive BC [Citation41]. Finally, we verified the protein expression of the three core genes using the HPA database, finding that KLRB1 was moderately highly expressed in BC tissues, SIT1 was expressed at low-medium levels, and GZMM was negatively expressed. Together, these results further verify the findings of our analyses.
Unfortunately, this study also has several shortcomings. Firstly, we only selected certain types of BC (lobular and ductal tumors); therefore, our survival analysis was not comprehensive and complete. Secondly, this study lacked the necessary experiments to verify the identified genes. In conclusion, this study based on the big data analysis of TCGA database adds to the description of the gene characteristics of the TME in BC and identifies relevant influential pathways.
Highlights
KLRB1 and SIT1 genes can be used as independent prognostic factors of BC microenvironment.
The prognosis of BC microenvironment is related to the immune pathway.
Disclosure statement
No potential conflict of interest was reported by the authors.
Supplementary material
Supplemental data for this article can be accessed here.
Related Research Data
References
- Hutchinson L. Breast cancer: challenges, controversies, breakthroughs. Nat Rev Clin Oncol. 2010;7(12):669–670. Epub 2010/12/01. PubMed PMID: 21116236
- Provenzano E, Ulaner GA, Chin SF. Molecular classification of breast cancer. PET Clin. 2018;13(3):325–338. Epub 2018/08/14. PubMed PMID: 30100073
- Belli C, Trapani D, Viale G, et al. Targeting the microenvironment in solid tumors. Cancer Treat Rev. 2018;65:22–32. Epub 2018/03/05. PubMed PMID: 29502037
- Lee SS, Cheah YK. The interplay between MicroRNAs and cellular components of tumour microenvironment (TME) on non-small-cell lung cancer (NSCLC) progression. J Immunol Res. 2019;2019:3046379. Epub 2019/04/05. PubMed PMID: 30944831; PubMed Central PMCID: PMCPMC6421779
- Guo S, Deng CX. Effect of stromal cells in tumor microenvironment on metastasis initiation. Int J Biol Sci. 2018;14(14):2083–2093. Epub 2018/12/27. PubMed PMID: 30585271; PubMed Central PMCID: PMCPMC6299363
- Joyce JA, Pollard JW. Microenvironmental regulation of metastasis. Nat Rev Cancer. 2009;9(4):239–252. Epub 2009/03/13. PubMed PMID: 19279573; PubMed Central PMCID: PMCPMC3251309
- Chen F, Zhuang X, Lin L, et al. New horizons in tumor microenvironment biology: challenges and opportunities. BMC Med. 2015;13:45. Epub 2015/04/11. PubMed PMID: 25857315; PubMed Central PMCID: PMCPMC4350882
- Bahrami A, Hassanian SM, Khazaei M, et al. The therapeutic potential of targeting tumor microenvironment in breast cancer: rational strategies and recent progress. J Cell Biochem. 2018;119(1):111–122. Epub 2017/06/03. PubMed PMID: 28574616
- Quail DF, Joyce JA. Microenvironmental regulation of tumor progression and metastasis. Nat Med. 2013;19(11):1423–1437. Epub 2013/11/10. PubMed PMID: 24202395; PubMed Central PMCID: PMCPMC3954707
- Flister MJ, Bergom C. Genetic modifiers of the breast tumor microenvironment. Trends Cancer. 2018;4(6):429–444. Epub 2018/06/05. PubMed PMID: 29860987; PubMed Central PMCID: PMCPMC5990047
- Barriga V, Kuol N, Nurgali K, et al. The complex interaction between the tumor micro-environment and immune checkpoints in breast cancer. Cancers (Basel). 2019;11(8). DOI:10.3390/cancers11081205. Epub 2019/08/23. PubMed PMID: 31430935; PubMed Central PMCID: PMCPMC6721629
- Whiteside TL. The Local Tumor Microenvironment. In: Kaufman HL, Wolchok JD, editors. General principles of tumor immunotherapy: basic and clinical applications of tumor immunology. Dordrecht: Springer Netherlands; 2007. p. p. 145–67.
- Segovia-Mendoza M, Morales-Montor J. Immune tumor microenvironment in breast cancer and the participation of estrogen and its receptors in cancer physiopathology. Front Immunol. 2019;10:348. Epub 2019/03/19. PubMed PMID: 30881360; PubMed Central PMCID: PMCPMC6407672
- Ritchie ME, Phipson B, Wu D, et al. limma powers differential expression analyses for RNA-sequencing and microarray studies. Nucleic Acids Res. 2015;43(7):e47. Epub 2015/ 01/22. PubMed PMID: 25605792; PubMed Central PMCID: PMCPMC4402510
- Gu Z, Eils R, Schlesner M. Complex heatmaps reveal patterns and correlations in multidimensional genomic data. Bioinformatics. 2016;32(18):2847–2849. Epub 2016/ 05/22. PubMed PMID: 27207943
- Yu G, Wang LG, Han Y, et al. clusterProfiler: an R package for comparing biological themes among gene clusters. Omics. 2012;16(5):284–287. Epub 2012/ 03/30. PubMed PMID: 22455463; PubMed Central PMCID: PMCPMC3339379
- Kolak A, Kamińska M, Sygit K, et al. Primary and secondary prevention of breast cancer. Ann Agric Environ Med. 2017;24(4):549–553. Epub 2017/ 12/30. PubMed PMID: 29284222
- Steven A, Seliger B. The role of immune escape and immune cell infiltration in breast cancer. Breast Care (Basel). 2018;13(1):16–21. Epub 2018/ 06/29. PubMed PMID: 29950962; PubMed Central PMCID: PMCPMC6016054
- Zhang Z, Chen D, Li Z, et al. Bioinformatics analysis to screen the key prognostic genes in tumor microenvironment of bladder cancer. Biomed Res Int. 2020;2020:6034670. Epub 2020/ 03/10. PubMed PMID: 32149116; PubMed Central PMCID: PMCPMC7048919
- Deng Z, Wang J, Xu B, et al. Mining TCGA database for tumor microenvironment-related genes of prognostic value in hepatocellular carcinoma. Biomed Res Int. 2019;2019:2408348. Epub 2019/ 12/13. PubMed PMID: 31828095; PubMed Central PMCID: PMCPMC6885833 publication of this article
- Karn T, Pusztai L, Rody A, et al. The influence of host factors on the prognosis of breast cancer: stroma and immune cell components as cancer biomarkers. Curr Cancer Drug Targets. 2015;15(8):652–664. Epub 2015/ 10/11. PubMed PMID: 26452382
- van de Water W, Markopoulos C, van de Velde CJ, et al. Association between age at diagnosis and disease-specific mortality among postmenopausal women with hormone receptor-positive breast cancer. Jama. 2012;307(6):590–597. Epub 2012/ 02/10. PubMed PMID: 22318280
- Cimino-Mathews A, Foote JB, Emens LA. Immune targeting in breast cancer. Oncology (Williston Park). 2015;29(5):375–385. Epub 2015/ 05/17. PubMed PMID: 25979549
- !!! INVALID CITATION !!! (25).
- Jiao X, Velasco-Velázquez MA, Wang M, et al. CCR5 governs DNA damage repair and breast cancer stem cell expansion. Cancer Res. 2018;78(7):1657–1671. Epub 2018/ 01/24. PubMed PMID: 29358169; PubMed Central PMCID: PMCPMC6331183
- Crawford K, Stark A, Kitchens B, et al. CD2 engagement induces dendritic cell activation: implications for immune surveillance and T-cell activation. Blood. 2003;102(5):1745–1752. Epub 2003/ 04/26. PubMed PMID: 12714509
- Rahmatpanah F, Agrawal S, Scarfone VM, et al. Transcriptional profiling of age-associated gene expression changes in human circulatory CD1c+ myeloid dendritic cell subset. J Gerontol A Biol Sci Med Sci. 2019;74(1):9–15. Epub 2018/ 05/03. PubMed PMID: 29718193; PubMed Central PMCID: PMCPMC6298184
- Xu Y, Liu Q, Zhong M, et al. 2B4 costimulatory domain enhancing cytotoxic ability of anti-CD5 chimeric antigen receptor engineered natural killer cells against T cell malignancies. J Hematol Oncol. 2019;12(1):49. Epub 2019/ 05/18. PubMed PMID: 31097020; PubMed Central PMCID: PMCPMC6524286
- Vitiello GAF, Losi Guembarovski R, Amarante MK, et al. Interleukin 7 receptor alpha Thr244Ile genetic polymorphism is associated with susceptibility and prognostic markers in breast cancer subgroups. Cytokine. 2018;103:121–126. Epub 2017/ 10/02. PubMed PMID: 28964592
- Apoil PA, Kuhlein E, Robert A, et al. HIGM syndrome caused by insertion of an AluYb8 element in exon 1 of the CD40LG gene. Immunogenetics. 2007;59(1):17–23. Epub 2006/ 12/06. PubMed PMID: 17146684
- Stanulla M, Cavé H, Moorman AV. IKZF1 deletions in pediatric acute lymphoblastic leukemia: still a poor prognostic marker? Blood. 2020;135(4):252–260. Epub 2019/ 12/11. PubMed PMID: 31821407; PubMed Central PMCID: PMCPMC7019035 interests
- Mamand S, Allchin RL, Ahearne MJ, et al. Comparison of interleukin-2-inducible kinase (ITK) inhibitors and potential for combination therapies for T-cell lymphoma. Sci Rep. 2018;8(1):14216. Epub 2018/ 09/23. PubMed PMID: 30242208; PubMed Central PMCID: PMCPMC6154993
- Gentles AJ, Newman AM, Liu CL, et al. The prognostic landscape of genes and infiltrating immune cells across human cancers. Nat Med. 2015;21(8):938–945. Epub 2015/ 07/21. PubMed PMID: 26193342; PubMed Central PMCID: PMCPMC4852857
- Wajchman HJ, Pierce CW, Varma VA, et al. Ex vivo expansion of CD8+CD56+ and CD8+CD56- natural killer T cells specific for MUC1 mucin. Cancer Res. 2004;64(3):1171–1180. Epub 2004/ 02/12. PubMed PMID: 14871854
- Fahmi T, Esendagli G, Yilmaz G, et al. Immune compartmentalization of T cell subsets in chemically-induced breast cancer. Scand J Immunol. 2010;72(4):339–348. Epub 2010/ 10/05. PubMed PMID: 20883319
- Tedoldi S, Paterson JC, Hansmann ML, et al. Transmembrane adaptor molecules: a new category of lymphoid-cell markers. Blood. 2006;107(1):213–221. Epub 2005/ 09/15. PubMed PMID: 16160011
- Arndt B, Krieger T, Kalinski T, et al. The transmembrane adaptor protein SIT inhibits TCR-mediated signaling. PLoS One. 2011;6(9):e23761. Epub 2011/ 10/01PubMed PMID: 21957439; PubMed Central PMCID: PMCPMC3177817
- Baxevanis CN, Sofopoulos M, Fortis SP, et al. The role of immune infiltrates as prognostic biomarkers in patients with breast cancer. Cancer Immunol Immunother. 2019;68(10):1671–1680. Epub 2019/ 03/25. PubMed PMID: 30905043
- Whiteside TL. Induced regulatory T cells in inhibitory microenvironments created by cancer. Expert Opin Biol Ther. 2014;14(10):1411–1425. Epub 2014/ 06/18. PubMed PMID: 24934899; PubMed Central PMCID: PMCPMC4367126
- Santoni M, Massari F, Amantini C, et al. Emerging role of tumor-associated macrophages as therapeutic targets in patients with metastatic renal cell carcinoma. Cancer Immunol Immunother. 2013;62(12):1757–1768. Epub 2013/ 10/18. PubMed PMID: 24132754
- Hoskoppal D, Reisenbichler ES. Can tumor-associated macrophages in ductal carcinoma in situ on biopsy predict invasive carcinoma on excision? Hum Pathol. 2018;82:158–162. Epub 2018/ 08/02. PubMed PMID: 30067949