
 ?Mathematical formulae have been encoded as MathML and are displayed in this HTML version using MathJax in order to improve their display. Uncheck the box to turn MathJax off. This feature requires Javascript. Click on a formula to zoom.
ABSTRACT
N-linked glycosylation is a primary source of heterogeneity associated with recombinant monoclonal antibodies and plays a key role in a myriad of drug properties associated with biological function. The glycosylation profile of recombinant monoclonal antibodies is influenced by an array of cell culture inputs which must be carefully controlled in order to engineer the desired glycan distribution. A platform reduced intact mass method applied to monoclonal antibodies has been validated as a quantitative method to monitor the relative mannose-5 level as a surrogate for overall high mannose content in cell culture as a control strategy to ensure product quality and process consistency. The method was shown to be linear, accurate, specific, and precise for an IgG1 and IgG4 mAb allowing relative quantitation of mannose-5 in the range 0.8–11.0% and 1.0–6.2%, respectively. The method can be applied at several stages of the production process from cell culture harvest to drug substance/drug product and is amenable to routine GMP batch testing in a quality control laboratory. Testing upstream during cell culture rather than for product release allows for an earlier assessment of product quality as the glycosylation profile remains unchanged during downstream purification.
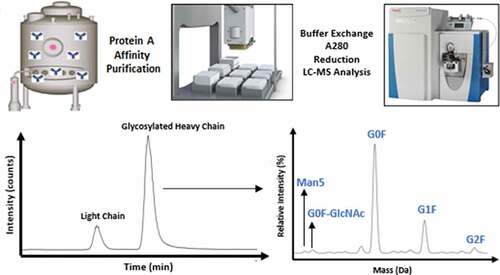
Graphical abstract
Introduction
N-linked glycosylation is a critical post translational modification during the production of recombinant monoclonal antibodies due to its wide-ranging impact on biological function, structure, and stability[Citation1]. In addition to other common post translational modifications such as oxidation, deamidation, and C- and N-terminal modifications, glycosylation of asparagine in the Fc region is also a key source of the heterogeneity associated with this class of biotherapeutic. The N-glycosylation profile is vital to the safety and efficacy of biopharmaceutical drugs such as monoclonal antibodies since this modification has been shown to influence immunogenicity, pharmacokinetic properties, and effector function and, as such, has been deemed a critical quality attribute[Citation2].
Advanced analytical technologies employing liquid chromatography-electrospray ionization mass spectrometry-based workflows such as LC-ESI-MS or tandem MS are routinely utilized during process characterization to evaluate product quality attributes. Higher level N-linked glycosylation profiling is typically achieved through intact or reduced mass analysis of the monoclonal antibody [Citation3,Citation4]. Digestion with IdeS, a highly specific cysteine protease which cleaves below the hinge region of IgG, has also been employed for the determination of mAb glycosylation often in conjunction with reduction [Citation5]. In addition, capillary electrophoresis coupled to mass spectrometry (CE-ESI-MS) is an emerging technology for the characterization of mAb glycosylation [Citation6,Citation7]. These approaches are attractive for process development and optimization due to minimal sample preparation and analysis time resulting in high throughput analysis. However, in-depth glycosylation characterization and GMP release is typically achieved through more complex workflows involving peptide mapping of proteolytic digests of the monoclonal antibody or hydrophilic interaction chromatography (HILIC) of enzymatically released N-glycans which have been labeled (e.g., RapiFluorTM) to increase the sensitivity of fluorescence and mass spectrometry detection [Citation8,Citation9].
While the use of advanced analytical technologies is typically reserved for characterization in analytical research and development laboratories, there is an increasing interest to integrate these technologies into the cGMP QC environment: most notably multi-attribute methods (MAM) to replace traditional LC-based assays for routine batch monitoring [Citation8,Citation9] and more recently, a co-validated subunit LC-MS method to monitor antibody oxidation for commercial product release and stability testing[Citation10]. Incorporation of mass spectrometry-based methods for cGMP testing has been slow due to numerous obstacles including limited analyst exposure to LC-MS, complexity in instrument and software validation, and restricted availability of GMP compliant software that fulfill data integrity requirements of the Food and Drug Administration’s (FDA) regulations on electronic records and electronic signatures (21 CFR Part 11)[Citation11].
The Exactive Plus Orbitrap mass spectrometer is often the instrument of choice for routine multi-attribute monitoring of product quality attributes at the peptide level due to its high-resolution and GMP-compliant software (Chromeleon) offering the new peak detection feature, although other systems are available offering compliance such as Waters UNIFI-driven instruments. Chromeleon software enables the import of optimized deconvolution methods from Biopharma Finder which allows for the implementation of common LC-MS characterization approaches for monoclonal antibodies (intact, reduced, IdeS generated subunits, etc.) to the QC space for routine process consistency and product quality monitoring. The software offers audit trails, system/user administration, and electronic signatures to address data integrity concerns.
Here we report the validation of a quantitative reduced intact mass platform method to monitor mannose-5, the dominant form of high mannose typically present in the glycosylation profile at the end of cell culture. High-mannose glycans have been implicated in shortened in vivo half-life of recombinant monoclonal antibodies[Citation12]. In addition, trace impurities in the source material used to supplement media have also been shown to modify the N-linked glycosylation profile of recombinant monoclonal antibodies [Citation13,Citation14]. The lack of significant change in the N-glycosylation profile of monoclonal antibodies from downstream purification processes allows a control strategy to be implemented much earlier in the production process.
The reduced intact mass method was validated following ICH guidelines Q2(R1) [https://www.ich.org/page/quality-guidelines] as a quantitative test for impurities to include accuracy, precision (repeatability and intermediate), specificity, quantitation limit, linearity, and range. The primary LC-MS system used in this work has been validated through both vendor IQ/OQ/PQ as well as internal procedures and is linked to an integrated data back-up/recovery system. Instrument and processing methods as well as report templates are locked to prevent modification and banked to allow direct import to created sequences. The goal of the validation of the method is to generate an assay which can be used to monitor early product quality to ensure the production of cGMP batches which meet the expected glycosylation profile. The product glycosylation profile is achieved via relative quantitation of the mannose-5 glycoform in harvest samples.
Materials and methods
Reagents
Sodium phosphate dibasic heptahydrate (Cat. S373-500), sodium phosphate monobasic monohydrate (Cat. S369-500), sodium chloride (Cat. S271-500), Bis-Tris (Cat. BP301-100), sodium acetate trihydrate (Cat. S209-500), Tris base (Cat. BP152-500), Tris hydrochloride (Cat. BP153-500), 6 N hydrochloric acid (Cat. SA56-500), glacial acetic acid (Cat. A38-500), water (Cat. W6-4), acetonitrile (Cat. A955-1), and trifluoroacetic acid (Cat. 28904) were obtained from Fisher Scientific. DL-dithiothreitol (Cat. D0632-10 G) was acquired from Millipore Sigma and 1 M Tris-HCl, pH 7.5 (Cat. 351–006-721) was purchased from Quality Biological.
Samples
Representative cell culture harvest and purified samples characterized by low and elevated levels of high-mannose species were used for validation.
Reduced intact mass linearity and precision assessment
Drug substance samples containing low and elevated relative mannose-5 levels were co-mixed for each IgG in order to assess the linearity of the reduced intact mass method. The expected percentage of mannose-5 for each linearity level was determined by the following equation:
where CL and CH are the protein concentrations of the low and high level samples, ML and MH are the %Man5 values of the low and high level samples determined by the reduced intact mass method, and VL and VH are the volumes of low and high level samples used in the co-mix. The co-mixing of IgG1 drug substance samples was performed in order to generate eight levels within the expected range 0.9% to 10.6%. IgG4 drug substance samples were combined to yield five levels within the expected range 1.0% to 6.2%. For both monoclonal antibodies, each level was prepared once and injected in triplicate on a single LC-MS system on a single day.
In order to assess repeatability and intermediate precision, a low, moderate, and high-level mannose-5 sample was prepared as described above for both mAbs. Each level was prepared once and injected in triplicate on a single LC-MS system each day over the course of three days by two analysts using two columns.
Affinity purification of IgG1 and IgG4 monoclonal antibody from cell culture
Purified monoclonal antibody was obtained through use of the Agilent AssayMAP Bravo automated liquid handling platform. Briefly, approximately 100 µg of protein was loaded onto a 5 µL bed of Protein A resin (Agilent, Cat. G5496-60000) pre-equilibrated with 75 mM phosphate, 100 mM sodium chloride, pH 7.4. The resin was washed sequentially with 50 mM Bis-Tris, 1 M sodium chloride, pH 7.4, and 25 mM Bis-Tris, pH 5.9. Finally, the monoclonal antibody was eluted in a 20 µL volume with 75 mM acetate, pH 3.3, immediately neutralized with 2.4 M Tris, pH 8.0, and buffer exchanged into 100 mM Tris-HCl, pH 7.5, using a 7 kDa MWCO Zeba spin desalting column (Thermo Fisher Scientific, Cat. 89882).
Partial reduction of disulfide bonds
For samples generated through co-mixing low and high mannose-5 drug substance, 50 µg of protein was adjusted to 1 µg/µL with 100 mM Tris-HCl, pH 7.5, and incubated in 50 mM DTT at 25°C for 60 minutes in order to reduce interchain disulfide bonds. Reduced samples were placed in the instrument autosampler maintained at 5°C and analyzed immediately.
For samples purified through Protein A binding, protein recovery was determined following buffer exchange via A280 protein concentration measurement using a Thermo Fisher Scientific NanoDrop 2000 spectrophotometer followed by reduction as described above.
LC-UV-MS reduced intact mass analysis
Approximately 3–5 µg of sample were loaded onto a TSKgel phenyl-5PW RP column (2.0 mm x 75 mm, 10 µm particle size, 1000 Å pore size, Tosoh Biosciences, Cat. 18756) equilibrated with 90% mobile phase A (mobile phase A: 0.030% (v/v) TFA in water; mobile phase B: 0.024% (v/v) TFA in acetonitrile) held at approximately 55°C. Separation of the light and heavy chains of the monoclonal antibody was performed using a Thermo Fisher Scientific Vanquish ultra-high performance liquid chromatograph with a gradient comprising an initial step increase from 10% to 28% mobile phase B followed by a linear ramp from 28% to 36% mobile phase B over 4 min at a flow rate of 0.30 mL/min. Separated light and heavy chain peaks were detected at 215 nm using a variable wavelength detector to aid in monitoring system performance.
MS acquisition was performed in the positive ion mode on a Thermo Fisher Scientific Exactive Plus mass spectrometer configured with an Ion Max atmospheric pressure ionization (API) source and a heated electrospray ionization (HESI) probe. Mass spectra were acquired using a resolution setting of 17,500 (FWHM at m/z 200), in-source CID of 45 eV, 10 microscans, AGC target of 1 × 10⁶ ions, a maximum injection time of 50 ms, and a scan range of m/z 800–3500. Source conditions for the analysis included a sheath gas flow of 40, auxiliary gas flow of 10, spray voltage of 4.0 kV, capillary temperature of 350°C, and an auxiliary gas heater temperature of 50°C. The S-Lens RF level was maintained at 50%. The mass spectrometer was calibrated in the positive ion mode prior to each analysis. Data were acquired and processed using Chromleon v7.2.9 (Thermo Fisher Scientific). Deconvolution parameters were optimized in Biopharma Finder 3.1 (Thermo Fisher Scientific) prior to import as a processing method for heavy chain deconvolution.
RapiFluorTM HILIC UPLC-FLR-MS analysis
The RapiFluor N-Glycan Kit (Cat. 176003712) which includes the Rapid PNGase F enzyme and RapiFluorTM dye was acquired from Waters and used in N-glycan HILIC analysis. The manufacturer’s instructions were followed in their application. Briefly, N-glycans were released from the mAb using Rapid PNGase F enzyme followed by labeling with RapiFluorTM dye. The labeled glycans were subsequently purified via solid phase extraction (SPE) to remove excess dye prior to HILIC UPLC-FLR-MS analysis. Glycans were identified by mass spectrometry detection while the relative glycan distribution was determined using the chromatographic profile generated via fluorescence detection (λex 265 nm and λem 425 nm).
Results
Linearity evaluation of reduced intact mass analysis
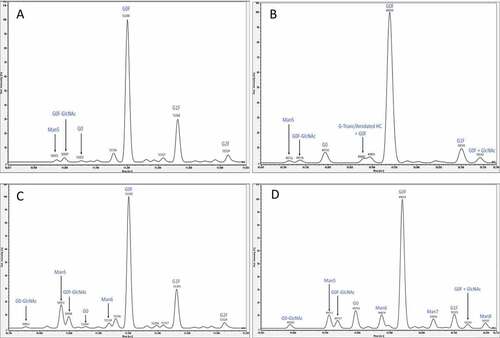
The reduced intact mass method was validated following ICH guidelines Q2(R1) as a quantitative test for impurities since the purpose of the assay is an in-process test to monitor relative mannose-5 level. The reduced intact mass method applied to cell culture harvest incorporates several sample processing and analysis steps as shown in the workflow outlined in . summarizes the validation parameters and acceptance criteria used in the method validation. Drug substance containing low and high relative mannose-5 levels were co-mixed, reduced, and analyzed by LC-MS in order to assess linearity, range, accuracy, and limit of quantitation (LOQ) for the determination of mannose-5. Measured %Man5 values were calculated as a relative percentage of the mannose-5 signal intensity in the deconvoluted heavy chain mass spectrum to the sum of signal intensity of the observed glycoforms. shows representative deconvoluted mass spectra for the low and high level Man5 drug substance for both the IgG1 and IgG4 monoclonal antibodies. Assignment of peaks in the deconvoluted mass spectra were based on a mass accuracy requirement of no more than 100 ppm to account for species in lower abundance.
Table 1. Summary of validation parameters and acceptance criteria for reduced intact mass analysis
Figure 1. Workflow for reduced intact mass analysis from cell culture
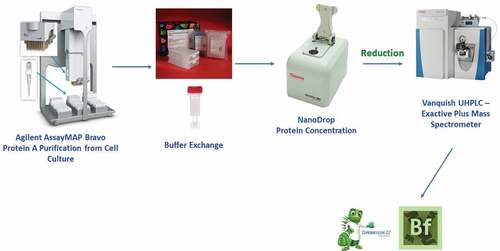
Figure 2. Deconvoluted mass spectra representing the heavy chain of A) IgG1 characterized by low mannose-5, B) IgG4 characterized by low mannose-5, C) IgG1 characterized by high mannose-5, and D) IgG4 characterized by high mannose-5
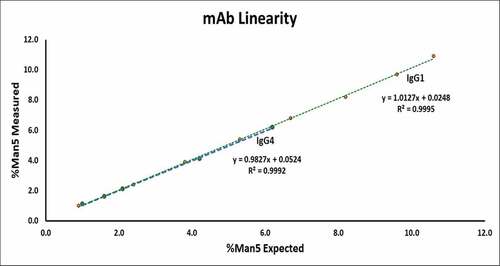
Linearity of the method to determine the relative abundance of mannose-5 across the range evaluated is demonstrated in for both monoclonal antibodies. The average measured %Man5 for each level (n = 3) was plotted against the expected Man5 value to generate the respective plots. The correlation coefficient (R2 > 0.99) and slope (approaching 1.00) confirm the linear response of the method across the range assessed for each mAb. summarizes the results used to gauge the range, precision across the range, and limit of quantitation of the method. For the IgG1 monoclonal antibody, the range of the method for the relative abundance of mannose-5 was established to be 0.8% to 11.0% as these values represent the lowest and highest %Man5 measurement in the triplicate injections of the lower and upper boundary of the linear curve coupled to the precision demonstrated at all levels across the range (≤2% RSD for Man5 levels approximately 2.5% or greater). As expected, a higher but acceptable %RSD value (14.1%) was obtained for the lowest level evaluated. The limit of quantitation was, therefore, established as 0.8% mannose-5 for the IgG1 monoclonal antibody. A similar limit of quantitation (0.9%) was established for the IgG1 on a second LC-MS instrument during method qualification. For the IgG4 mAb, the range of the method for %Man5 was determined to be 1.0% to 6.2%. Precision was demonstrated for each level of the range (<10% RSD for levels 1–5) which allowed for a limit of quantitation to be established as 1.0%. Similar to the IgG1 mAb, a comparable limit of quantitation (0.8%) was established for the IgG4 on a second LC-MS system during method qualification.
Table 2. Assessment of Man5 linearity and accuracy for reduced intact mass analysis of IgG1 and IgG4
Figure 3. Linearity plots for IgG1 and IgG4 monoclonal antibodies demonstrating the linear response of the reduced intact mass analysis for relative abundance of mannose-5
Measurement accuracy was also evaluated for each replicate at each level used to establish the range of the method and summarized in . Accuracy was determined as the percentage of measured to expected level of %Man5. For both monoclonal antibodies, accuracy of the method was demonstrated at all levels across the range (96% to 105% for all levels excluding the lowest). Similar to %RSD results, accuracy values for the lowest level lie closer to the upper and lower limits of the defined acceptance criteria (i.e., 93% to 122%) but still acceptable since the low end of the range is sensitive to small variations between individual measurements.
Repeatability and intermediate precision assessment of reduced intact mass analysis
Intermediate precision of the method was evaluated using a matrix design of experiments in which low, moderate, and high level samples were prepared by co-mixing drug substance for each monoclonal antibody with analysis on a single instrument by triplicate injections each day (for repeatability) from two analysts over three days using two columns. The three levels chosen correspond to the three Man5 levels used to construct linearity plots as discussed previously (2.4%, 5.3%, and 9.6% for IgG1; 1.6%, 4.2%, and 6.2% for IgG4) and, therefore, were prepared in an identical manner. lists the results of the repeatability assessment which demonstrates the intra-assay precision of the method for the determination of the relative abundance of mannose-5 in mAbs as %RSD values were less than 12% for any level on any specific day. As discussed previously for precision across the linear range, the highest %RSD was observed in the low mannose-5 level analysis but still considered acceptable to exhibit a good method repeatability.
Table 3. Repeatability and intermediate precision summary for reduced intact mass analysis for IgG1 and IgG4
Intermediate precision was assessed through analysis of the entire repeatability data set for each level (n = 18). %RSD values were less than 8% for all levels which verifies the inter-assay precision of the method to measure relative abundance of mannose-5. Comparable repeatability and intermediate precision results were obtained for method qualification of the IgG1 and IgG4 mAbs using three LC-MS instruments when analyzing drug substance and affinity purified mAb from cell culture (data not shown).
Specificity
Specificity of the method to detect each glycoform used to quantitate the relative abundance of mannose-5 is inherent in the use of mass spectrometry-based detection. In addition, the method incorporates several purification steps including affinity purification and buffer exchange prior to LC-MS analysis which eliminates any potential matrix effects. Specificity was demonstrated for the IgG1 mAb through detection of Man5, G0F, G0F-GlcNAc, G1F, and G2F (common glycan structures and nomenclature can be found in ReferenceCitation15) from a cell culture sample since these glycoforms are consistently detected in the product. A similar analysis to show specificity was performed during method co-qualification of the IgG4 mAb. Furthermore, no peaks were present in the method blank for either monoclonal antibody which could interfere in the relative quantitation of mannose-5.
Robustness
Method robustness was evaluated through small variations in sample preparation conditions, liquid chromatography parameters, and mass spectrometry settings either prior to validation in the case of the IgG1 or as part of method validation for the IgG4 using drug substance as summarized in . Since the assay is intended to be a platform method, the sample preparation discrepancies between the two monoclonal antibodies (DTT concentration, reduction duration, and reduction temperature) were aligned to reflect the conditions of the IgG4 mAb prior to validation of the method for the IgG1. This alignment was necessary since the IgG1 and IgG4 reduction conditions differed during method development for the three parameters mentioned above. The validity of these changes was confirmed through pre-validation experiments to ensure comparable mannose-5 values between the two sets of reduction conditions for the IgG1.
Table 4. Summary of method robustness for IgG1 and IgG4
For sample preparation variations all changes for both monoclonal antibodies gave similar chromatography to the sample processed under nominal conditions. The determined relative abundance values for mannose-5 were also consistent across all variations when compared to sample analyzed using nominal preparation conditions. Although, expectedly, all liquid chromatography changes resulted in slight differences in the chromatographic profile such as peak shape and retention, the resolution was not significantly altered between the light chain and heavy chain peaks and consistent %Man5 values were obtained to the nominal condition for both the IgG1 and IgG4. Changes in mass spectrometry settings also resulted in relative mannose-5 values comparable to nominal conditions for both mAbs. The averaged electrospray mass spectra were also consistent in charge state distribution/pattern and signal intensity to nominal conditions. For IgG1, the %Man5 for the sample preparation, liquid chromatography parameters, and mass spectrometry settings changes was within expected method variability with RSD values of 4.2%, 2.8%, and 2.4%, respectively, and comparable to the %Man5 value obtained using nominal conditions. For IgG4 which serves as the method assay control, the %Man5 measurements all fell within the assay control limits established using nominal method conditions (±3 standard deviations with truncation at the method LOQ).
Affinity purification parameters for the AssayMAP Bravo were not assessed since these conditions were optimized during method development. To ensure efficient purification, a minimum protein recovery was included in the method as a requirement to proceed with sample processing. Also, a comparative analysis of drug substance and cell culture samples was performed for each monoclonal antibody to confirm relative mannose-5 values were comparable. In addition to method robustness described above, autosampler stability of the reduced drug substance at 5°C was assessed to probe extended sample integrity. Relative mannose-5 levels remained consistent for both monoclonal antibodies when analyzed across time points carried out to approximately three days. No significant changes were detected in the chromatographic profiles or deconvoluted mass spectra of the Day 0 and Day 3 injections.
To gauge measurement variability due to sample preparation and instrument performance, the IgG4 cell culture harvest was affinity purified using the AssayMAP Bravo automated liquid handling system, buffer exchanged, reduced, and the relative abundance of mannose-5 determined by reduced intact mass. Sample processing and LC-MS analysis were performed separately by two analysts on two LC-MS systems using two columns at two different laboratories at different locations or sites. depicts results of an ANOVA statistical analysis of relative mannose-5 levels between the two sites using JMP software (SAS Institute). A statistically significant difference between the means of the two sites was observed through a p-value < 0.0001 (Prob > F). Individual preparations between the two sites resulted in an RSD of 8.9% for Site 1 and 2.5% for Site 2 with an overall RSD of 17.4%.
Figure 4. ANOVA analysis of IgG4 cell culture harvest and drug substance mannose-5 levels across multiple sites to assess repeatability and intermediate precision of reduced intact mass analysis
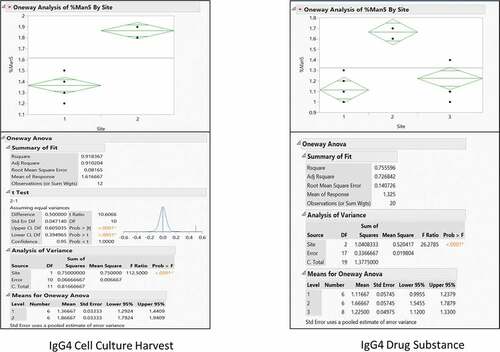
Preparations of IgG4 drug substance were also processed with the addition of a third site to include only the reduction step prior to LC-MS analysis. depicts results of an ANOVA statistical analysis of relative mannose-5 levels between the three sites using JMP software. A statistically significant difference between the means of the three sites was also observed through a p-value < 0.0001 (Prob > F). Individual preparations between the three sites resulted in an RSD of 11.4% for Site 1, 2.6% for Site 2, and 15.2% for Site 3 with an overall RSD of 20.7%. These data, along with the previously described intermediate precision data () showing strong %Man5 agreement between analysts using a single instrument, suggest the predominant source of method variability most likely lies within differences in LC-MS instrument performance.
Comparison of reduced intact mass to relative quantitation of released, labeled glycans via HILIC
In order to appraise the performance of the reduced intact mass method using an orthogonal method, %Man5 results for samples tested by the reduced intact mass method were compared to relative quantitation of released, labeled N-glycans using the RapiFluorTM HILIC method. The HILIC approach involves a chromatographic separation of the various released glycans, thus, permitting identification of lower abundance glycoforms due to glycan labeling which allows for increased sensitivity by fluorescence versus mass spectrometry detection. The largest difference between measurements for both the IgG1 and IgG4 monoclonal antibodies was less than 1.0%. Considering the marked differences between the two techniques including analyzed sample (glycosylated heavy chain vs. released glycans), detection (mass spectrometry vs. fluorescence), and data processing (deconvolution vs. chromatographic peak integration) there is agreement between the orthogonal methods.
Discussion
Qualification, optimization, and robustness of the method ensured a successful validation of the method. Acceptance criteria for each validation parameter were chosen based on qualification and pre-validation data acquired by multiple analysts using multiple Exactive Plus LC-MS systems. For repeatability and precision across the linear range, the acceptance criteria were broadened below a lower %Man5 threshold to account for the sensitivity of small differences in replicate measurements on the precision assessment in this segment of the range (%RSD ≤ 20% for Man5 levels ≤ 3%; %RSD ≤ 10% for Man5 levels > 3%). The highest %RSD value (15.2%) for %Man5 measurements for repeatability in the lower range (Man5 ≤ 3%) was generated during method co-qualification across laboratories supporting the validation acceptance criterion for the lower boundary of the range. To account for added analyst variability during the intermediate precision portion of the method validation, the criterion for each segment was increased by 5%. Likewise, the highest %RSD value (20.7%) for %Man5 measurements in the lower range (Man5 ≤ 3%) for qualification intermediate precision data was also obtained for IgG4 drug substance analysis by three laboratories again supporting the validation acceptance criterion of 25% for the lower segment of the range.
In order to establish the method range, in addition to precision, acceptance criteria included an accuracy between 70% and 130% to account for the sensitivity to small variations between individual measurements at the lower boundary of the range as discussed previously and also to reflect differences in performance across multiple LC-MS systems. The coefficient of determination acceptance criteria was set to R2 ≥ 0.95 for both monoclonal antibodies. In all, the method validation demonstrated the reduced intact mass approach to determine the relative abundance of mannose-5 in monoclonal antibodies to be robust, specific, linear, precise, and accurate. The range of the method could be presumably extended for both monoclonal antibodies with higher induced Man5 levels.
Equipment qualification presented unique challenges given the complexity of LC-MS instrumentation and need for fully GMP compliant related software. In addition to vendor IQ/OQ/PQ for the system, performance qualification specific to the instrument’s intended use for reduced intact mass analysis was performed. Supplemental qualification was performed to assess regulatory and user requirements such as verification of user roles and permissions, verification of software security policies and functionality including, but not limited to, user access, controls to prevent editing or deletion of data/records as well as a non-modifiable audit trail. Supporting documentation such as protocols, reports, and an instrument SOP were generated and managed in validated computer software.
The reduced intact mass analysis of monoclonal antibodies is restricted to detection of the more abundant glycoforms compared to glycopeptide analysis by peptide mapping or released, labeled N-glycan analysis by HILIC [Citation16]. Despite these differences, the attractiveness of the reduced intact mass method lies in its minimal manual sample manipulation and shortened analysis time to gain an in-process readout of high-mannose species in monoclonal antibodies through the monitoring of the Man5 glycoform. The relative simplicity of the method resulting in faster turnaround makes implementation in a quality control laboratory less complex compared to more complicated, time-consuming workflows which require a more in-depth understanding of sample processing, data analysis, and LC-MS instrumentation. This distinction is important for an in-process test used to ensure process consistency and product quality, particularly if product manufacturing occurs at multiple sites. Sample preparation including affinity purification, buffer exchange, protein concentration measurement, and reduction can typically be performed in 3 to 4 h while each LC-MS analysis is 15 minutes in length. To address introduction of LC-MS to the QC laboratory, training occurred during method optimization by design to allow a more extensive training period to ensure the method procedure was presented in a format which aligns with QC standard operating procedures. The intensive training period also allows the initial trainee(s) to transition into a trainer role so that future analysts can be trained completely within the QC department responsible for routine testing. In all, the reduced intact mass assay is a robust and relatively fast method suitable for routine in-process, targeted mannose-5 testing in the QC laboratory to ensure batch consistency and product quality.
Conclusion
A reduced intact mass method has been validated as an in-process test to determine the relative abundance of mannose-5 in monoclonal antibodies. The method has been demonstrated to be robust, linear, accurate, precise, and specific for two IgGs and offers high throughput and speed. Implementation of the method for routine in-process testing will allow for the monitoring of process consistency and product quality during the manufacture of recombinant monoclonal antibody biotherapeutics.
Research highlights
A reduced intact mass method was validated for cGMP testing of harvest samples.
Relative quantitation of mannose-5 in IgG1 and IgG4 mAbs can be determined.
The method targets early product quality assessment of the glycosylation profile.
The method results agree well with traditional HILIC analysis.
Additional information
Acknowledgements
We thank LaTrice West for providing intermediate precision data during method validation as well as participating in data review and Dr. Seth Madren for providing precision data during method qualification. We also thank Dr. Linda Yi for helpful discussions.
Disclosure statement
The authors declare no conflict of interests.
References
- Ambrogelly A, Gozo S, Katiyar A, et al. Analytical comparability study of recombinant monoclonal antibody therapeutics. mAbs. 2018;10(4):513–538.
- Zhang P, Woen S, Wang T, et al. Challenges of glycosylation analysis and control: an integrated approach to producing optimal and consistent therapeutic drugs. Drug Discov Today. 2016;21(5):740–765.
- Gomes RA, Almeida C, Correia C, et al. Exploring the analytical power of the QTOF MS platform to assess monoclonal antibodies quality attributes. Plos One. 2019;14(7):e0219156.
- Liu P, Zhu X, Wu W, et al. Subunit mass analysis for monitoring multiple attributes of monoclonal antibodies. Rapid Commun Mass Spectrom. 2019;33(1):31–40.
- Carillo S, Perez-Robles R, Jakes C, et al. Comparing different domains of analysis for the characterization of N-glycans on monoclonal antibodies. J Pharm Anal. 2020;10(1):23–34.
- Redman EA, Batz NG, Mellors JS, et al. Integrated microfluidic capillary electrophoresis-electrospray ionization devices with online MS detection for the separation and characterization of intact monoclonal antibody variants. Anal Chem. 2015;87(4):2264–2272.
- Wang Y, Feng P, Sosic Z, et al. Monitoring glycosylation profile and protein titer in cell culture samples using ZipChip CE-MS. J Anal Bioanal Tech. 2017;8(2). DOI:10.4172/2155-9872.1000359
- Rogers RS, Nightlinger NS, Livingston B, et al. Development of a quantitative mass spectrometry multi-attribute method for characterization, quality control testing and disposition of biologics. mAbs. 2015;7(5):881–890.
- Rogstad S, Yan H, Wang X, et al. Multi-attribute method for quality control of therapeutic proteins. Anal Chem. 2019;91(22):14170–14177.
- Sokolowska I, Mo J, Pirkolachahi FR, et al. Implementation of a high-resolution liquid chromatography−mass spectrometry method in quality control laboratories for release and stability testing of a commercial antibody product. Anal Chem. 2020;92(3):2369–2373.
- Guidance for Industry. Part 11, electronic records; electronic signatures – scope and application. US Food and Drug Administration.
- Goetze AM, Liu YD, Zhang Z, et al. High-mannose glycans on the Fc region of therapeutic IgG antibodies increase serum clearance in humans. Glycobiology. 2011;21(7):949–959.
- DePalma A. Glycosylation: the key to quality. Genet Eng Biotech N. 2015 March 15;35(6).
- Brantley TJ, Mitchelson FG, Khattak SF. A class of low-cost alternatives to kifunensine for increasing high mannose N-linked glycosylation for monoclonal antibody production in Chinese hamster ovary cells. Biotechnol Prog. 2020;XX–XX. DOI:10.1002/btpr.3076
- Reusch D, Tejada ML. Fc glycans of therapeutic antibodies as critical quality attributes. Glycobiology. 2015;25(12):1325–1334.
- Planinc A, Bones J, Dejaegher B, et al. Glycan characterization of biopharmaceuticals: updates and perspectives. Anal Chim Acta. 2016;921:13–27.