
ABSTRACT
Ulcerative colitis (UC) is a type of refractory and recurrent inflammatory disorder that occurs in colon and rectum. Immune cell infiltration plays a critical role in UC progression; therefore, this study aims to explore potential biomarkers for UC and to analyze characteristics of immune cell infiltration based on the bioinformatic analysis. In this study, 248 differentially expressed genes (DEGs) were screened, and the top 20 immune-related hub genes and pathways were assessed. Moreover, four candidate diagnostic biomarkers (DPP10, S100P, AMPD1, and ASS1) were identified and validated. Immune cell infiltration analysis identified 13 differentially infiltrated immune cells (IICs) in UC samples compared to normal samples, and the result showed that two IICs only expressed in UC samples. In addition, the present research found that DPP10 was negatively correlated with neutrophils, S100P exhibited a positive correlation with resting CD4 memory T cells, AMPD1 was positively correlated with M2 macrophages, and ASS1 was inversely associated with neutrophils and positively related to CD8 T cells. Taken together, these findings indicated that DPP10, S100P, AMPD1, and ASS1 may act as diagnostic biomarkers for UC, and that differential IICs may help to illustrate the progression of UC.
Graphical Abstract
1. Introduction
Ulcerative colitis (UC) is a chronic, refractory, and recrudescent inflammatory colon and rectum disease that is mostly diagnosed in young individuals [Citation1,Citation2]. It is accompanied by symptoms such as abdominal pain, bloody mucopurulent stool, and diarrhea [Citation3]. UC causes a tremendous medical and socioeconomic burden on society as it reduces the quality of life and leads to a shortage in healthcare resources. Moreover, the influence of UC is often underestimated [Citation4,Citation5]. In recent years, UC incidence continues to increase and remains as an escalating global health problem [Citation6].
Currently, the diagnosis and treatment of UC are still limited by existing technologies. Although orally administered drugs are currently the most common therapeutic strategy [Citation7,Citation8], it is worth noting that long-term medication could have unexpected side effects on UC. In addition, UC diagnosis currently mainly relies on gastrointestinal endoscopy and mucosal histopathological biopsy, which can cause uncertainty in diagnosing patients with atypical endoscopic signs or pathological features, thus delaying effective treatment [Citation9]. The diagnosis of UC patients at early stage may be delayed due to vague and nonspecific clinical symptoms. Some biomarkers contribute to diagnosis, evaluation of disease severity, and treatment adjustment for UC patients, thus complementing the use of clinical parameters [Citation10]. Therefore, the exploration of diagnostic biomarkers and therapeutic targets is urgently needed for improving UC outcomes and is highly desirable for clinical physicians.
Expression profiling of genes from chip or transcriptome sequencing has been regarded as a potential source of biomarkers for diagnosis or prognosis of neoplastic and non-neoplastic diseases [Citation11,Citation12]. Recently, emerging evidence has indicated that the prognostic and diagnostic models based on genes offer the possibilities for the treatment of tumor patients and inflammatory patients. For example, Tang et al. demonstrated that ferroptosis-related genes can robustly predict prognosis for hepatocellular carcinoma [Citation13]. Moreover, Liu et al. identified five genes as the potential prognostic biomarkers for asthma [Citation14]. However, the role of genes in UC remains unknown.
An improved understanding of the mechanisms behind UC is necessary for identifying novel diagnostic and therapeutic targets; unfortunately, at present, the underlying etiology and pathogenesis of UC remain unclear. However, more and more studies have illustrated that that environmental factors such as infections or dysbiosis, which act on genetically susceptible individuals to induce the breakdown of natural immune tolerance, cause the immune dysfunction of the intestinal mucosa and trigger the onset and development of UC [Citation15]. It is known that UC is a typical inflammatory disease, and it has been reported that the NLRP3 inflammasome can be recruited to the gut to promote UC progress by increasing pro-inflammatory cytokines [Citation16]. Moreover, IRF5 can promote UC inflammation by modulating T cell signaling and by regulating secretion of cytokines [Citation17]. In addition, neutrophilic HGF-MET signaling also can accelerate UC progression [Citation18]. Previous studies have also found that there are infiltrated immune cells (IICs) in the intestinal mucosa of UC patients, suggesting that these cells may be involved in the excessive inflammation of mucosal tissues [Citation19]. This finding also suggests that molecules correlated with these cells may serve as new biomarkers of UC. All the aforementioned studies have demonstrated the key role of immune cells in UC pathogenesis.
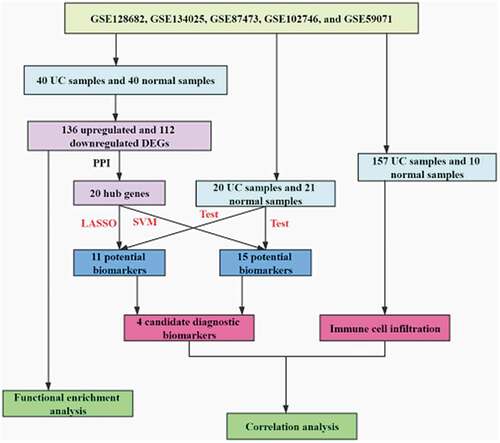
Thus, this study aimed to screen the IICs in intestinal mucosa tissues with UC by Estimating Relative Subsets Of RNA Transcripts (CIBERSORT) software and to identify potential diagnostic biomarkers for UC. Then, correlation between IICs and the diagnostic biomarkers for UC was calculated to identify immune-related genes. The Integrated analysis of IICs and immune-related genes would provide new biomarkers for the diagnosis of UC.
2. Materials and methods
2.1. Data collection and processing
Five UC-related gene datasets, including GSE128682, GSE134025, GSE87473, GSE102746, and GSE59071, were curated from the Gene Expression Omnibus (GEO, https://www.ncbi.nlm.nih.gov/geo/). The details of these gene datasets are listed in Table S1. Three gene datasets (GSE128682, GSE134025, and GSE87473) were combined and used as the training cohort, and other two gene datasets (GSE102746 and GSE59071) were combined and were used as the testing cohort. The effect between any two batches was eliminated by ComBat using the Surrogate Variable Analysis (SVA) package in R. Moreover, two-dimensional Principal Components Analysis (PCA) was used to evaluate the distribution patterns of UC and normal samples. Because equilibrium of the sample size between the UC group and the normal group is required for randomized study [Citation20], 41 UC samples and 40 normal samples were randomly chosen as the training cohort, and 20 UC samples and 21 normal samples were randomly selected as the testing cohort.
2.2. DEG screening
Differentially expressed genes (DEGs) between UC samples and normal samples in the training cohort were screened using the limma package. Genes exhibiting log2 (FC)| >1 and P-value <0.05 were defined as the DEGs. The ggplot2 package and the pheatmap package were used to perform the visualization of the DEGs and to draw the heatmap, respectively.
2.3. Biological function enrichment analysis
Gene Ontology (GO) annotation (BP term, biological processes; MF term, molecular function; CC term, cellular component) and Kyoto Encyclopedia of Genes and Genomes (KEGG) pathway enrichment analysis were accomplished by the clusterProfiler package. When the threshold for enrichment was P-value <0.05, it was significant [Citation21]. The visualization of enrichment results was achieved using the ggplot2 package in R and Cytoscape Version 3.7.1.
2.4. PPI network construction
By utilizing the Search Tool for the Retrieval of Interacting Genes (STRING), the protein–protein interaction network (PPI) was established to further investigate the function of DEGs at the protein level. Next, Cytoscape Version 3.7.1 was used to visualize and analyze the interactions of the proteins, and the cutoff value was set to connection degree >10.
2.5. GSEA enrichment analysis
Gene Set Enrichment Analysis (GSEA) was performed on the gene expression matrix through clusterProfiler package to identify the immune-related pathways [Citation21]. A false discovery rate (FDR) <0.25 and P-value <0.05 were applied to screen the significant enrichment.
2.6. Screening and validation of candidate biomarker
Least absolute shrinkage and selection operator (LASSO) logistic regression and support vector machine (SVM) were used to screen the potential diagnostic biomarkers for UC. The LASSO logistic regression model was created using the glmnet package with the parameter set as family = ‘binomial.’ To avoid overfitting, 10-fold cross-validation was performed with the parameter set as ‘type. measure = auc.’ The training cohort was used to construct the predicted model and verify the diagnostic efficiency of the obtained model, and the testing cohort was only used to validate the diagnostic efficiency of this model. Furthermore, SVM-RFE was performed to screen the best potential biomarkers by deleting SVM-generated eigenvectors. To establish the SVM model based on Radial Basis Function and 10-fold cross-validation, the parameter ‘C = 0.5 and gamma = 0.01’ was used. Genes from LASSO and SVM-RFE algorithm were preserved for subsequent analysis. Differences between UC samples and normal samples were statistically significant when a two-sided P-value <0.05.
2.7. Profile of immune cell infiltration
Immune cells proportion and composition were assessed using CIBERSORT algorithm. Next, the correlation heatmap of IICs was drawn using the corrplot package. Wilcoxon rank-sum test was used to assess the differences in the proportion of IICs between UC and control. The distribution of the IICs was evaluated using the vioplot R package. Moreover, the differences in IICs between UC samples and normal samples were also verified through PCA, and the correlation between the candidate markers and IICs of UC samples was analyzed using the corrplot package in R.
3. Results
Although previous studies have found that there are infiltrated immune cells in the intestinal mucosa of UC patients, the proportion and composition of immune cells for UC were not clear. Thus, this study aimed to screen the immune cells in intestinal mucosa tissues with UC by CIBERSORT software and to identify potential diagnostic biomarkers for UC by combining the LASSO algorithm and SVM algorithm. Ultimately, the immune cell infiltration in UC tissues was characterized and DPP10, S100P, AMPD1, and ASS1 were screened as candidate diagnostic biomarkers for UC based on bioinformatics analysis.
3.1. DEG identification
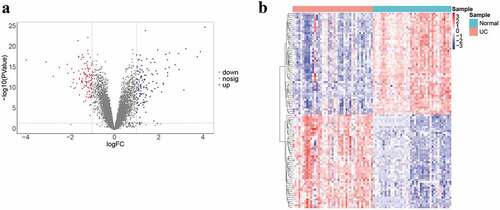
There were obvious batch effects between the five datasets (Fig. S1A). The merged gene expression matrix was normalized and adjusted using ComBat and SVA methods, and the two-dimensional PCA cluster plot showed that the batch effects had been removed (Fig. S1B). These suggested that the normalized and adjusted data from these datasets were suitable for subsequent analyses. A total of 248 DEGs were screened between UC samples and normal samples in the training cohort (), which included 136 upregulated and 112 downregulated DEGs (). The genes of top 10 DEGs in the training cohort are presented in Table S2.
Figure 1. Data collection, processing, and DEG identification
3.2. GO function and KEGG pathway enrichment analysis
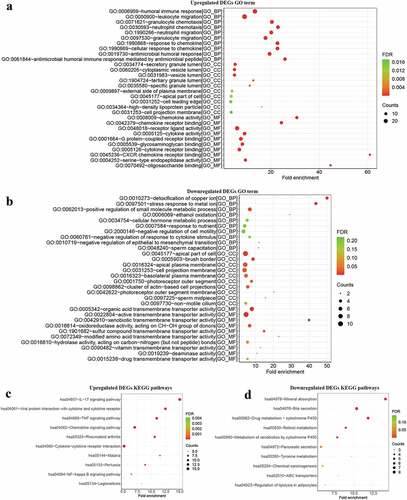
To investigate the biological function of DEGs in the development of UC, GO function and KEGG pathway enrichment analysis was performed by the clusterProfiler package. The results of GO terms for biological processes showed that the upregulated DEGs were mainly involved in humoral immune responses, leukocyte migration, and granulocyte chemotaxis (, Table S3). The enriched GO terms for cell component of upregulated DEGs included secretory granule lumen and the cytoplasmic vesicle lumen (, Table S3). In addition, enriched GO terms for molecular function also revealed that upregulated DEGs were mainly involved in immune-related function such as chemokine activity and chemokine receptor binding. KEGG pathway enrichment analysis revealed the upregulated DEGs were mostly enriched in terms of immune signaling pathways (, Table S4). Inversely, downregulated DEGs were mainly concentrated in metabolism-related processes such as detoxification of copper ion and ethanol oxidation (, Table S5). Cell component analysis suggested that the downregulated DEGs were mainly focused on the apical part of cell, brush border, and apical plasma membrane (, Table S5). Through molecular function analysis, the downregulated DEGs were found to be related to transmembrane transporter activity (, Table S5). Moreover, downregulated DEGs were significantly enriched in metabolism-related pathways like mineral absorption, bile secretion, and drug metabolism-cytochrome P450 (, Table S6). The results indicated that immune response and metabolism pathways may be associated with the complex pathophysiology of UC.
Figure 2. GO and KEGG analysis
3.3. Construction of the PPI network
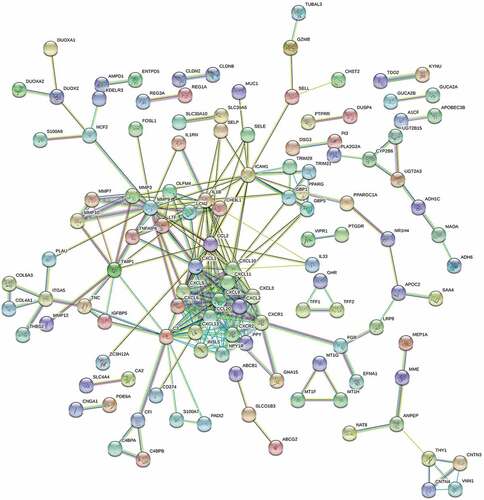
Afterward, 248 DEGs were uploaded into STRING to construct the PPI network for investigating the function of these genes at the protein level, along with screening hub genes. The hub genes in the network were screened through Cytoscape Version 3.7.1 (). The top 20 hub genes with connective degree >10 were identified, including the CXCL chemokine family (CXCL1, CXCL10, CXCL5, CXCL3, CXCL2, CCL20, CXCL11, CXCL13, CXCL9, and CXCL6), CCL2, chemokine receptors (CXCR1, CXCR2), MMP9, C3, IL1B, ICAM1, INSL5, NPY1R, and PPY (Table S7). Interestingly, the genes above were mainly concerned with immune regulation and response.
Figure 3. Construction, visualization, and analysis of the PPI network
3.4. Immune-related pathway enrichment analysis
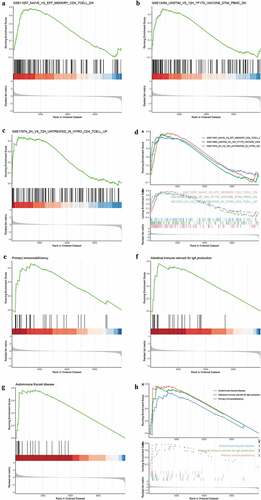
To further explore the role of immune response in UC, C7 (immunologic gene sets) from the Molecular Signatures Database was set as a predefined set. A total of 864 immune-related pathways were enriched by GSEA with a threshold P-value <0.01, and mostly pathways were related to the activation of B cells and T cells. The top three pathways were T cell activation (,), immune responses (,), and Th2 cells differentiation (,). A total of 95 KEGG pathways were enriched by GSEA with a P-value threshold of <0.05. The top three pathways included primary immunodeficiency (,), intestinal immune network for IgA production (,), and autoimmune thyroid disease (,). As expected, GSEA results suggested that the immune response acts as a vital mechanism in UC progression.
Figure 4. Immune-related pathway enrichment analysis. (a-h) GSEA for immune-related pathways
3.5. Identification and validation of four candidate biomarkers in UC
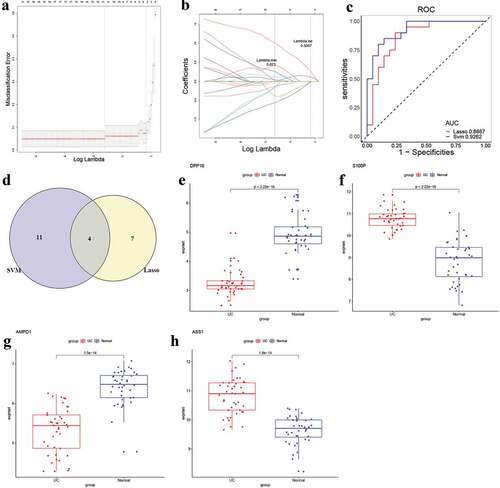
The LASSO regression model was used to identify the candidate biomarkers from 248 DEGs for UC. Then, 11 genes were identified as potential diagnostic biomarkers from 248 DEGs with a lambda min = 0.073 (,), and the diagnostic efficiency of this model was validated through ROC curves in the training set (AUC = 1, and S4A, Table S8) and the testing set (AUC = 0.8667, and S4B, Table S8). Next, 15 genes were identified as potential diagnostic biomarkers from 248 DEGs for UC using the SVM-RFE algorithm (Table S9). Moreover, the accuracy of the SVM-RFE model was tested using the ROC curves, and the results showed high accuracy in the training set (AUC = 1, and S4C, Table S9) and the testing set (AUC = 0.9262, and S4D, Table S9). Finally, four genes (DPP10, S100P, AMPD1 and ASS1) were identified as candidate diagnostic biomarkers for UC after overlapped potential biomarkers from the two models (). For further analyzing the role of the four genes in UC, the expression of these genes was examined. The box plots showed that DPP1 () and AMPD1 () were downregulated, while S100P () and ASS1 () were upregulated in UC patients compared to normal control.
Figure 5. Identification and validation of candidate UC biomarkers
3.6. Profile of immune infiltration in UC
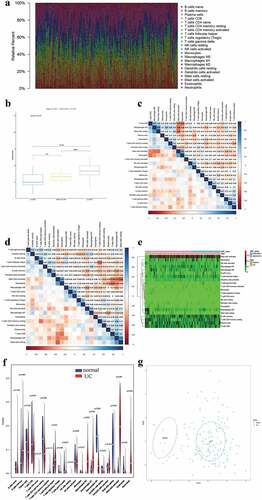
To ensure statistical power, the GSE87473 and GSE59071 gene datasets were preserved for immune infiltration analysis. Other two gene datasets (GSE134025 and GSE102746) were excluded from the following analysis because the CIBERSORT P-values of all samples from them were not met (p > 0.05). Moreover, GSE128682 gene dataset was excluded from the following analysis, because the dataset was sequenced by high throughput method, which could influence the accuracy of CIBERSORT. PCA results showed that the effect of batch between GSE59071 dataset and GSE87473 dataset was normalized and adjusted (FigureS2A and S2B). Thus, these samples could be used for subsequent analysis. The cytolytic activities of the GSE59071 and GSE87473 datasets were calculated to verify the significance of CIBRSORT algorithm, and the results showed a significant correlation between the cytolytic activity and CIBRSORT P-value threshold (one-way ANOVA, P-value = 2.5E-0.5, ). After the screening with a CIBERSORT P-value <0.05, cytolytic activity was most strongly positively associated with plasma cells (correlation = 0.31, P < 0.01, ) and a total of 157 UC samples and 10 normal samples were screened for further analysis. In brief, these results showed the accuracy of the CIBERSORT algorithm. Next, the composition and proportion of IICs were evaluated by the CIBRSORT algorithm. shows the distribution of IICs in each sample. The correlation analysis of IICs indicated that M2 macrophages and resting mast cells had a positive correlation (correlation = 0.56, P < 0.001, ), whereas activated mast cells showed a negative correlation with resting mast cells (correlation = −0.53, P < 0.001, ). The difference in IICs between UC samples and normal samples was determined by the Wilcoxon rank-sum test. The heatmap and the violin plot of the different proportions of IICs showed the statistically significant differences in 13 IICs between UC samples and normal samples (,). Obviously, infiltrating levels of M0/M1 macrophages (p < 0.001), memory B cells (p = 0.009), activated mast cells (p < 0.001), follicular helper T cells (p = 0.04), gamma delta T cells (p = 0.023), CD4 memory resting T cells (p = 0.004), and neutrophils (p < 0.001) were elevated in UC samples (,, Table S10). Inversely, infiltration levels of resting mast cells (p < 0.001), M2 macrophages (p < 0.001), CD8 T cells (p = 0.032), resting dendritic cells (p = 0.033), and eosinophils (p = 0.001) were downregulated in UC samples compared with normal samples (,, Table S10). Moreover, CD4 naïve T cells and resting NK cells were only observed in UC samples (,, Table S10). In addition, the two-dimensional PCA cluster plot showed a significant difference in IICs between the UC and normal control ().
Figure 6. Assessment of immune infiltration
3.7. Correlation between four candidate biomarkers and immune-infiltrated cells in UC
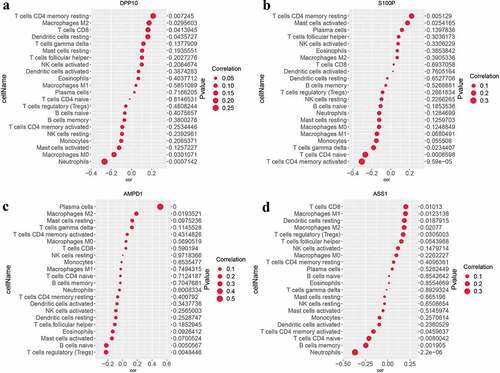
The relationships between candidate UC biomarkers and the IICs which differ between UC and normal samples were further calculated with the corrplot package. The results demonstrated that DPP10 was negatively correlated with neutrophils (correlation = −0.28, P < 0.001, and S3), S100P exhibited positive correlation with resting CD4 memory T cells (correlation = 0.22, P = 0.005, and S3), AMPD1 was positively associated with M2 macrophages (correlation = 0.19, P = 0.019, and S3), and ASS1 was negatively associated with neutrophils (correlation = −0.37, P < 0.001, and S3) and positively related to CD8 T cells (correlation = 0.21, P = 0.010, and S3). These findings further suggested that four candidate biomarkers were strongly correlated with IICs in UC.
Figure 7. Analysis of the correlation between candidate biomarkers and IICs in UC
4. Discussion
Gene expression data required for this study were obtained from GEO database. After bitch correction, 248 DEGs inclusive of 136 upregulated and 112 downregulated DEGs were mined out from training set. The outcomes of GO and KEGG functional enrichment analysis indicated that these DEGs were mostly enriched in pathways associated with immune response, such as IL-17 signaling pathway, granulocyte chemotaxis, and leukocyte migration, and so on. These results indicated that the immune factors play a crucial part in UC. Indeed, previous studies have suggested that dysregulated genes in UC are primarily focused on the immune processes [Citation22,Citation23], and infiltration of granulocytes and IL-17 signaling contributes to colon tissue damage and inflammation [Citation24,Citation25]. Moreover, CD4 T cells and NKT cells were well documented to increase the secretion of Th2-related cytokines and Th17-associated proinflammatory cytokines to contribute to intestinal mucosal inflammation [Citation26,Citation27]. In brief, the results of the function annotation and pathways enrichment analysis provided new evidence to illustrate that immune processes play a key part in UC pathogenesis.
In addition, 20 hub genes were identified, such as those of CXC family of chemokines (CXCL1, CXCL10, etc.), CC family of chemokines (CCL2 and CCL20), pro-inflammatory cytokines (IL1B, ICAM1, MMP9, C3), and metabolism-related genes (INSL5, NPY1R, and PPY). As is known, for inflammatory diseases like UC, chemokines can recruit the leukocytes into the intestinal mucosa, triggering various inflammatory effects, including leukocyte activation, extravasation of particles, and production of metalloproteases for matrix degradation [Citation28]. Now, it has been established that chemokines may play a vital role in UC etiology. Evidence from both experimental animal models and clinical cases also supported that chemokines were associated with the mechanism of colitis [Citation29]. The finding of metabolism-related genes further supported that metabolomic profiling may be selected as novel pathophysiological targets and biomarkers, which was exactly consistent with that of Keshteli et al. [Citation30]. Furthermore, GSEA results showed that DEGs from training set were predominantly enriched in immune-associated signaling. It is widely known that activated T cells can differentiate into regulatory and effector T cells [Citation31], resulting in inflammation of inflammatory bowel diseases [Citation32]. Currently, it was assured that UC might be related to atypical immune response induced by Th2 cells through upregulation of IL-13 and IFN-γ [Citation33]. Moreover, Paschou et al. have found that patients with inflammatory bowel disease showed a rather high percentage of thyroid autoimmunity [Citation34], indicating that the immune response of UC may increase the risks of thyroid autoimmunity.
Besides, we identified and validated candidate UC diagnostic biomarkers including DPP10, S100P, AMPD1, and ASS1 by combining LASSO and the SVM-RFE algorithm. Although these two algorithms have different characteristics, it was obviously that these four genes were obtained not only from the result of LASSO algorithm but also the SVM-RFE algorithm, which suggested that these four genes might be selected as the candidate diagnostic biomarkers. DPP10 is an important modulator of physiological properties of Kv4.3 channels [Citation35]. Allen et al. have reported that dipeptidase homologues (encoded by DPP10) can cleave the terminal dipeptides of cytokines and chemokines, thus regulating the inflammatory response [Citation36]. Moreover, Wang et al. found that DPP10 might predict the risk of colorectal cancer [Citation37]. S100P can encode S100 protein family which includes S100A8 and S100A9, two common fecal biomarkers for UC. Proteins in this family participate in regulating cell cycle progression and differentiation. A study also reported that S100P overexpression is associated with UC and UC-associated colorectal cancer [Citation38]. Besides, whole-genome transcriptional analysis of UC patients also found a dramatic increase in levels of S100P in UC cases, whether active or not, when compared with non-inflammatory bowel diseases controls and normal controls [Citation39]. AMPD1, a metabolism-related gene, encodes adenosine monophosphate deaminase. Recent studies suggest that AMPD1 is closely associated with the prognosis of tumors [Citation40,Citation41]. However, the role of AMPD1 in UC or other inflammatory bowel diseases was not previously been elucidated. ASS1 is a cytosolic enzyme that plays a key role in amino acid metabolism [Citation42]. Tarasenko et al. have reported that ASS1 is closely related to T cell differentiation and function [Citation43]. Moreover, Zhong et al. found that knockdown of ASS1 can induce the endotoxin accumulation and pro-inflammatory cytokines secretion [Citation44]. Therefore, DPP10, S100P, AMPD1, and ASS1 may be involved in the etiology and progression of UC. However, additional in vivo and in vitro studies are required to verify the results of the present study.
Next, to further investigate the role of IICs in UC, CIBERSORT algorithm was used to assess the fraction of immune cells in UC. The results of CIBERSORT showed that 13 immune cells were differentially expressed in the UC samples, and two immune cells only expressed in the UC samples, suggesting that differentially expressed IICs may participate in onset and progression of UC. It has been observed that there is a dramatic change in CD8 T cells in inflammatory bowel disease by single-cell analyses [Citation45]. The present study also found CD8 T cells were upregulated, which further suggested the role of CD8 T cells in UC. Furthermore, it was shown that DPP10 was negatively associated with neutrophils and positively related to CD4 memory resting T cells, S100P exhibited positive correlation with CD4 memory resting T cells, AMPD1 was positively correlated with plasma cells and M2 macrophages, and ASS1 was negatively associated with neutrophils and positively related to CD8 T cells. All these results indicated that DPP10, S100P, AMPD1, and ASS1 may be involved in UC development by immune regulation. Of course, these speculations require further study to verify the role of immune response by integrated regulation of genes and IICs in UC.
Overall, four genes (DPP10, S100P, AMPD1, and ASS1) were identified as the candidate diagnostic biomarkers of UC. In addition, 13 differentially expressed IICs were found in UC samples compared with normal samples, and two IICs only expressed in the UC samples, suggesting that differentially expressed IICs may participate in the onset and/or progression of UC. Furthermore, it was shown that these hub genes exhibited correlation with IICs. However, there was a shortcoming to this study. The findings were based on the big data analysis of GEO database, and the necessary experiments to validate the identified genes were deficient. More experimental validations in both in vivo and in vitro are needed to further clarify these findings in the future.
5. Conclusion
Through integrating multiple bioinformatics tools, immune cell infiltration characteristics were identified in UC tissues, and DPP10, S100P, AMPD1, and ASS1 we screened may serve as candidate diagnostic biomarkers of UC. These findings will contribute to understand the pathogenesis of UC, and further investigations need to be done to support our conclusions.
Abbreviations
| UC | = | ulcerative colitis |
| DEGs | = | Differentially Expressed Genes |
| GEO | = | Gene Expression Omnibus |
| SVA | = | Surrogate Variable Analysis |
| PCA | = | Principal Components Analysis |
| GO | = | Gene Ontology |
| KEGG | = | Kyoto Encyclopedia of Genes and Genomes |
| SVM | = | support vector machine |
| STRING | = | Search Tool for the Retrieval of Interacting Genes |
| PPI | = | Protein–protein interaction network |
| GSEA | = | Gene Set Enrichment Analysis |
| LASSO | = | Least absolute shrinkage and selection operator |
| RBF | = | Radial Basis Function |
Authors’ contributions
GX and JL were responsible for the design of this study; GX and LH performed data collection and analysis; GX wrote and edited the manuscript; NZ and JL critically reviewed and revised the manuscript; JL organized and supervised the execution of the study.
Highlights
Four genes were identified as the candidate diagnostic biomarkers of UC.
15 immune cells were differentially expressed in UC.
DPP10, S100P, AMPD1, and ASS1 may be involved in pathogenesis of UC.
Supplemental Material
Download ()Acknowledgements
The authors thank “Editage.com” for English editorial assistance.
Disclosure statement
All authors declare that they do not have any conflict of interest regarding this study.
Data availability statement
All of the datasets analyzed were acquired from the Gene Expression Omnibus (GEO) database (https://www.ncbi.nlm.nih.gov/gds).
Supplementary material
Supplemental data for this article can be accessed here.
Additional information
Funding
Related Research Data
References
- Ungaro R, Mehandru S, Allen PB, et al. Ulcerative colitis. Lancet. 2017;389(10080):1756–1770.
- Haberman Y, Karns R, Dexheimer PJ, et al. Ulcerative colitis mucosal transcriptomes reveal mitochondriopathy and personalized mechanisms underlying disease severity and treatment response. Nat Commun. 2019;10(1):38.
- Feuerstein JD, Moss AC, Farraye FA. Ulcerative Colitis. Mayo Clin Proc. 2019;94(7):1357–1373.
- Koch AK, Schöls M, Langhorst J, et al. Perceived stress mediates the effect of yoga on quality of life and disease activity in ulcerative colitis. Secondary analysis of a randomized controlled trial. J Psychosom Res. 2020;130:109917.
- Kotze PG, Steinwurz F, Francisconi C, et al. Review of the epidemiology and burden of ulcerative colitis in Latin America. Therap Adv Gastroenterol. 2020;13:1756284820931739.
- M’Koma AE. Inflammatory bowel disease: an expanding global health problem. Clin Med Insights Gastroenterol. 2013;6:33–47.
- Zingone F, Barberio B, Compostella F, et al. Good efficacy and safety of vedolizumab in Crohn’s disease and ulcerative colitis in a real-world scenario. Therap Adv Gastroenterol. 2020;13:1756284820936536.
- Targownik LE, Benchimol EI, Bernstein CN, et al. Combined biologic and immunomodulatory therapy is superior to monotherapy for decreasing the risk of inflammatory bowel disease-related complications. J Crohns Colitis. 2020;14(10):1354–1363.
- Conrad K, Roggenbuck D, Laass MW. Diagnosis and classification of ulcerative colitis. Autoimmun Rev. 2014;13(4–5):463–466.
- Ostrowski J, Dabrowska M, Lazowska I, et al. Redefining the practical utility of blood transcriptome biomarkers in inflammatory bowel diseases. J Crohns Colitis. 2019;13(5):626–633.
- Barrett T, Wilhite SE, Ledoux P, et al. NCBI GEO: archive for functional genomics data sets–update. Nucleic Acids Res. 2013;41(Database issue):D991–D995.
- Ryan M, Wong WC, Brown R, et al. TCGASpliceSeq a compendium of alternative mRNA splicing in cancer. Nucleic Acids Res. 2016;44(D1):D1018–D1022.
- Tang B, Zhu J, Li J, et al. The ferroptosis and iron-metabolism signature robustly predicts clinical diagnosis, prognosis and immune microenvironment for hepatocellular carcinoma. Cell Commun Signal. 2020;18(1):174.
- Liu Z, Li M, Fang X, et al. Identification of surrogate prognostic biomarkers for allergic asthma in nasal epithelial brushing samples by WGCNA. J Cell Biochem. 2019;120(4):5137–5150.
- Ramos GP, Papadakis KA. Mechanisms of Disease: inflammatory Bowel Diseases. Mayo Clin Proc. 2019;94(1):155–165.
- Samoilă I, Dinescu S, Costache M. Interplay between cellular and molecular mechanisms underlying inflammatory bowel diseases development-a focus on ulcerative colitis. Cells. 2020;9(7):1647.
- Yan J, Pandey SP, Barnes BJ, et al. T cell-intrinsic IRF5 regulates T cell signaling, migration, and differentiation and promotes intestinal inflammation. Cell Rep. 2020;31(13):107820.
- Stakenborg M, Verstockt B, Meroni E, et al. Neutrophilic HGF-MET signaling exacerbates intestinal inflammation. J Crohns Colitis. 2020;14(12):1748–1758.
- Ordás I, Eckmann L, Talamini M, et al. Ulcerative colitis. Lancet. 2012;380(9853):1606–1619.
- Montaigne D, Marechal X, Modine T, et al. Daytime variation of perioperative myocardial injury in cardiac surgery and its prevention by Rev-Erbα antagonism: a single-centre propensity-matched cohort study and a randomised study. Lancet. 2018;391(10115):59–69.
- Yu G, Wang LG, Han Y, et al. clusterProfiler: an R package for comparing biological themes among gene clusters. OMICS. 2012;16(5):284–287.
- Tanaka K. Expression of Toll-like receptors in the intestinal mucosa of patients with inflammatory bowel disease. Expert Rev Gastroenterol Hepatol. 2008;2(2):193–196.
- Dieckgraefe BK, Stenson WF, Korzenik JR, et al. Analysis of mucosal gene expression in inflammatory bowel disease by parallel oligonucleotide arrays. Physiol Genomics. 2000;4(1):1–11.
- Dent G, Loweth SC, Hasan AM, et al. Synergic production of neutrophil chemotactic activity by colonic epithelial cells and eosinophils. Immunobiology. 2014;219(10):793–797.
- Nanki K, Fujii M, Shimokawa M, et al. Somatic inflammatory gene mutations in human ulcerative colitis epithelium. Nature. 2020;577(7789):254–259.
- Baumgart DC, Sandborn WJ. Crohn’s disease. Lancet. 2012;380(9853):1590–1605.
- Latella G, Papi C. Crucial steps in the natural history of inflammatory bowel disease. World J Gastroenterol. 2012;18(29):3790–3799.
- Danese S, Gasbarrini A. Chemokines in inflammatory bowel disease. J Clin Pathol. 2005;58(10):1025–1027.
- Singh UP, Singh NP, Murphy EA, et al. Chemokine and cytokine levels in inflammatory bowel disease patients. Cytokine. 2016;77:44–49.
- Keshteli AH, Madsen KL, Mandal R, et al. Comparison of the metabolomic profiles of irritable bowel syndrome patients with ulcerative colitis patients and healthy controls: new insights into pathophysiology and potential biomarkers. Aliment Pharmacol Ther. 2019;49(6):723–732.
- Kmieć Z, Cyman M, Ślebioda TJ. Cells of the innate and adaptive immunity and their interactions in inflammatory bowel disease. Adv Med Sci. 2017;62(1):1–16.
- Sanchez-Munoz F, Dominguez-Lopez A, Yamamoto-Furusho JK. Role of cytokines in inflammatory bowel disease. World J Gastroenterol. 2008;14(27):4280–4288.
- Tatiya-Aphiradee N, Chatuphonprasert W, Jarukamjorn K. Immune response and inflammatory pathway of ulcerative colitis. J Basic Clin Physiol Pharmacol. 2018;30(1):1–10.
- Paschou SA, Palioura E, Kothonas F, et al. The effect of anti-TNF therapy on thyroid function in patients with inflammatory bowel disease. Endocr J. 2018;65(11):1121–1125.
- Turnow K, Metzner K, Cotella D, et al. Interaction of DPP10a with Kv4.3 channel complex results in a sustained current component of human transient outward current Ito. Basic Res Cardiol. 2015;110(2):5.
- Allen M, Heinzmann A, Noguchi E, et al. Positional cloning of a novel gene influencing asthma from chromosome 2q14. Nat Genet. 2003;35(3):258–263.
- Wang X, Su YR, Petersen PS, et al. Exploratory genome-wide interaction analysis of nonsteroidal anti-inflammatory drugs and predicted gene expression on colorectal cancer risk. Cancer Epidemiol Biomarkers Prev. 2020;29(9):1800–1808.
- Brentnall TA, Pan S, Bronner MP, et al. Proteins that underlie neoplastic progression of ulcerative colitis. Proteomics Clin Appl. 2009;3(11):1326.
- Planell N, Lozano JJ, Mora-Buch R, et al. Transcriptional analysis of the intestinal mucosa of patients with ulcerative colitis in remission reveals lasting epithelial cell alterations. Gut. 2013;62(7):967–976.
- Luo X, Yu H, Song Y, et al. Integration of metabolomic and transcriptomic data reveals metabolic pathway alteration in breast cancer and impact of related signature on survival. J Cell Physiol. 2019;234(8):13021–13031.
- Zha T, Wu H. Expression of serum AMPD1 in thyroid carcinoma and its clinical significance. Exp Ther Med. 2018;15(4):3357–3361.
- Haines RJ, Pendleton LC, Eichler DC. Argininosuccinate synthase: at the center of arginine metabolism. Int J Biochem Mol Biol. 2011;2(1):8–23.
- Tarasenko TN, Gomez-Rodriguez J, McGuire PJ. Impaired T cell function in argininosuccinate synthetase deficiency. J Leukoc Biol. 2015;97(2):273–278.
- Zhong W, Li Q, Xie G, et al. Dietary fat sources differentially modulate intestinal barrier and hepatic inflammation in alcohol-induced liver injury in rats. Am J Physiol Gastrointest Liver Physiol. 2013;305(12):G919–G932.
- Boland BS, He Z, Tsai MS, et al. Heterogeneity and clonal relationships of adaptive immune cells in ulcerative colitis revealed by single-cell analyses. Sci Immunol. 2020;5(50):eabb4432.