1,428
Views
7
CrossRef citations to date
0
Altmetric
Research Paper

Effect of low-level ultrasound treatment on the production of L-leucine by Corynebacterium glutamicum in fed-batch culture

, , , ORCID Icon &
Pages 1078-1090 | Received 22 Jan 2021, Accepted 09 Mar 2021, Published online: 29 Mar 2021

ABSTRACT

Various process intensification methods were proposed to improve the yield, quality, and safety of fermented products. Here, we report the enhancement of L-leucine production by Corynebacterium glutamicum CP using ultrasound-assisted fed-batch fermentation. Response surface methodology was employed to optimize the sonication conditions. At an ultrasonic power density of 94 W/L, frequency of 25 kHz, interval of 31 min, and duration of 37 s, C. glutamicum CP produced 52.89 g/L of L-leucine in 44 h, representing a 21.6% increase compared with the control. The production performance of L-leucine was also improved under ultrasonic treatment. Moreover, the effects of ultrasound treatment on the fermentation performance of L-leucine were studied in terms of cell morphology, cell membrane permeability, and enzyme activity. The results indicate that ultrasonication is an efficient method for the intensification of L-leucine production by C. glutamicum CP.
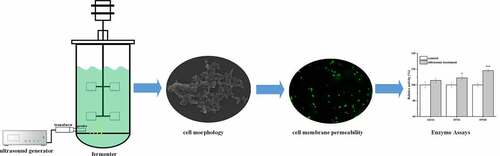
Graphical abstract

Introduction

L-leucine, is one of eight essential amino acids that cannot be synthesized by mammals, with important roles in physiological functions and metabolism [Citation1–3]. L-leucine is naturally found in food, and is also used in the pharmaceutical industry, cosmetics, as a precursor for antibiotics and herbicides, or as a food additive [Citation4]. Generally, L-leucine can be produced by protein hydrolysis and extraction, chemical synthesis, enzymatic methods, and microbial fermentation. With the rising market demand for L-leucine, fermentation methods have attracted increasing attention due to their economic and environmental advantages.

The most common bacteria used for L-leucine production via fermentation are Corynebacterium glutamicum and Escherichia coli [Citation5,Citation6]. Most early L-leucine production strains were the product of random mutagenesis and screening, but this approach introduces unclear genetic alterations, which may cause unwanted effects such as, growth retardation, increased by-product formation, and genetic instability [Citation7]. Consequently, recent studies on L-leucine production relied on targeted genetic manipulation to avoid this problem. Genetically defined strains with high productivity can be created by improving the supply of precursors, releasing feedback inhibition, blocking competing pathways, and overexpressing genes related to the target amino acid synthesis pathways [Citation4,Citation8,Citation9]. There are a number of reports on the metabolic engineering of microbial cells for improved L-leucine production [Citation10–12].

With C. glutamicum ATCC13032 taken as the chassis strain, an efficient L-leucine production strain, MV-LeuF2, can accumulate L-leucine to levels exceeding 24 g/L under fed-batch culture conditions [Citation10]. Although great strides have been made in the development of L-leucine-producing strains, process control and technology are essential to maximize the production performance of the strains and achieve industrially relevant yields. As a non-thermal physical processing method, ultrasound treatment has been widely investigated for applications in the food industry, especially in fermentation engineering [Citation13,Citation14]. Ultrasound technology can be used as a process intensification method to achieve safer, cleaner, and more energy-efficient production modalities. However, while low-level ultrasound can stimulate the growth of microorganisms depending on the intensity and frequency of the applied ultrasound, inappropriately calibrated ultrasound treatment can easily be lethal [Citation15]. Ultrasound can alter the metabolic activity of microbial cells, thus accelerating proliferation, increasing enzyme production and metabolite titers, as well as increasing the membrane permeability [Citation16,Citation17]. Similarly, low-intensity ultrasound has been reported to increase the membrane permeability and hydrophobicity of biofilm-forming microorganisms, exerting positive effects on biofilm formation by increasing the delivery of oxygen and nutrients to the deeper layers [Citation18,Citation19].

Beneficial effects of low-level ultrasound on fermentation have been observed in several microorganisms [Citation20]. In general, Gram-positive bacteria are more resistant to ultrasound than Gram-negative bacteria due to their characteristic cell walls, wall thickness and the cross-linking of peptidoglycans that makes them more robust [Citation21]. For instance, the acetone-butanol-ethanol (ABE) yield of Clostridium acetobutylicum MTCC 11274 in an ultrasound-assisted fermentation process reached 0.288 g/g raw biomass after 92 h, compared with 0.168 g/g raw biomass after 120 h using only mechanical agitation [Citation22]. Similarly, ultrasonic treatment was found to increase the production rate of GSH by S. cerevisiae [Citation23]. Furthermore, ultrasonic treatment was found to increase the membrane permeability and substrate utilization of mixotrophic microalgae without significantly reducing their viability, resulting in a significant increase of biomass and lipid accumulation [Citation24]. Due to these promising results and application prospects, ultrasound technology has attracted increasing attention in fermentation engineering.

In this study, we used low-intensity sonication to intensify the L-leucine fermentation process. We investigated the effects of different ultrasound power densities, frequencies, intervals, and durations on the growth and L-leucine production of C. glutamicum CP, finally identifying the optimal combination using response surface methodology (RSM). We also analyzed the effects of ultrasound on cell morphology, cell membrane permeability, and activity of key enzymes to understand the mechanism of fermentation enhancement by ultrasound treatment.

Materials and methods

Strain and culture media

The leucine-producing strain Corynebacterium glutamicum CP was engineered through multiple rounds of random mutagenesis and screening [Citation25]. The complete genome sequence of C. glutamicum CP was reported by Gui et al. [Citation26].

The medium used for seed culture contained (per liter): 40 g glucose, 40 g corn steep liquor (CSL), 2 g KH2PO4 · 12H2O, 2 g MgSO4 · 7H2O, 5 mg FeSO4 · 7H2O, 0.2 g L-methionine, 0.3 g L-isoleucine, 0.5 mg biotin, and 0.2 mg thiamine.

The fermentation medium consisted of (per liter): 100 g glucose, 20 g CSL, 2 g KH2PO4 · 12H2O, 3 g MgSO4 · 7H2O, 30 mg MnSO4·H2O, 30 mg FeSO4 · 7H2O, 0.2 g L-methionine, 0.3 g L-isoleucine, 2 g L-glutamic acid, 0.3 mg biotin, and 0.3 mg thiamine. All media were adjusted to pH 7.2 with NaOH. All reagents were purchased from Sinopharm Chemical Reagent (China).

Fed-batch cultivation

Fed-batch cultivations were performed in a 30-L fermenter (Baoxing Biological Equipment Engineering Co., LTD, Shanghai, China). Bacterial growth was monitored by measuring the optical density at 600 nm (OD600). When the cells reached the mid-exponential phase (OD600 = 15–20), the seed culture was transferred into the bioreactors with the indicated inoculum size. Culture temperature was maintained at 32°C and pH was maintained at 7.0–7.2 by automated addition of ammonium hydroxide (25%, v/v). the dissolved oxygen saturation (DO) was kept at 20–30% by adjustment of the agitation and aeration rates. Antifoam 204 (Sigma-Aldrich, China) was added to the bioreactor to prevent foam formation when necessary. When the concentration of glucose in the medium fell below 10 g/L, feed solution (80% glucose, w/v) was added to maintain a residual glucose concentration of approximately 5 g/L in the feed phase.

Determination of the optimal ultrasonic treatment scheme

The fermentation system consisted of a fermenter and multi-frequency power ultrasonic equipment (Handan Haituo Machinery Technology Co. LTD, Hebei, China). The ultrasonic system included an ultrasound generator, transducer, and a probe attached to the bottom of the fermenter (Fig. S1). The single-factor experiment included two parts: exploring the effect of ultrasound treatment in different growth phases, and the effects of ultrasonic power density (50–250 W/L), frequency (15–40 kHz), interval (10–50 min), and duration (20–60 s) on the growth of C. glutamicum CP.

RSM analysis of the optimal ultrasonic treatment scheme for the production of L-leucine

RSM has been used in several ultrasound studies [Citation27–29]. For instance, RSM coupled with Box–Behnken design was chosen to identify relations between the responses (in vitro angiotensin-I-converting enzyme inhibitory activity, peptide content, and biomass of B. subtilis) and some ultrasonic treatment parameters [Citation30]. The production of L-leucine was performed in a growth-coupled process, so the optimum ultrasonic conditions for L-leucine production were based on the single-factor experiments described above. The influence of ultrasonic power density, frequency, interval, and duration on L-leucine production was investigated using RSM. Design Expert statistical software (version 8.0.6, Stat-Ease, Inc., USA) was used for the experimental design and statistical analysis. To evaluate the influence of the parameters and their interactions on the response surface, a three-level, four-factor Box–Behnken design was employed. The experimental variables were investigated at three levels (−1, 0, +1; Table S1). The titer of L-leucine produced by C. glutamicum CP was selected as the response vector, Y (g/L). The response variables were fitted to the second-order polynomial model equation (1), which describes the relationship between the responses and independent variables.

Eq. (1): Y = β0 + Aβ1 + Bβ2 + Cβ3 + Dβ4 + ABβ5 + ACβ6 + ADβ7 + BCβ8 + BDβ9 + CDβ10 + A2β11 + B2β12 + C2β13 + D2β14

where Y is the response (L-leucine titer), A is the ultrasound power density, B is the ultrasound frequency, C is the ultrasonication interval, D is the duration of ultrasonication, β0 is a constant, β1–β4 are linear coefficients, β5–β10 are interaction coefficients between the factors, and β11–β14 are quadratic coefficients.

Analytical methods

Samples comprising 5 mL of the fermentation broth were taken every 4 h for analysis. Cell growth was determined by detecting changes in dry cell weight (DCW). The cells were collected by centrifugation (8000 × g, 10 min, 4°C) and then washed with distilled water, and dried at 105°C until achieving a constant weight.

The SBA-40E immobilized enzyme biosensor (Biology Institute of Shandong Academy of Sciences, Jinan, China) was employed to measure the concentration of residual glucose in the culture supernatant. The L-leucine concentration was measured by high-performance liquid chromatography (HPLC) using an LC20AT system (Shimadzu, Kyoto, Japan) equipped with an Agilent ZORBAX Eclipse AA column (4.6 × 150 mm, 5 µm; Agilent Technologies, Palo Alto, CA, USA) and a UV detector (360 nm). 50% acetonitrile and 50 mM sodium acetate were used as the mobile phase at a flow rate of 1 mL/min [Citation25]. All samples were measured in triplicate.

Preparation of the crude enzyme solution and determination of enzyme activity

To prepare the crude enzyme solution for measuring the enzyme activities of acetohydroxyacid synthase (AHAS), isopropylmalate synthase (IPMS), and 3-isopropylmalate dehydratase (IPMD), the cells were collected by centrifugation (8000 × g, 10 min, 4°C) and washed with 50 mM Tris-HCl (pH 7.4). Then, the resuspended cells were lysed by sonication, and the resulting crude lysate centrifuged (40,000 × g, 30 min, 4°C) to remove cell debris. The cleared supernatant constituted the crude enzyme solution. The protein concentration was determined using a BCA Protein Assay Kit (Solarbio, Beijing, China). The protein concentrations and enzyme activities were measured in triplicate.

AHAS enzyme activity was determined according to a published method [Citation31]. One unit of enzyme activity was defined as the amount of enzyme required to produce 1 µmol of acetolactate per minute under the assay conditions.

IPMS enzyme activity was determined by detecting coenzyme A formation using Ellmann’s reagent [Citation10]. One unit of enzyme activity was defined as the amount of enzyme that converts 1 µmol of α-isopropylmalate per min under the assay conditions.

IPMD enzyme activity was determined by detecting the production of the reaction intermediate α-isopropyl maleate [Citation10]. One unit of enzyme activity was defined as the amount of enzyme that converts 1 µmol of α-isopropyl maleate per min under the assay conditions.

Scanning electron microscopy (SEM) analysis of C. glutamicum CP

Samples of fermentations with or without ultrasonic treatment were centrifuged at 8000 × g for 10 min, the cell pellet was washed with a 0.85% NaCl solution three times, and the cells fixed in 4% glutaraldehyde solution for 3 h. The fixed cells were rinsed with 0.85% NaCl solution three times and further dehydrated using 50%, 70%, 90%, 95%, and 100% ethanol. Finally, the samples were dried at 37°C for 3 h, placed on sample stubs with conductive carbon tape, and sputter-coated with gold before microscopy using a JSM-5800LV SEM (JEOL, Japan) with a 10 kV beam.

Measurement of cell membrane permeability

The LIVE/DEAD® BacLightTM Bacterial Viability Kit L7012 (Thermo Fisher, USA) was used to assess membrane permeability. The kit consisted of SYTO 9 dye and propidium iodide (PI), which both stain nucleic acids. SYTO 9 stains live cells with intact membranes, and those with damaged membranes in green, while PI penetrates only cells with damaged membranes, causing a reduction in the SYTO 9 fluorescence when both dyes are present. Prior to analysis, cells from the stationary phase were washed three times with 0.85% NaCl and resuspended in 0.85% NaCl solution. Equal volumes of dye mixture were added to the bacterial suspension, mixed thoroughly and incubated at room temperature in the dark for 15 min. Stained cells were quantified using a BX53 fluorescence microscope (Olympus, Japan).

Statistical analysis

The mean responses were fitted to a second-order polynomial using Design Expert 8.0.6 software to obtain regression equations, which were validated by calculating the coefficient of multiple determinations (R2). The statistical significance of the model was assessed using analysis of variance (ANOVA). All the experiments were performed in triplicate and the results were analyzed using SPSS software (IBM Corp., USA). The normality of data was tested using the Shapiro–Wilk test, and homogeneity of variances using Levene’s test. The statistical significance of differences was calculated using Duncan’s post hoc test, with P < 0.05 as the threshold.

Results and discussion

Ultrasound is a versatile technology that can be used in conjunction with the fermentation process to increase the process efficiency and production rate by improving cell permeability and enzyme activity. We optimized the ultrasonic parameters, which significantly increased the biomass and the production of L-leucine. Furthermore, we investigated the differences in cell morphology, cell membrane permeability, and enzyme activity with ultrasound treatment.

Effect of ultrasonic treatment in different growth phases on the biomass of C. glutamicum CP

The growth curve of C. glutamicum CP is shown in as baseline data for the identification of different growth phase. The cells were in the lag phase for the first 4 h, in the exponential phase from 4 h to 20 h, and entered the stationary phase after 20 h of culture. C. glutamicum CP was subjected to ultrasonic treatment at 2, 4, 8, 16, 20, and 24 h. The effects of ultrasound treatment on the different growth stages of C. glutamicum CP are shown in . At the beginning of the lag phase and exponential phase, there was a significant increase in biomass, and at 8 h, the growth of ultrasonically treated C. glutamicum CP increased by 15.6% compared to the control. However, ultrasound treatment in the late exponential and stationary phase resulted in a significant decrease of biomass. Ultrasound has a dual effect on microbes; a lethal effect or growth stimulation. The positive impacts on the cells growth are that increase the activity of enzymes and the mass transfer rate of the nutriment, while negative aspects include shear forces and free radicals produced by ultrasound [Citation32]. Different growth stages of cells have different tolerance to ultrasound. As a result, ultrasonic treatment in the exponential phase at 8 h was selected for following experiments.

Figure 1. Effect of ultrasound treatment on the growth of C. glutamicum CP in different phases. (a): The growth curve of C. glutamicum CP; (b): biomass increase of C. glutamicum CP treated with ultrasound at different incubation times. Different letters indicate significant differences (P < 0.05)

Figure 1. Effect of ultrasound treatment on the growth of C. glutamicum CP in different phases. (a): The growth curve of C. glutamicum CP; (b): biomass increase of C. glutamicum CP treated with ultrasound at different incubation times. Different letters indicate significant differences (P < 0.05)

Effect of ultrasound parameters on the growth of C. glutamicum CP

Different powers and frequencies ultrasound generate either stable or transient liquid cavitation in liquid medium. Transient cavitation occurs at low frequencies of 20–100 kHz, while high frequencies over 200 kHz induce stable cavitation, resulting in thousands of oscillation cycles between high and low acoustic pressure [Citation20,Citation33]. To improve the biomass accumulation, single-factor experiments were carried out and the effects of different ultrasonication parameters on the growth of C. glutamicum CP were investigated, as shown in . Various ultrasonic power densities (50, 100, 150, 200, and 250 W/L) were investigated (). All tested power densities enhanced the biomass to some degree, except for the highest setting of 250 W/L. At ultrasonic power densities of 50 and 150 W/L, there was no significant difference in biomass accumulation. The biomass reached a maximum with an increase of 21.5% over the control under an ultrasonic power density of 100 W/L. This indicates that lower ultrasonic power densities can stimulate the growth of C. glutamicum CP whereas over-stimulation with intensified ultrasound might result in cell damage. Thus, an ultrasonic power density of 100 W/L was used in the following experiments. Both too high and too low ultrasound frequencies had negative effects on the cell growth. Under ultrasonic stimulation at a frequency of 25 kHz, the biomass reached a maximum that was 17.5% higher than without ultrasonic treatment. Considering the high biomass, 25 kHz was the optimal frequency for ultrasound treatment in this study.

Figure 2. Effects of ultrasound treatment parameters on the growth of C. glutamicum CP. Biomass increase of C. glutamicum CP treated with the ultrasound at different power densities (a), frequencies (b), intervals (c), and durations (d). Letters indicate significant differences (P < 0.05)

Figure 2. Effects of ultrasound treatment parameters on the growth of C. glutamicum CP. Biomass increase of C. glutamicum CP treated with the ultrasound at different power densities (a), frequencies (b), intervals (c), and durations (d). Letters indicate significant differences (P < 0.05)

In addition to the power density and frequency, it is crucial to select an appropriate time of ultrasonic treatment, because serial sonication can easily cause irreversible damage to cells or even instruments [Citation34]. Several studies reported the influence of pulsed ultrasonic models on the growth of microorganisms. It was found that pulsing with an on time of 100 s and off time 10 s at 28 kHz and 100 W/L for 0.5 h led to the highest increase in the peptide content and viable cell count [Citation27]. Similarly, Ren et al. optimized the ultrasonic interval to improve the biomass and lipid accumulation of mixotrophic microalgae [Citation24]. In this study, the ultrasonic interval was also found to have a great influence on the growth of C. glutamicum CP. However, the biomass decreased significantly with shorter ultrasonic intervals. A maximal biomass increase of 12.7% was obtained with an ultrasonic interval of 30 min (). Furthermore, the increase of C. glutamicum CP biomass with ultrasound treatment reached the maximum with ultrasound treatment for 40 s ().

Modeling the effect of ultrasound treatment L-leucine production

The modeling results for L-leucine production are shown in Table S2. The R2 value, P value, and F value was calculated to evaluate the mutual interactions between the dependent and independent variables (Table S3). The data were in good agreement with a second-order polynomial model (Eq. (1)), with an R2 value of 0.9747, which suggested that the model could be used to optimize the ultrasonic treatment conditions for improved L-leucine fermentation. The model was highly significant (P < 0.01), and the lack of fit indicated a good correlation with the model data (P < 0.05). Furthermore, the rather low coefficient of variance (CV< 10%), indicated low dispersion degree of the data in the model. This further supports the good fit of the model, and thus, indicates good reproducibility. The second-order polynomial Eq. (2) describes the relationship between ultrasonic power density (A), frequency (B), interval (C), and duration (D). E represents scientific notation (E).

Y = −526.26592 + 0.80385A + 27.23841B + 4.79884 C + 5.99755D – 0.012437AB + 0.012781AC – 1.94466E – 003AD – 0.070948BC – 0.036414BD – 9.12218E – 003 CD – 4.37387E – 003A2 – 0.43179B2 – 0.060933C2 – 0.060604D2 (2)

Optimization of ultrasonic treatment conditions by RSM analysis

In this study, the four independent variables showed a linear effect on the production of L-leucine under ultrasonic treatment, according to the regression analysis. As shown in Table S3, L-leucine was significantly affected by ultrasonic power density, frequency, interval, and duration (P < 0.01 in all cases). The interactions of power density versus frequency, power density versus interval, and frequency versus interval were statistically significant (P < 0.05), while the interactions of power density versus duration, frequency versus duration, and interval versus duration were not significant (P > 0.05). The L-leucine titers reached their highest level close to the midpoint of the response plot. The influence of these four variables on L-leucine production was further analyzed using three-dimensional plots (graphical representations of the regression model, ). The shape of the response surface curves indicated a moderate interaction between the assigned variables. The interactions between any two factors can be understood intuitively using response surface plots, and it is also convenient to locate their optimal levels. The L-leucine titer was observed as a response variable in the interaction between the ultrasonic power density and frequency, while the two other parameters were at central values. Furthermore, the L-leucine titer at an optimal value of ultrasonic power density and frequency could be calculated. L-leucine production was enhanced at the ultrasonic power density and frequency of intermediate levels (). The same course of the remaining factors (–F) indicated that the optimal value of each parameter could be obtained.

Figure 3. Response surface plot for interactions between four independent variables affecting L-leucine production. The titer of L-leucine was observed as a response variable for the interaction of two independent variables. The other parameters were at central points. Two variables were plotted against each other in each panel

Figure 3. Response surface plot for interactions between four independent variables affecting L-leucine production. The titer of L-leucine was observed as a response variable for the interaction of two independent variables. The other parameters were at central points. Two variables were plotted against each other in each panel

The optimal conditions for L-leucine production were obtained by applying the prediction profiler model with the following data: ultrasonic power density of 94.00 W/L, frequency of 25.47 kHz, interval of 31.13 min, and duration of 37.04 s. Under the optimal ultrasonic treatment conditions, the maximal predicted L-leucine titer was 53.36 g/L. Validation experiments were performed in triplicate. The ultrasound treatment under the optimized conditions started at 8 h of fed-batch fermentation. The experimental conditions encompassed an ultrasonic power density of 94.00 W/L, ultrasonic frequency of 25 kHz, ultrasonication interval of 31 min, and duration of 37 s. The biomass and L-leucine concentrations in the ultrasonic experiments were significantly higher than in the control (). The L-leucine titer was 52.89 g/L, which was about 21% higher than in the control (43.5 g/L), and was similar to its predicted value (53.36 g/L) according to the equation. The errors between the predicted and experimental values were < 2%. Thus, the regression models obtained by RSM could predict L-leucine production by any combination of independent sonication variables.

Figure 4. Time profiles of biomass (a), glucose (b), and L-leucine (c) concentrations in fed-batch fermentation of C. glutamicum CP with and without ultrasonic treatment. All fermentation experiments were performed in three independent replicates (n = 3)

Figure 4. Time profiles of biomass (a), glucose (b), and L-leucine (c) concentrations in fed-batch fermentation of C. glutamicum CP with and without ultrasonic treatment. All fermentation experiments were performed in three independent replicates (n = 3)

The yield of L-leucine from glucose under ultrasound treatment was 0.30 mol/mol, and the productivity was 1.2 g/L/h. These values represent 8.2% and 14.2% increases over the control, respectively. Therefore, low-level ultrasound treatment can improve the fermentation profile and productivity of L-leucine by increasing the viability, enzyme activity, and membrane permeability of microbial cells. Therefore, ultrasound can be applied to L-leucine production if optimal ultrasonication parameters are carefully determined before applying sonication.

Effects of ultrasonic treatment on the cell morphology of C. glutamicum CP

SEM is widely used to assess the surface characteristics, morphology, and ultrastructure of microorganisms. We examined the effects of ultrasonic treatment on the cell morphology by SEM. The C. glutamicum CP cells showed a typical asymmetric rod shape, and V-shaped cell pairs were observed frequently (). However, there were more irregular, elongated, and swollen cells in the ultrasonicated culture than in the control. After low-level ultrasonic treatment, C. glutamicum CP can survive and maintain the integrity of its cell structure. C. glutamicum CP, a Gram-positive bacterium, was more resistant to low-level ultrasound due to its cell wall characteristics. Though the positive effect of low intensity ultrasound was reported [Citation20], ultrasound had a certain damage effect on cell wall. Fortunately, ultrasound was not continuous, which enabled cells to repair these damages in the ultrasonic interval, maintained a complete cell morphology, and avoided death. SEM images of untreated and ultrasonically treated cultures can provide insights into the growth and metabolism of C. glutamicum CP.

Figure 5. Electron microscopic observation of the cell morphology of C. glutamicum CP with/without ultrasonic treatment. (a–b): control cells; (c–d): ultrasound treated cells

Figure 5. Electron microscopic observation of the cell morphology of C. glutamicum CP with/without ultrasonic treatment. (a–b): control cells; (c–d): ultrasound treated cells

Effect of ultrasonic treatment on cell permeability

The cell membrane separates the cytoplasm from the environment and plays an important role in reproduction, energy transfer, and metabolism [Citation35]. To determine whether ultrasonic treatment affects the integrity of the C. glutamicum CP cell membrane, a viability stain was used in conjunction with fluorescence microscopy. When double-stained with PI and SYTO 9, cells with intact membranes show green fluorescence, while damaged membranes allow the influx of PI, leading to red fluorescence [Citation36]. As shown in , the number of cells that emitted a green fluorescence was reduced under ultrasound compared with the untreated controls, while the number of cells emitting red fluorescence increased. This indicated that the C. glutamicum CP cell membrane was damaged to some extent under ultrasound treatment, which may have improved L-leucine production by enhancing nutrient transport. Increased membrane permeability also leads to intracellular efflux of L-leucine, which mitigates transcriptional attenuation of key genes and feedback inhibition of key enzymes in the L-leucine biosynthesis pathway. This is one of the reasons for the increased production of L-leucine by ultrasound. Additionally, stable microbubble oscillations can also lead to the production of H2O2 and other reactive oxygen species, which cause lipid and membrane proteins peroxidation. It was suggested that lipid and membrane proteins peroxidation might be one of the reasons increasing membrane permeability. Another possible reason for the enhancement of membrane permeability is acoustic cavitation, which is directly responsible for the mechanical effects of ultrasound treatment [Citation37]. Ultrasound can increase the permeability of cell membrane both physically and chemically.

Figure 6. Fluorescence microscopy of C. glutamicum CP cells with/without ultrasound treatment. The cells exhibiting green fluorescence have an intact membrane, while cells with a permeabilized membrane exhibit red fluorescence. (a–b): control cells; (c–d): ultrasound treated cells

Figure 6. Fluorescence microscopy of C. glutamicum CP cells with/without ultrasound treatment. The cells exhibiting green fluorescence have an intact membrane, while cells with a permeabilized membrane exhibit red fluorescence. (a–b): control cells; (c–d): ultrasound treated cells

Effects of ultrasonic treatment on the activity of key enzymes

AHAS, IPMS, and IPMD are key enzymes in the bacterial L-leucine biosynthesis pathway. In C. glutamicum, only one AHAS is encoded by the ilvBN gene. The leuA gene encodes IPMS, and the leuCD genes encode IPMD [Citation38]. C. glutamicum CP cells from the stationary phase of the fed-batch cultures were collected to study the effects of ultrasonic treatment on enzyme activity, as shown in . The relative activity of AHAS was not significantly different between the ultrasonically treated culture and the control. However, the relative activity of IPMS and IPMD under ultrasonication significantly increased by 8.9% and 18.2% compared to the control, respectively. Cavitation generated by ultrasound can lead to conformational changes of enzymes, which can improve the contact between the enzyme and substrate, which in turn can increase the enzyme activity [Citation16,Citation20,Citation39,Citation40]. Moreover, ultrasound treatment can improve the solubility and dispersion of recalcitrant substrates, greatly improving their degradation and utilization. For example, when L. acidophilus BCRC 10695 was treated with ultrasound (20 kHz, amplitude at 20%) during the stationary phase, the β-glucosidase activity was enhanced to 3.91 U/mL, which was 82% times higher than without ultrasound treatment [Citation41]. Thus, the improvement of enzyme activity observed in this study was in agreement with the literature, and can explain at least a part of the improved L-leucine production under ultrasound treatment.

Figure 7. Relative activity of AHAS, IPMS, and IPMD in cells from the stationary phase with and without ultrasound treatment. The enzyme activities in the control were set 100%. The data represent the means ± standard deviations from three independent experiments. *P ≤ 0.05, **P ≤ 0.01, ***P ≤ 0.001。

Figure 7. Relative activity of AHAS, IPMS, and IPMD in cells from the stationary phase with and without ultrasound treatment. The enzyme activities in the control were set 100%. The data represent the means ± standard deviations from three independent experiments. *P ≤ 0.05, **P ≤ 0.01, ***P ≤ 0.001。

Conclusions

In this study, four factors of ultrasound treatment, including the power density, frequency, interval, and duration, were optimized to improve the biomass and the production of L-leucine by C. glutamicum CP in fed-batch culture. Moreover, the yield and productivity of L-leucine were significantly improved. The enhancement of L-leucine production was attributed to intense micro-mixing induced by sonication, which has several possible effects on cell morphology, cell membrane permeability, and enzyme activity. This is a successful case of process intensification using ultrasound, and is the first report of ultrasound-assisted L-leucine production. Furthermore, we consider that the ultrasound effect of L-leucine producing strain C. glutamicum CP in fed-batch culture should be further studied by various omics.

Highlights

The optimal combination of ultrasonic parameters was determined by RMS.

The yield and productivity of L-leucine were improved with ultrasound treatment.

The permeability of cell membrane and the activities of key enzymes were significantly improved by ultrasound.

Author contributions

YZ, QX and NC designed the research; YZ, ZC, and PS performed the experiments; ZC and PS analyzed the data; YZ and QX wrote the paper. All authors approved the final version of the manuscript.

Supplemental material

Supplemental Material

Download ()

Supplementary material

Supplemental data for this article can be accessed here.

Disclosure statement

No potential conflict of interest was reported by the authors.

Additional information

Funding

This work was financially supported by the National Key Research and Development Program of China (Grant. 2018YFA0900300) and the Tianjin Synthetic Biotechnology Innovation Capacity Improvement Project (Grant. TSBICIP-KJGG-005).

References

  • Wu G. Amino acids: metabolism, functions, and nutrition. Amino Acids. 2009;37:1–17.
  • Yao K, Duan YH, Li FN, et al. Leucine in Obesity: therapeutic Prospects. Trends Pharmacol Sci. 2016;37(8):714–727. .
  • Ikeda T, Morotomi N, Kamono A, et al. The Effects of Timing of a Leucine-Enriched Amino Acid Supplement on Body Composition and Physical Function in Stroke Patients: a Randomized Controlled Trial. Nutrients. 2020;12(7):9. .
  • Yamamoto K, Tsuchisaka A, Yukawa H. Branched-Chain Amino Acids. Adv. Biochem Eng Biotechnol. 2016;159:103–128.
  • Wendisch VF, Bott M, Eikmanns BJ. Metabolic engineering of Escherichia coli and Corynebacterium glutamicum for biotechnological production of organic acids and amino acids. Curr Opin Microbiol. 2006;9:268–274.
  • Zahoor A, Lindner SN, Wendisch VF. Metabolic engineering of Escherichia coli and Corynebacterium glutamicum for biotechnological production of organic acids and amino acids. Comput Struct Biotechnol J. 2012;3:1–11.
  • Park JH, Lee KH, Kim TY, et al. Metabolic engineering of Escherichia coli for the production of L-valine based on transcriptome analysis and in silico gene knockout simulation. Proc Natl Acad Sci U S A. 2007;104:7797–7802.
  • Cho JS, Choi KR, Prabowo CPS, et al. CRISPR/Cas9-coupled recombineering for metabolic engineering of Corynebacterium glutamicum. Metab Eng. 2017;42:157–167.
  • Li Y, Wei H, Wang T, et al. Current status on metabolic engineering for the production of l-aspartate family amino acids and derivatives. Bioresour Technol. 2017;245:1588–1602.
  • Vogt M, Haas S, Klaffl S, et al. Pushing product formation to its limit: metabolic engineering of Corynebacterium glutamicum for L-leucine overproduction. Metab Eng. 2014;22:40–52.
  • Wang -Y-Y, Zhang F, Xu J-Z, et al. Improvement of l-Leucine Production in Corynebacterium glutamicum by Altering the Redox Flux. Int J Mol Sci. 2019;20:14.
  • Wang -Y-Y, Shi K, Chen P, et al. Rational modification of the carbon metabolism of Corynebacterium glutamicum to enhance l-leucine production. J Ind Microbiol Biotechnol. 2020;47:485–495.
  • Kentish S, Feng H. Applications of Power Ultrasound in Food Processing. In: Doyle MP, Klaenhammer TR, editors. Annual Review of Food Science and Technology. Vol. 5. Palo Alto: Annual Reviews; 2014. p. 263–284.
  • Chemat F, Zill EH, Khan MK. Applications of ultrasound in food technology: processing, preservation and extraction. Ultrason Sonochem. 2011;18:813–835.
  • Bevilacqua A, Campaniello D, Speranza B, et al. Two Nonthermal Technologies for Food Safety and Quality-Ultrasound and High Pressure Homogenization: effects on Microorganisms, Advances, and Possibilities: a Review. J Food Prot. 2019;82:2049–2064.
  • Huang GP, Chen SW, Dai CH, et al. Effects of ultrasound on microbial growth and enzyme activity. Ultrason Sonochem. 2017;37:144–149.
  • Dahroud BD, Mokarram RR, Khiabani MS, et al. Low intensity ultrasound increases the fermentation efficiency of Lactobacillus casei subsp.casei ATTC 39392. Int J Biol Macromol. 2016;86:462–467.
  • Bevilacqua A, Racioppo A, Sinigaglia M, et al. A low-power ultrasound attenuation improves the stability of biofilm and hydrophobicity of Propionibacterium freudenreichii subsp freudenreichii DSM 20271 and Acidipropionibacterium jensenii DSM 20535. Food Microbiol. 2019;78:104–109.
  • Erriu M, Blus C, Szmukler-Moncler S, et al. Microbial biofilm modulation by ultrasound: current concepts and controversies. Ultrason Sonochem. 2014;21:15–22.
  • Akdeniz V, Akalin AS. Recent advances in dual effect of power ultrasound to microorganisms in dairy industry: activation or inactivation. Crit Rev Food Sci Nutr. 2020;1–16. DOI:10.1080/10408398.2020.1830027
  • Ojha KS, Mason TJ, O’Donnell CP, et al. Ultrasound technology for food fermentation applications. Ultrason Sonochem. 2017;34:410–417.
  • Borah AJ, Roy K, Goyal A, et al. Mechanistic investigations in biobutanol synthesis via ultrasound-assisted ABE fermentation using mixed feedstock of invasive weeds. Bioresour Technol. 2019;272:389–397.
  • Yang Y, Xiang J, Zhang Z, et al. Stimulation of in situ low intensity ultrasound on batch fermentation of Saccharomyces cerevisiae to enhance the GSH yield. J Food Process Eng. 2020;43:e13489.
  • Ren HY, Xiao RN, Kong FY, et al. Enhanced biomass and lipid accumulation of mixotrophic microalgae by using low-strength ultrasonic stimulation. Bioresour Technol. 2019;272:606–610.
  • Ma Y, Chen Q, Cui Y, et al. Comparative Genomic and Genetic Functional Analysis of Industrial L-Leucine-and L-Valine-Producing Corynebacterium glutamicum Strains. J Microbiol Biotechnol. 2018;28:1916–1927.
  • Gui Y, Ma Y, Xu Q, et al. Complete genome sequence of Corynebacterium glutamicum CP, a Chinese L-leucine producing strain. J Biotechnol. 2016;220:64–65.
  • Huang GP, Chen SW, Tang YX, et al. Stimulation of low intensity ultrasound on fermentation of skim milk medium for yield of yoghurt peptides by Lactobacillus paracasei. Ultrason Sonochem. 2019;51:315–324.
  • John I, Pola J, Appusamy A. Optimization of Ultrasonic Assisted Saccharification of Sweet Lime Peel for Bioethanol Production Using Box-Behnken Method. Waste Biomass Valori. 2019;10:441–453.
  • He B, Zhang LL, Yue XY, et al. Optimization of Ultrasound-Assisted Extraction of phenolic compounds and anthocyanins from blueberry (Vaccinium ashei) wine pomace. Food Chem. 2016;204:70–76.
  • Ruan S, Luo J, Li Y, et al. Ultrasound-assisted liquid-state fermentation of soybean meal with Bacillus subtilis: effects on peptides content, ACE inhibitory activity and biomass. Process Biochem. 2020;91:73–82.
  • Choi KJ, Yu YG, Hahn HG, et al. Characterization of acetohydroxyacid synthase from Mycobacterium tuberculosis and the identification of its new inhibitor from the screening of a chemical library. FEBS Lett. 2005;579:4903–4910.
  • O’Donnell CP, Tiwari BK, Bourke P, et al. Effect of ultrasonic processing on food enzymes of industrial importance. Trends Food Sci Tech. 2010;21: 358–367.
  • Ashokkumar M, Bhaskaracharya R, Kentish S, et al. The ultrasonic processing of dairy products - An overview. Dairy Sci Technol. 2010;90: 147–168.
  • Joyce EM, King PM, Mason TJ. The effect of ultrasound on the growth and viability of microalgae cells. J Appl Phycol. 2014;26:1741–1748.
  • Li B, Tian F, Liu X, et al. Effects of cryoprotectants on viability of Lactobacillus reuteri CICC6226. Appl Microbiol Biotechnol. 2011;92:609–616.
  • Shokri S, Shekarforoush SS, Hosseinzadeh S. Efficacy of low intensity ultrasound on fermentative activity intensification and growth kinetic of Leuconostoc mesenteroides. Chem Eng Process. 2020;153:107955.
  • Wu J, Nyborg WL. Ultrasound, cavitation bubbles and their interaction with cells. Adv Drug Deliv Rev. 2008;60:1103–1116.
  • Franco TMA, Blanchard JS. Bacterial Branched-Chain Amino Acid Biosynthesis: structures, Mechanisms, and Drugability. Biochemistry. 2017;56(44):5849–5865.
  • Abesinghe AMNL, Islam N, Vidanarachchi JK, et al. Effects of ultrasound on the fermentation profile of fermented milk products incorporated with lactic acid bacteria. Int Dairy J. 2019;90:1–14.
  • Subhedar PB, Gogate PR. Enhancing the activity of cellulase enzyme using ultrasonic irradiations. J Mol Catalysis B Enzymatic. 2014;101: 108–114.
  • Liu WS, Yang CY, Fang TJ. Strategic ultrasound-induced stress response of lactic acid bacteria on enhancement of beta-glucosidase activity for bioconversion of isoflavones in soymilk. J Microbiol Methods. 2018;148:145–150.