
ABSTRACT
Tumor microenvironment (TME) is involved in the occurrence and development of hepatocellular carcinoma (HCC), and immune cells in the TME have been implicated in its progression and treatment. However, the association of genes involved in the TME with HCC prognosis remains unclear. Thus, in this study, we obtained transcriptomic and clinicopathological data of patients with HCC from The Cancer Genome Atlas to identify key genes in TME associated with HCC prognosis. Stromal and immune cell scores were calculated using the ESTIMATE method, and differentially expressed genes (DEGs) were determined. We identified 830 DEGs, which were further subjected to survival analyses and functional enrichment analysis. Next, we identified prognostic TME-associated DEGs, established a protein-protein interaction (PPI) network, and performed Cox analysis.Consequently, four key prognostic genes (CXCL5, CXCL8, IL18RAP, and TREM2) associated with TME, were identified, in which CXCL5 and IL18RAP may be potential independent prognostic factors. Age, clinical stage, N stage, and risk score were also determined as significant prognostic variables. CIBERSORT was used to predict the constitution and relative content of the immune cells, wherein M0 macrophages were the most closely related to the key genes. In conclusion, CXCL5, CXCL8, IL18RAP, and TREM2 were associated with HCC prognosis and were important for immune cell invasion into the TME. Additionally, IL18RAP expression may contribute toward favorable prognosis in patients with HCC. Consequently, these genes may serve as potential biomarkers and immunotherapeutic targets for HCC.
Graphical abstract
1. Introduction
Hepatocellular carcinoma (HCC) is the most common type of primary liver cancer. The incidence of HCC is increasing worldwide, and it is now the second leading cause of cancer-related deaths[Citation1]. The early symptoms of HCC are not obvious, and its specificity is poor. Therefore, it is difficult to diagnose early-stage HCC, which leads to advanced progression of liver cancer. The prognosis and survival of patients with advanced HCC are also poor[Citation1]. Although there are many treatment approaches for HCC, such as hepatectomy, radiofrequency ablation, and molecular targeted drugs, their effects are not ideal. At present, the emergence of immunotherapies for HCC provides hope as a new treatment modality[Citation2]. Therefore, it is crucial to identify HCC-related genes and determine their potential diagnostic and therapeutic implications as novel biological markers of the disease[Citation3].
The tumor microenvironment (TME) is involved in tumor progression. It has a complex composition, including different types of non-tumor cells and non-cell materials[Citation4]. Typically, the TME consists of stromal cells, immune cells, extracellular matrix components, and inflammatory mediators[Citation5]. The interaction of the TME with cancer cells exerts its influence during tumorigenesis and contributes to the biology of most cancers[Citation6]. Notably, stromal and immune cells, the two major non-neoplastic components of the TME, have significance in the diagnosis and prognosis of cancer[Citation7].
Yoshihara et al[Citation8]. proposed a new calculation method called ESTIMATE, wherein the algorithm estimates and obtains stromal and immune cell scores using cancer gene expression data. This score can then predict the infiltration levels of stromal and immune cells in the TME. At present, this new algorithm has been applied for studying many cancers, such as glioblastoma[Citation7], colon cancer[Citation9], clear cell renal cell cancer[Citation10], breast cancer[Citation11], prostate cancer[Citation12], and pancreatic cancer[Citation13].
Tumor-infiltrating immune cells (TIICs), another type of non-tumor cell in the TME, are also involved in tumor progression. As an indispensable component of the TME, TIICs are involved in the prognosis and treatment of many tumor types; for instance, the prognosis of patients with colorectal cancer is negatively correlated with neutrophils, M2 macrophages, and Tregs[Citation14]. CD8+ cells have a prognostic value in endometrial adenocarcinoma[Citation15], and CD4+ TIICs regulate the progression of renal cell carcinoma through the TGFβ1/YBX1/HIF2α signaling pathway[Citation16]. Further, increased M0 macrophages and Tregs are involved in poor prognosis in breast cancer[Citation17], upregulation of activated CD8+ T cells is involved in the prognosis of many cancers[Citation18], and T cells and B cells can alter the prognosis of patients with HCC by activating the immune response[Citation19]. Many studies have shown that TIICs constitute a system in the TME to regulate tumor progression, and thus have a potential prognostic significance in tumors[Citation20]. Although immunohistochemistry and flow cytometry have been used to show TIICs in TME, the function of all immune cells is yet to be systematically evaluated. CIBERSORT is a deconvolution algorithm that employs gene expression profiles to estimate the relative proportion and prognostic significance of 22 TIICs more comprehensively, quickly, and accurately[Citation21]. CIBERSORT has been used in studies related to gastric cancer[Citation21], breast cancer [Citation21–23], colorectal cancer[Citation24], osteosarcoma[Citation25], and lung cancer[Citation26].
In this study, we used data from The Cancer Genome Atlas (TCGA) to identify the key prognostic genes in the TME of HCC and constructed a prognostic model. The relationship between the key genes and immune cell infiltration in HCC has also been discussed.
2. Materials and methods
2.1 Downloading and collating TCGA data
Transcriptome and clinical information files of patients with HCC were downloaded from TCGA (http://portal.gdc.cancer.gov/repository; updated 18 December 2020), which included the transcriptomic data of 374 patients with HCC and 50 normal patients (gdc_download_20201218_095454.714640,gdc_manifest_20201218_095427, metadata.cart 2020–12-18) along with their corresponding pathological data (including age, sex, T phase, N phase, M phase, survival time, and survival state). As all data were acquired from public databases, there was no requirement for an ethical approval of this study.
2.2 Evaluation of stromal score and immune score
‘ESTIMATE’ and ‘limma’ packages[Citation27] were used to obtain the immune and stromal scores for each HCC sample using the ESTIMATE method. The scores were categorized into high score and low score groups based on the median value of the scores.
2.3 Screening of differentially expressed genes (DEGs)
‘Limma’ package in R (version 4.0.2) was used to determine the DEGs between the high score and low score groups. The filter criteria were set as |log2FC| ≥ 1 and false discovery rate (FDR) < 0.05. A Venn diagram was used to screen the upregulated and downregulated genes from the two scoring groups. In addition, the ‘pheatmap’ package was used to generate heatmaps[Citation28].
2.4. Functional analysis of the DEGs
To determine the biological roles of the DEGs, their functional analysis was performed using gene ontology (GO) and Kyoto Encyclopedia of Genes and Genomes (KEGG). The following R packages were used to implement the enrichment analyses: ‘clusterprofiler,’ ‘theorg.Hs.eg.db,’ ‘enrichplot,’ and ‘ggplot2.’ The enriched GO terms included molecular function (MF), biological process (BP), and cellular component (CC). KEGG analysis was used to explore the significant pathways related to the DEGs. An FDR < 0.05 was used to select the significance criteria of rich terms.
2.5 Batch overall survival analysis
The relationship between prognosis and gene expression was determined using a Kaplan-Meier plot. According to the median value of each gene, they were categorized into either a high expression group or a low expression group. Survival analysis was implemented using the R ‘survival’ package. Significance was set at P < 0.05.
2.6 Constructing a protein-protein interaction (PPI) network of the DEGs to determine the prognostic value
To investigate the interactions between the identified DEGs in the HCC samples, STRING (https://string-db.org/) tools were used to plot a PPI network. STRING is an online database that is used to predict the relationships between proteins. Cytoscape software[Citation29] was used to visualize the PPI network more intuitively, and MCODE module (version2.0.0) was used to discover closely related regions in the PPI network.The selection criteria of MCODE module are as follows: Dgree Cutoff is 2, Node Score Cutoff is 0.2, K-Core is 2, and Max. Depth is 100.
2.7 Construction of models to identify the key genes
First, we integrated the clinical data downloaded from TCGA with the prognostic gene data and performed a single-factor Cox regression analysis on the processed data to analyze the impact of the clinicopathological variables on overall survival (OS). Significant results from the univariate Cox analysis were then used in a multivariate Cox analysis, and key DEGs associated with HCC prognosis were identified. Next, the identified key genes were used to calculate risk scores. A receiver operating characteristic (ROC) curve was plotted and used to validate the dependability of this model for calculating the OS of patients with HCC. The relationship between the DEGs and OS was described using a Kaplan-Meier plot. Significance was set at P < 0.05.
2.8 Gene set enrichment analysis (GSEA)
To further identify the potential functional pathways affecting the high-and low-risk (based on the overall survival rate) patients with HCC, GSEA software was used to perform the enrichment analysis[Citation30]. The ‘C2 KEGG’ gene set was used in the GSEA to obtain the corresponding upregulated and downregulated pathways. The significance threshold was set at P < 0.05.
2.9 Determining immune cell infiltration
CIBERSORT (https://cibersort.stanford.edu/about.php) algorithm was used to investigate the TIICs in the TME of HCC. CIBERSORT is a gene transcription file-based analysis tool that estimates the content of 22 immune cells in a tumor sample. Here, we calculated the profiles of these cells in the HCC samples. Based on the results of immunocyte infiltration, we performed immunocyte differential analysis and immunocyte correlation tests (between 22 immune cells and key prognostic genes) on the key prognostic genes using the ‘limma’ package in R and Spearman’s test, respectively. A Venn diagram was used to screen the immune cells related to each key gene from the abovementioned analyses. P < 0.05 was set as the filter for the analyses.
2.10 Determining the expression of the key genes
Differential expression analysis of the key genes in HCC was performed using Wilcoxon test. Clinical correlation analysis was performed using the R ‘ggpubr’ package. The protein expression levels of the key genes between the HCC and normal tissues were obtained from the Human Protein Atlas (HPA; https://www.proteinatlas.org/). HPA provides a protein histological atlas of both the normal and cancerous tissues.
2.11 Statistical analysis
ESTIMATE algorithm, survival analysis, function enrichment, Cox analysis, CIBERSORT algorithm, gene expression analysis, and clinical characteristic analysis were all implemented using R (version 4.0.2) packages. Mann-Whitney U test or Wilcoxon signed-rank test were used to identify the key gene expression profiles. Significance criterion was set as P < 0.05.
3. Results
In this study, we use the ESTIMADE method to identify the edge related to TME and analyze its function. In order to identify key prognostic genes and study the role of key genes in predicting OS, we constructed a prediction model. Then, based on cibersort algorithm, the classification and abundance of tiics in TME are studied, the relationship between key genes and immune landscape is discussed, and the immune cells with strong correlation with key genes are found.
3.1 Correlation of ESTIMATE results with OS and clinical characteristics
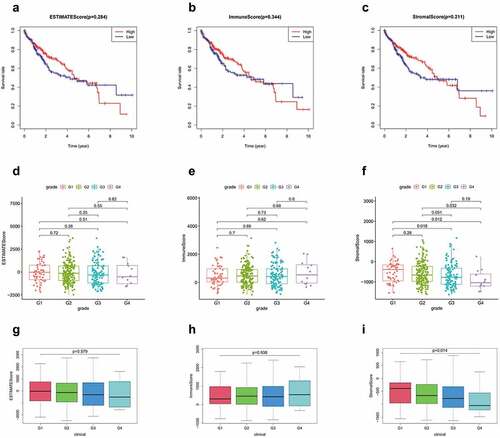
A total of 374 patients with HCC were included in this study. The stomal, immune, and ESTIMATE scores of all tumor samples were estimated, and the stomal score interval was −1625.416209–1170.968429, immune score interval was −866.4496225–3145.797582, and ESTIMATE score interval was −2473.0130139735–3703.87503517354. Based on the scoring results, we categorized the patients into high and low score groups and analyzed the correlation between these groups and the clinicopathological results. Kaplan-Meier results showed no significant difference in the OS rates between the high immune score group and low immune score group. No significant difference was observed between the stromal and imputed score groups as well (). Clinical grade showed a negative correlation with the stromal score (P = 0.014; ), but positive/no correlation with immune score (P = 0.938, ) and ESTIMATE score (P = 0.579; )
Figure 1. (a-c) Kaplan-Meier curves of ESTIMATE score, immune score, and stromal score with respect to the overall survival time. correlation between clinical features and stromal, immune, and ESTIMATE scores. (d, g) correlation between ESTIMATE score and clinical grade. (e, h) correlation between immune score and clinical grade. (f, i) correlation between stromal score and grade
3.2 Identification of the DEGs
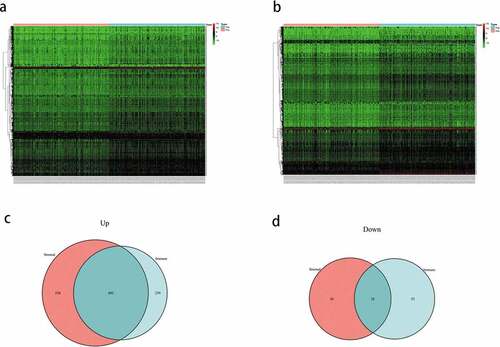
To identify the DEGs, the gene expression levels in the immune and stromal groups were calculated. After analyzing the immune scores, we observed that 1041 genes were upregulated and 81 genes were downregulated; whereas, while analyzing the stromal scores, 1338 genes were upregulated and 84 genes were downregulated. The expression profiles of the upregulated genes are displayed as a heatmap (), and the Venn diagram shows the common DEGs of the immune and stromal score groups. Finally, 802 DEGs were screened, including 802 upregulated and 28 downregulated genes ().
Figure 2. (a) Heatmap of the expression of the differentially expressed genes (DEGs) grouped by the stomal score. (b) heatmap of the expression of the DEGs grouped by immune score. (c) venn diagram of the upregulated genes common between the immune score and stomal score groups. (d) venn diagram of the downregulated genes common between the immune score and stomal score groups
3.3 GO and KEGG pathway enrichment analyses
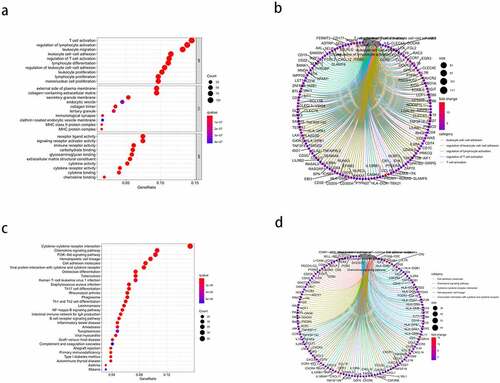
Enrichment analysis was performed for all 830 DEGs. GO analysis ()) revealed 1359 BPs, 67 CCs, and 96 MFs (FDR < 0.05). The top five enriched BP terms were: ‘T cell activation,’ ‘regulation of lymphocyte activation,’ ‘leukocyte migration,’ ‘leukocyte cell-cell adhesion,’ and ‘regulation of T cell activation’; the top five enriched CC terms were: ‘external side of plasma membrane,’ ‘collagen-containing extracellular matrix,’ ‘secretory granule membrane,’ ‘endocytic vesicle,’ and ‘collagen trimer’; and the top five MF terms were: ‘receptor ligand activity,’ ‘signaling receptor activator activity,’ ‘immune receptor activity,’ ‘carbohydrate binding,’ and ‘glycosaminoglycan binding.’ The results of the Circos plots ()) showed that the DEGs were mainly associated with ‘leukocyte cell-cell adhesion,’ ‘regulation of leukocyte cell-cell adhesion,’ ‘regulation of lymphocyte activation,’ ‘regulation of T cell activation,’ and ‘T cell activation.’ KEGG pathway enrichment results ()) showed that the DEGs were significantly associated with ‘cytokine-cytokine receptor interaction,’ ‘chemokine signaling pathway,’ ‘PI3K-Akt signaling pathway,’ ‘hematopoietic cell lineage,’ and ‘cell adhesion molecules.’ Meanwhile, the Circos plots for the pathways ()) revealed that the DEGs were closely related to ‘cell adhesion molecules,’ ‘chemokine signaling pathway,’ ‘cytokine-cytokine receptor interaction,’ ‘hematopoietic cell lineage,’ and ‘viral protein interaction with cytokine and cytokine receptor.’ Thus, the enrichment analysis results demonstrated that the DEGs exerted an influence on the TME of HCC. Further, the DEGs may also be involved in immune responses.
Figure 3. Gene ontology (GO) functional enrichment and Kyoto Encyclopedia of Genes and Genomes (KEGG) pathway analysis of the differentially expressed genes (DEGs). (a) the top 10 enriched biological processes (BP), cell components (CC), and molecular functions (MF) from the GO enrichment. (b) Circos plots show the primary relationship between the DEGs and GO enrichment terms. (c) the top 30-enrichment pathway terms from the KEGG pathway analysis. (d) Circos plots show the pathways in the KEGG pathway that were closely related to the DEGs
3.4 Correlation of the DEGs with prognosis
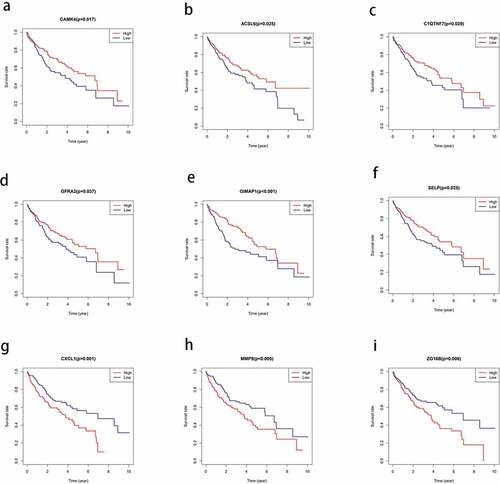
To investigate the correlation between the DEGs and OS in HCC, we constructed a Kaplan-Meier survival curve and performed a batch survival analysis of all 830 DEGs. Consequently, we found that 110 DEGs were associated with the OS (P < 0.05; ).
Figure 4. Correlation between the expression levels of the differentially expressed genes (DEGs) selected from The Cancer Genome Atlas (TCGA) and overall survival rate. the total survival time of the high expression group was compared with that of the low expression group using kaplan-meier survival curve (P < 0.05)
3.5 Construction of the PPI network of the prognostic DEGs
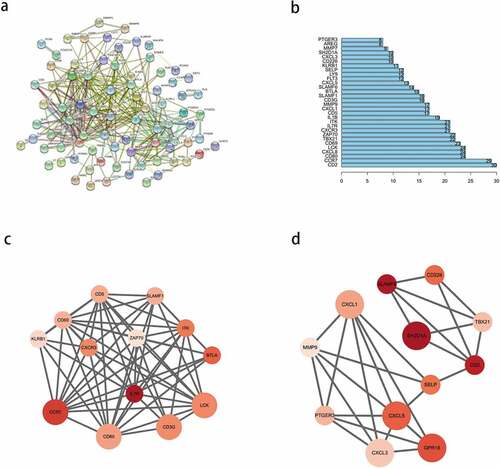
To explore the interactions between the identified prognostic DEGs, we mapped a PPI network using the STRING database and analyzed it using Cytoscape. After hiding the nodes disconnected from other genes in the network, we found that the network consisted of three modules ()). We selected the top 30 PPI network genes with close interactions as the ‘core genes’ ()), from which, the top 10 nodes were CD2, CCR7, CD80, CXCL8, LCK, CD69, TBX21, ZAP70, CXCR3, and IL7R. Then, we analyzed the most significant modules. As shown in ), module 1 had 13 nodes and 60 edges; whereas, module 2 had 12 nodes and 27 edges. In module 1 ()), CCR7, CD3G, CD80, and LCK had the highest degree of contact with other nodes and were more significant. In module 2 ()), CXCL1, CXCL5, GPR18, and SH2D1A had higher degrees.
Figure 5. Protein-protein interaction (PPI) network of prognostic differentially expressed genes (DEGs). (a) PPI network of the DEGs with interaction score greater than 0.4. (b) Interaction of the top 30 genes in the PPI network. (c, d) Two significant modules in PPI network analyzed by cytoscape software. the color of nodes in the PPI network reflects the logarithmic (FC) values of Z-score of gene expression, and the size of nodes represents the protein degree of PPI
3.6 Identifying four key prognostic genes from a DEG model
Univariate Cox analysis of 110 prognostic DEGs identified nine significant genes (P < 0.05; ), from which, four key genes were identified after the multivariate Cox analysis (). Among the many clinical variables, age, N stage, and risk score () were significant variables for the prognosis of HCC. Multivariate Cox analysis suggested that among the four genes, IL18RAP and CXCL5 were independent prognostic factors (P < 0.05). Next, we calculated the risk score using the following equation:
Table 1. 9 genes obtained by univariate Cox analysis
Table 2. 4 key genes selected by multivariate Cox analysis
Figure 6. Cox analysis of differentially expressed genes. (a) Univariate Cox analysis of clinical variables related to the prognosis of hepatocellular carcinoma (HCC). (b) Multivariate Cox analysis of clinical variables related to the prognosis of HCC. (c) Kaplan-meier curve of the survival time of the high-risk and low-risk groups. (d) one-year receiver operating characteristic (ROC) curve analysis. (e) three-year ROC curve analysis
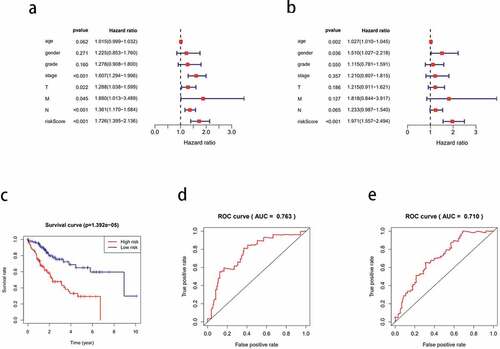
Risk score = (TREM2 × 0.1553) + (IL18RAP × −2.07225) + (CXCL5 × 0.1885) + (CXCL8 × 0.1210).
0.1553 is the coef value of TREM2, −2.07225 is the coef value of IL18RAP, 0.1885 is the coef value of CXCL5, 0.1210 is the coef value of CXCL8. The tumor samples were categorized into high-risk and low-risk groups, based on the differences in the risk score values. The high-risk group had a shorter survival time than the low-risk group (P < 0.001; )). The 1-year and 3-year ROC curves have an area under the curve (AUC) of 0.763 and 0.710, respectively ( respectively).
3.7 GSEA of the different risk groups
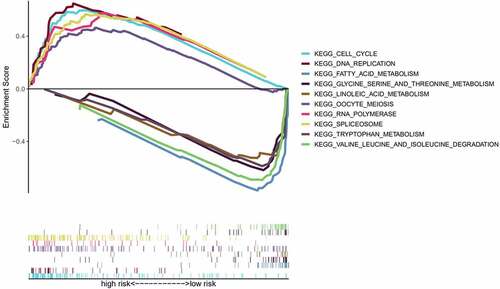
To further compare the significantly enriched pathways between the different risk groups, we conducted a GSEA. Enrichment results showed that the terms ‘cell cycle,’ ‘oocyte meiosis,’ ‘spliceosome,’ ‘RNA polymerase,’ and ‘DNA replication’ were significantly associated with the high-risk group, and these pathways were mainly associated with biosynthesis. In the low-risk group, ‘fatty acid metabolism,’ ‘valine, leucine, and isoleucine degradation,’ ‘linoleic acid metabolism,’ ‘tryptophan metabolism,’ and ‘glycine serine, and threonine metabolism’ were significantly enriched. The low-risk group was associated with major metabolic pathways ().
Figure 7. Gene set enrichment analysis (GSEA) to determine enriched pathways in the high- and low-risk groups
3.8 Infiltration of the immune cells in the TME
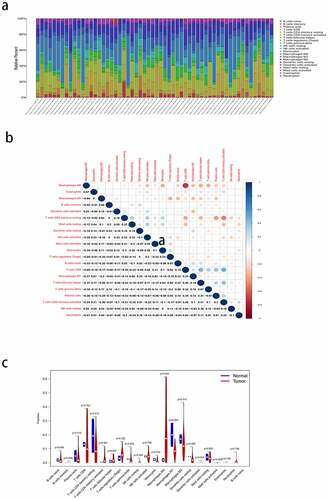
Immune infiltration in the HCC samples was calculated using CIBERSORT. Since there was no significant component of the CD4 progenitor cells in the tumor samples, they were excluded from this study. Bar graphs were used to show the relative content of 21 TIICs in the samples ()). The matrix diagram ()) shows the degree of correlation between the different TIICs: CD8 T cells had a positive correlation with memory activated CD4 T cells (Cor = 0.48), and CD8 T cells had a negative correlation with M0 macrophages (Cor = −0.69). The difference in immune cell infiltration between the HCC and normal tissues is shown via a violin plot ()). The highest infiltration fraction in the tumor tissues was by M0 macrophages, CD8 T cells, M2 macrophages, CD4 memory resting T cells, and M1 macrophages. The top five infiltrating cells in the normal tissues were CD4 memory resting T cells, M1 macrophages, M2 macrophages, CD8 T cells, and plasma cells. M0 macrophages (P < 0.05) were the most common TIICs in the tumors than in the normal tissues.
Figure 8. Analysis of immunocyte infiltration in the tumor microenvironment of hepatocellular carcinoma (HCC). (a) the bar plot shows the relative proportion of 21 types of tumor-infiltrating immune cells (TIICs) in each tumor sample. (b) the matrix shows the correlation between the 21 TIICs. (c) Violin plot shows the differences between the 21 types of immune cells in the HCC and normal tissues
3.9 Analysis of immune-associated differences of the four key genes
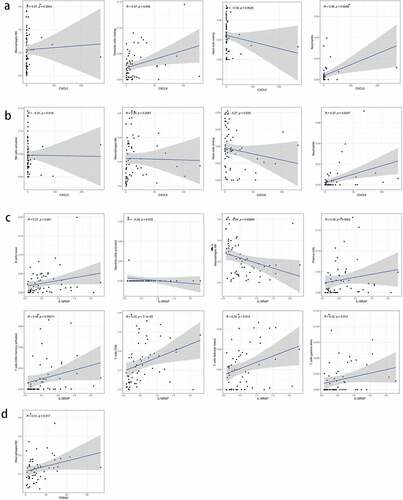
To further elucidate the immune-related differences of the four key genes (CXCL5, CXCL8, IL18RAP, and TREM2), all samples were categorized into two groups based on the differential expression of each key gene. The differences between the 21 TIICs in the different expression groups were analyzed. For the CXCL5 group, M0 macrophages (P = 0.012) were more abundant in the upregulated group than in the downregulated group. Resting dendritic cell (P = 0.004) content was higher in the downregulated group than in the upregulated group ()). M0 macrophages (P < 0.001) and naive B cells (P = 0.034) were more abundant in the CXCL8 upregulated group than in the downregulated group. CD8 T cells (P = 0.003) were more abundant in CXCL8 downregulated group than in the upregulated group ()). Naive B cells (P = 0.024), plasma cells (P = 0.033), CD8 T cells (P < 0.001), CD4 memory activated T cells (P = 0.018), and gamma delta T cells (P = 0.036) were more abundant in the IL18RAP upregulated group than in the downregulated group. M0 macrophages (P < 0.001) and activated dendritic cells (P = 0.043) were more abundant in the IL18RAP downregulated group ()). However, TREM2 did not show any significant differences between the groups ()). The results of the correlation analysis between CXCL5, CXCL8, IL18RAP, and TREM2, and immune cell infiltration are shown in . M0 macrophages and neutrophils were positively correlated with CXCL5, and activated natural killer cells and resting mast cells were negatively correlated with CXCL5 ()). CXCL8 was positively correlated with M0 macrophages, resting dendritic cells, and neutrophils, and negatively correlated with resting cells ()). IL18RAP was positively correlated with naive B cells, plasma cells, CD8 T cells, CD4 memory activated T cells, follicular helper T cells, gamma delta T cells, and negatively correlated with M0 macrophages and activated dendritic cells ()). TREM2 expression was positively correlated with M2 macrophages ()).
Figure 9. Relationship between the expression levels of four key genes (CXCL5, CXCL8, IL18RAP, and TREM2) and tumor-infiltrating immune cells (TIICs) in hepatocellular carcinoma (HCC) samples. violin diagram showed the proportion of 21 TIICs in the upregulated and downregulated groups. (a) CXCL5, (b) CXCL8, (c) IL18RAP, and (d) TREM2.
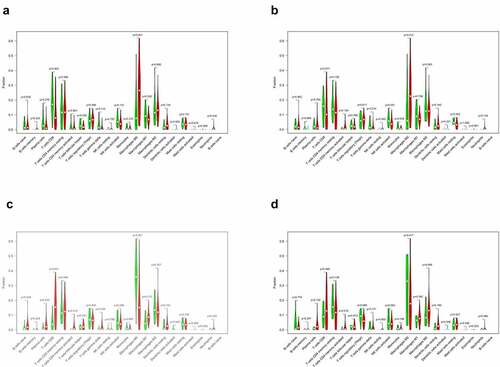
Figure 10. Correlation analysis of the expression of four key genes with tumor-infiltrating immune cells (TIICs). (a) scatter plot of four types of TIICs and CXCL5 expression. (b) Scatter plot of four types of TIICs and CXCL8 expression. (c) scatter plot of eight types of TIICs and IL18RAP expression. (d) scatter plot of an immune cell associated with TREM2 expression. P < 0.05
3.10 Immune cells that were closely associated with the expression of the key genes
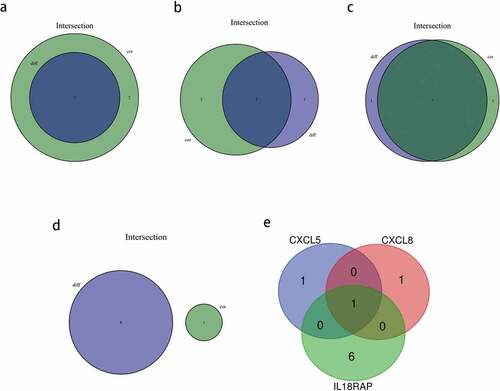
We identified key genes associated with TIICs using intersectional analysis of differential and correlated immune cell subsets. First, the immune cells closely related to each of the four key genes were identified. Consequently, two types of TIICs closely related to CXCL5 ()) and CXCL8 each ()), and seven types of TIICs related to IL18RAP ()) were found. As shown in ), there were no common TIICs between the differential and correlated immune cells in TREM2 ()). Next, we obtained the intersection of the abovementioned three genes with closely related TIICs ()), and determined that M0 macrophages were the most closely related with CXCL5, CXCL8, and IL18RAP.
Figure 11. Based on differential and correlation analyses, the immune cells that were closely related to key genes were analyzed by using a venn diagram. (a) two types of tumor-infiltrating immune cells (TIICs) closely related to CXCL5 expression. (b) two types of TIICs closely related to CXCL8 expression. (c) seven types of TIICs closely related to IL18RAP expression. (d) there were no common immune cells in the differential and correlation analyses of TREM2. (e) venn diagram showing the common TIICs related to CXCL5, CXCL8, and IL18RAP.
3.11 Expression levels and survival status of the four key genes
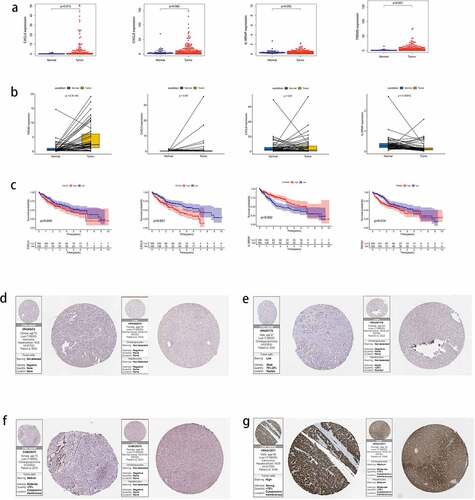
The expression of key genes was verified in HCC and normal tissues, and the expression of CXCL5 (P = 0.013), IL18RAP (P = 0.002), and TREM2 (P < 0.001) was determined to be higher in tumor tissues than in normal tissues; however, no differences were observed in CXCL8 expression ()). Next, we analyzed the expression of CXCL5, CXCL8, IL18RAP, and TREM2 in paired tumor and adjacent normal tissues ()). IL18RAP expression was higher in paired normal tissues than in tumor tissues (P < 0.001), TREM2 expression was higher in paired tumor tissues than in normal tissues (P < 0.001), and CXCL5 and CXCL8 did not show differences in expression between the two paired groups. The survival results ()) indicated that upregulated IL18RAP was associated with better prognosis than downregulated IL18RAP (P = 0.002). However, upregulated CXCL5 (P = 0.045), CXCL8 (P < 0.001), and TREM2 (P = 0.014) showed poorer survival than in their corresponding downregulated groups. Finally, protein profiles were acquired from HPA. CXCL5 protein expression was negative in both HCC and adjacent tissues ()), CXCL8 protein was less abundant in HCC and almost absent in adjacent tissues ()), IL18RAP protein was moderately abundant in HCC and, to a lesser extent, in adjacent tissues ()), and TREM2 protein was highly abundant in HCC tissues and moderately abundant in adjacent tissues ()).
Figure 12. The expression of four key genes in hepatocellular carcinoma (HCC) and their survival status. (a) the expression levels of the four key genes in HCC tissues and normal tissues. (b) the expression levels of four key genes in paired HCC tissues and adjacent tissues. (c) the survival status of high and low expression groups of the four genes. protein expression levels of the four genes in HCC and adjacent tissues. (d) CXCL5, (e) CXCL8, (f) IL18RAP, (g) and TREM2
4. Discussion
HCC is a common cancer that is typically diagnosed in advanced stages, and is associated with poor prognosis and a median survival of less than 12 months[Citation31]. Many studies have shown that the components of the TME are involved in tumor progression, and have suggested its prognostic value in HCC[Citation32]. However, the association of genes involved in the TME with cancer prognosis remains unclear[Citation33]. Thus, in this study, we estimated the immune and stromal scores to identify the key genes associated with HCC prognosis in TME. As tumor progression may be due to the disharmony in the immune response[Citation34], we used the CIBERSORT algorithm to analyze the classes and numbers of TIICs in the TME. Finally, we evaluated the prognostic significance of HCC by integrating the immune landscape with the key genes.
In the present study, we applied acquired stromal, immune, and ESTIMATE scores and analyzed the impact of different groups on patient outcomes. We did not find any significant difference in the OS between the immune, stromal, and ESTIMATE scores.In the past study, similar interstitial and immune states have been shown in HCC[Citation35]. Further, there was a significant negative correlation between clinical grade and the stromal score group. We also identified 830 DEGs and analyzed their GO and KEGG enrichment terms. The enrichment analyses revealed that the DEGs were mainly involved in ‘immune cell activation’ and ‘effects of chemokines and cytokines.’ Immune cell activation checkpoint is the most favorable measure to activate an anti-tumor immune response. Currently, the most reliable sites for cancer treatment are the CTLA-4- and PD-1-activated immune T cells. Drugs that antagonize CTLA-4 and PD-1 can greatly improve the treatment outcomes in late-stage cancer[Citation36]. Further, chemokines can alter the cancer progression and migration [Citation37,Citation38]. Cancer cells enrich inflammatory cells through differential expression of chemokines and alter tumor progression through chemokines[Citation39]; for instance, chemokines have been involved in the autocrine regulation of the cell proliferation in melanoma[Citation40].
Next, we analyzed the OS of 830 DEGs and found that 110 of them were associated with the prognosis of HCC. PPI network of these genes revealed two protein interaction modules and CD2, CCR7, CD80, CXCL8, LCK, CD69, TBX21, ZAP70, CXCR3, and IL7R as the top 10 nodes. Most of these nodes play important roles in the immune progression.CCR7 promotes HCC progression and is associated with poor survival[Citation41]. As a C4 subtype checkpoint gene, CD80 may be closely associated with immune escape in HCC[Citation42]. Chemokines such as CXCL8, CXCR3, CXCL1, and CXCL5 regulate the tumor immune response in tumor microenvironment [Citation37,Citation38,Citation43–45].
Next, we constructed a prognostic model of HCC associated with TME and obtained four prognostic core genes (CXCL5, CXCL8, IL18RAP, and TREM2) using Cox regression analyses. We concluded that age, clinical stage, N stage, and risk score were important prognostic variables for HCC, and IL18RAP and CXCL5 could be independent prognostic factors. IL18RAP is a susceptible gene in esophageal adenocarcinoma and Barrett’s esophagus[Citation46]. Tian et al. have screened IL18RAP and GPR182 as prognostic genes in the TME of HCC[Citation47]. In this study, four prognostic core genes, including IL18RAP, were obtained using similar analytical methods. However, unlike the previous study, we used risk scores and performed a GSEA of high-and low-risk groups to identify the main enriched pathways in different risk groups. CXCL5 is a predictor of poor prognosis in patients with colorectal cancer, and blocking the CXCL5- CXCR2 axis is an effective treatment strategy for them [Citation48,Citation49]. Haider et al. reported that the expression of CXCL5 in HCC is related to neutrophil recruitment, TGF-β/Smad3 signaling, and Axl expression[Citation50]. Zhou et al. reported that the upregulation of CXCL5 expression in HCC is related to the activation of PI3K/Akt/GSK-3β/Snail signaling and EMT phenotype[Citation51]. The differential expression of the CXCL5 gene is the key to the prognosis of HCC; therefore, CXCL5 can be used to evaluate tumor progression, block tumor progression, and predict tumor prognosis[Citation52]. Zhu et al. obtained CXCL5 and CXCL8 as prognostic genes in the TME of HCC, and analyzed the relationship between CXCL5/CXCL8 and TIICs[Citation53]. In this study, CXCL8 and CXCL5 were obtained using similar analysis methods. However, unlike previous studies, we used the CIBERSORT algorithm to analyze the correlation between prognostic genes and immune cells. Combined with the results of differential and correlation analyses, we identified TIICs with their common prognostic genes. Tang et al. reported that TREM2 inhibits cancer progression and migration by targeting the PI3K/Akt/β-catenin signaling pathway in HCC. In this study, we identified TREM2 as a key prognostic gene and analyzed its possible role in HCC[Citation54]. In contrast to previous similar reports, we identified the key prognostic genes in the TME of HCC, and then combined them with the immune spectrum to further explore their underlying mechanisms in HCC and their relationship with immunotherapy. While clarifying the characteristics of the key genes in the TME of HCC, we observed that high-risk groups were strongly associated with biosynthesis, and low-risk groups were strongly associated with metabolism.
We utilized CIBERSORT to assess the type and number of TIICs in the TME to elucidate the influence of the TME on tumor immunization. We found that there was a high proportion of M0 macrophages, CD8 T cells, M2 macrophages, CD4 memory resting T cells, and M1 macrophages in the tumor tissues. High proportion of CD4 memory resting T cells, M1 macrophages, M2 macrophages, CD8 T cells, and plasma cells were present in the normal tissues. Notably, the infiltration of M0 macrophages (P < 0.05) in normal tissues was significantly different from that in the tumor tissues. CD8+ T cells are the main cytotoxic lymphocytes that play an anti-tumor role. CD8+ T cells can induce B cells to produce plasma cells by producing IL-21, and play a role in humoral immunity[Citation55].
Among the four key genes screened, the ratio of M0 macrophages was higher in upregulated CXCL5 group, indicating that CXCL5 exerts its influence in HCC by upregulating M0 macrophage content. Meanwhile, the ratio of M0 macrophages to naive B cells was higher in the CXCL8 upregulated group. This may be associated with the promotion of CXCL8 secretion from macrophages by MMP (Matrix Metalloproteinase)[Citation56]. Furthermore, the ratio of gamma delta T cells, naive B cells, CD8 T cells, plasma cells, M1 macrophages, and CD4 memory activated T cells was higher in the upregulated IL18RAP group. We further identified that the three key genes (CXCL5, CXCL8, IL18RAP) shared M0 macrophage as the common TIIC, indicating that M0 macrophage may be closely related to the expression levels of these three important genes.
CXCL5 is reportedly involved in intrahepatic cholangiocarcinoma[Citation57], lung cancer[Citation58], prostate cancer[Citation59], pancreatic cancer[Citation60], endometrial carcinoma[Citation61], and squamous cell carcinoma of the head and neck[Citation62]. It has a high expression in various cancers, including bladder cancer[Citation63], and is involved in tumor progression. However, CXCL5 inhibits tumor progression in colorectal cancer and renal cell carcinoma [Citation64,Citation65]. The differential impact of CXCL5 in cancer is suggested by the fact that it can enrich different TIICs to either accelerate or restrain TIIC involvement in tumor enlargement. Our results showed that high expression of CXCL5 led to poor prognosis of HCC, which was consistent with the biological characteristics associated with CXCL5. Many studies have reported that CXCL8 is upregulated in different cancers. High CXCL8 expression is related to poor differentiation and poor survival[Citation66]. Upregulation of CXCL8 is also related to a lower OS rate in HCC. Furthermore, OS in the upregulated IL18RAP group was significantly higher than that in the downregulated group. Thus, upregulation of IL18RAP indicates a favorable prognosis for HCC, which can be further explored in the context of immunotherapy. At present, there are only a few reports on the application of IL18RAP in cancer. Some studies have shown that the IL18-IL18RAP axis is involved in inflammation and immune regulation, making it a potential therapeutic target for natural killer T-cell lymphoma[Citation67]. Furthermore, tumor-infiltrating macrophages can express TREM2, leading to an immunosuppressive microenvironment[Citation68], which can, in turn, promote tumor growth, but inhibit the anti-tumor immune response. Our study shows a consistent view that upregulation of TREM2 also contributes to the poor prognosis of patients with HCC.
The current study has certain limitations. First, this retrospective study needs to be validated in a large cohort. Second, because of the lack of in vivo and in vitro studies, there may be some deviations in our results. Thus, the mechanisms by which CXCL5, CXCL8, IL18RAP, and TREM2 affect the TME and immune cell infiltration in HCC requires further investigations.
5. Conclusion
We identified CXCL5, CXCL8, IL18RAP, and TREM2 as key DEGs that were associated with the TME and prognosis of HCC. IL18RAP and CXCL5 may be independent prognostic factors of HCC. The prognosis of patients with HCC who showed a high expression of IL18RAP was better and the survival time was longer; this may be used in improving the prognosis of patients with HCC in the future. Further, the expression of the four key genes was closely related to the TIICs, particularly, the M0 macrophages, suggesting their importance in the TME of HCC. However, further in vivo and in vitro studies and larger cohorts will be required to effectively validate the results of this study.
Highlights
1.CXCL5, CXCL8, IL18RAP, and TREM2 were identified as prognostic genes in HCC TME
2. High IL18RAP expression indicated a better prognosis for patients with HCC
3. Tumor infiltrating immune cell, macrophage M0, was shared by the prognostic genes
Acknowledgements
We are very grateful to TCGA database for providing valuable data resources to enable us to successfully complete this study.
Disclosure statement
The authors report no conflict of interest.
Additional information
Funding
References
- Maluccio M, Covey A .。Recent progress in understanding, diagnosing, and treating hepatocellular carcinoma. CA Cancer J Clin. 2012 2012-11-01;62(6):394–399. PMID: 23070690.
- Jiang Y, Han QJ, Zhang J. Hepatocellular carcinoma: mechanisms of progression and immunotherapy. World J Gastroenterol. 2019 2019-07-07;25(25):3151–3167. PMID: 31333308.
- Li L, Lei Q, Zhang S, et al. Screening and identification of key biomarkers in hepatocellular carcinoma: evidence from bioinformatic analysis. Oncol Rep. 2017 2017-11-01;38(5):2607–2618. PMID: 28901457.
- Quail DF, Joyce JA. Microenvironmental regulation of tumor progression and metastasis. Nat Med. 2013 2013-11-01;19(11):1423–1437. PMID: 24202395.
- Chen F, Zhuang X, Lin L, et al. New horizons in tumor microenvironment biology: challenges and opportunities. Bmc Med. 2015 2015-03-05;13:45. PMID: 25857315. 10.1186/s12916-015-0278-7. 13 1
- Hanahan D, Weinberg RA. Hallmarks of cancer: the next generation. CELL. 2011 2011-03-04;144(5):646–674. PMID: 21376230.
- Jia D, Li S, Li D, et al. TCGA database for genes of prognostic value in glioblastoma microenvironment. Aging (Albany NY). 2018 2018-04-16;10(4):592–605. PMID: 29676997.
- Yoshihara K, Shahmoradgoli M, Martinez E, et al. Inferring tumour purity and stromal and immune cell admixture from expression data. Nat Commun. 2013 2013-01-20;4:2612. PMID: 24113773. 1
- Alonso MH, Ausso S, Lopez-Doriga A, et al. Comprehensive analysis of copy number aberrations in microsatellite stable colon cancer in view of stromal component. Br J Cancer. 2017 2017-07-25;117(3):421–431. PMID: 28683472.
- Senbabaoglu Y, Gejman RS, Winer AG, et al. Tumor immune microenvironment characterization in clear cell renal cell carcinoma identifies prognostic and immunotherapeutically relevant messenger RNA signatures. Genome Biol. 2016 2016-11-17;17(1):231. PMID: 27855702.
- Priedigkeit N, Watters RJ, Lucas PC, et al. Exome-capture RNA sequencing of decade-old breast cancers and matched decalcified bone metastases. JCI Insight. 2017 2017-09-07;2(17). PMID: 28878133. 10.1172/jci.insight.95703.
- Shah N, Wang P, Wongvipat J, et al. Regulation of the glucocorticoid receptor via a BET-dependent enhancer drives antiandrogen resistance in prostate cancer. ELIFE. 2017 2017-09-11;6. PMID: 28891793. 10.7554/eLife.27861.
- Meng Z, Ren D, Zhang K, et al. Using ESTIMATE algorithm to establish an 8-mRNA signature prognosis prediction system and identify immunocyte infiltration-related genes in pancreatic adenocarcinoma. Aging (Albany NY). 2020 2020-03-17;12(6):5048–5070. PMID: 32181755.
- Ye L, Zhang T, Kang Z, et al.et al. Tumor-infiltrating immune cells act as a marker for prognosis in colorectal cancer. Front Immunol. 2019 2019-01-20;10:2368. PMID: 31681276.
- Workel HH, Komdeur FL, Wouters MC, et al. CD103 defines intraepithelial CD8+ PD1+ tumour-infiltrating lymphocytes of prognostic significance in endometrial adenocarcinoma. Eur J Cancer. 2016 2016-06-01;60:1–11. PMID: 27038842.
- Wang Y, Wang Y, Xu L, et al. CD4 + T cells promote renal cell carcinoma proliferation via modulating YBX1. Exp Cell Res. 2018 2018-02-01;363(1):95–101. PMID: 29289594.
- Bense RD, Sotiriou C, Piccart-Gebhart MJ, et al. Relevance of tumor-infiltrating immune cell composition and functionality for disease outcome in breast cancer. J Natl Cancer Inst. 2017 2017-01-01;109(1). PMID: 27737921. djw192
- Youngblood B, Hale JS, Kissick HT, et al. Effector CD8 T cells dedifferentiate into long-lived memory cells. NATURE. 2017 2017-12-21;552(7685):404–409. PMID: 29236683.
- Garnelo M, Tan A, Her Z, et al. Interaction between tumour-infiltrating B cells and T cells controls the progression of hepatocellular carcinoma. GUT. 2017 2017-02-01;66(2):342–351. PMID: 26669617.
- Grivennikov SI, Greten FR, Karin M. Immunity, inflammation, and cancer. CELL. 2010 2010-03-19;140(6):883–899. PMID: 20303878.
- Newman AM, Liu CL, Green MR, et al. Robust enumeration of cell subsets from tissue expression profiles. Nat Methods. 2015 2015-05-01;12(5):453–457. PMID: 25822800.
- Zeng D, Zhou R, Yu Y, et al. Gene expression profiles for a prognostic immunoscore in gastric cancer. Br J Surg. 2018 2018-09-01;105(10):1338–1348. PMID: 29691839.
- Ali HR, Chlon L, Pharoah PD, et al. Patterns of immune infiltration in breast cancer and their clinical implications: a gene-expression-based retrospective study. Plos Med. 2016 2016-12-01;13(12):e1002194. PMID: 27959923.
- Xiong Y, Wang K, Zhou H, et al. Profiles of immune infiltration in colorectal cancer and their clinical significant: a gene expression-based study. Cancer Med. 2018 2018-09-01;7(9):4496–4508. PMID: 30117315.
- Hong W, Yuan H, Gu Y, et al. Immune-related prognosis biomarkers associated with osteosarcoma microenvironment. Cancer Cell Int. 2020 2020-01-20;20:83. PMID: 32190007. 1
- Qu Y, Cheng B, Shao N, et al. Prognostic value of immune-related genes in the tumor microenvironment of lung adenocarcinoma and lung squamous cell carcinoma. Aging (Albany NY). 2020 2020-03-25;12(6):4757–4777. PMID: 32209727
- Ritchie ME, Phipson B, Wu D, et al. limma powers differential expression analyses for RNA-sequencing and microarray studies. Nucleic Acids Res. 2015 2015-04-20;43(7):e47. PMID: 25605792.
- Gu Z, Eils R, Schlesner M. Complex heatmaps reveal patterns and correlations in multidimensional genomic data. BIOINFORMATICS. 2016 2016-09-15;32(18):2847–2849. PMID: 27207943.
- Shannon P, Markiel A, Ozier O, et al. Cytoscape: a software environment for integrated models of biomolecular interaction networks. Genome Res. 2003 2003-11-01;13(11):2498–2504. PMID: 14597658.
- Subramanian A, Tamayo P, Mootha VK, et al. Gene set enrichment analysis: a knowledge-based approach for interpreting genome-wide expression profiles. Proc Natl Acad Sci U S A. 2005 2005-10-25;102(43):15545–15550. PMID: 16199517.
- Labeur TA, Achterbergh R, Takkenberg B, et al. Sorafenib for patients with hepatocellular carcinoma and child-pugh B liver cirrhosis: lessons learned from a terminated study. ONCOLOGIST. 2020 2020-09-01;25(9):e1274–9. PMID: 31645371.
- Yang JD, Nakamura I, Roberts LR. The tumor microenvironment in hepatocellular carcinoma: current status and therapeutic targets. Semin Cancer Biol. 2011 2011-02-01;21(1):35–43. PMID: 20946957.
- Zhang Z, Chen D, Li Z, et al. Bioinformatics analysis to screen the key prognostic genes in tumor microenvironment of bladder cancer. Biomed Res Int. 2020-01-20;2020:6034670. PMID: 32149116. 10.1155/2020/6034670.
- Galon J, Angell HK, Bedognetti D, et al. The continuum of cancer immunosurveillance: prognostic, predictive, and mechanistic signatures. IMMUNITY. 2013 2013-07-25;39(1):11–26. PMID: 23890060.
- Deng Z, Wang J, Xu B, et al. Mining TCGA database for tumor microenvironment-related genes of prognostic value in hepatocellular carcinoma. Biomed Res Int. 2019-01-20;2019:2408348. PMID: 31828095. 10.1155/2019/2408348.
- Rotte A. Combination of CTLA-4 and PD-1 blockers for treatment of cancer. J Exp Clin Cancer Res. 2019 2019 Jun 13;38(1):255. PMID: 31196207.
- Caronni N, Savino B, Recordati C, et al. Cancer and chemokines. Methods Mol Biol. 2016 2016-01-20;1393:87–96. PMID: 27033218.
- Alain P, Vicari A, Christophe C. Chemokines in cancer. CYTOKINE GROWTH F R. 2002.
- Coussens LM, Werb Z. Inflammation and cancer. NATURE. 2002;420(6917):860–867.
- Richmond A, Thomas HG. Purification of melanoma growth stimulatory activity. J Cell Physiol. 1986 1986-12-01;129(3):375–384. PMID: 3465735.
- Yang L, Chang Y, Cao P. CCR7 preservation via histone deacetylase inhibition promotes epithelial-mesenchymal transition of hepatocellular carcinoma cells. Exp Cell Res. 2018 2018-10-01;371(1):231–237. PMID: 30107147.
- Li W, Wang H, Ma Z, et al. Multi-omics analysis of microenvironment characteristics and immune escape mechanisms of hepatocellular carcinoma. Front Oncol. 2019 2019-01-20;9:1019. PMID: 31681571
- Nagarsheth N, Wicha MS, Zou W. Chemokines in the cancer microenvironment and their relevance in cancer immunotherapy. Nat Rev Immunol 2017. 17 9 559–572.
- Karin N. Chemokines and cancer: new immune checkpoints for cancer therapy. Curr Opin Immunol. 2018;51:140.
- Mollica PV, Massara M, Capucetti A, et al. Chemokines and chemokine receptors: new targets for cancer immunotherapy. Front Immunol. 2019 2019-01-20;10:379. PMID: 30894861.
- Babar M, Ryan AW, Anderson LA, et al. Genes of the interleukin-18 pathway are associated with susceptibility to Barrett’s esophagus and esophageal adenocarcinoma. Am J Gastroenterol. 2012 2012-09-01;107(9):1331–1341. PMID: 22664470.
- Tian Z, Wang Z, Chen Y, et al. Bioinformatics analysis of prognostic tumor microenvironment-related genes in the tumor microenvironment of hepatocellular carcinoma. Med Sci Monit. 2020 2020-03-31;26:e922159. PMID: 32231177.
- Zhao J, Ou B, Han D, et al. Tumor-derived CXCL5 promotes human colorectal cancer metastasis through activation of the ERK/Elk-1/Snail and AKT/GSK3beta/beta-catenin pathways. Mol Cancer. 2017 2017-03-29;16(1):70. PMID: 28356111.
- Chen C, Xu ZQ, Zong YP, et al.et al. CXCL5 induces tumor angiogenesis via enhancing the expression of FOXD1 mediated by the AKT/NF-kappaB pathway in colorectal cancer. Cell Death Dis. 2019 2019-02-21;10(3):178. PMID: 30792394.
- Haider C, Hnat J, Wagner R, et al. Transforming growth factor-beta and axl induce CXCL5 and neutrophil recruitment in hepatocellular carcinoma. HEPATOLOGY. 2019 2019-01-01;69(1):222–236. PMID: 30014484.
- Zhou SL, Zhou ZJ, Hu ZQ, et al. CXCR2/CXCL5 axis contributes to epithelial-mesenchymal transition of HCC cells through activating PI3K/Akt/GSK-3beta/Snail signaling. Cancer Lett. 2015 2015-03-28;358(2):124–135. PMID: 25462858.
- Zhang W, Wang H, Sun M, et al. CXCL5/CXCR2 axis in tumor microenvironment as potential diagnostic biomarker and therapeutic target. Cancer Commun (Lond). 2020 2020-03-01;40(2–3):69–80. PMID: 32237072.
- Zhu J, Zhou Y, Wang L, et al. CXCL5/CXCL8 is a promising potential prognostic and tumor microenvironment-related cluster in hepatocellular carcinoma. J Gastrointest Oncol. 2020 2020-12-01;11(6):1364–1380. PMID: 33457007.
- Tang W, Lv B, Yang B, et al. TREM2 acts as a tumor suppressor in hepatocellular carcinoma by targeting the PI3K/Akt/beta-catenin pathway. ONCOGENESIS. 2019 2019-01-25;25(9):9. PMID: 30683932.
- Ye L, Li Y, Tang H, et al. CD8+CXCR5+T cells infiltrating hepatocellular carcinomas are activated and predictive of a better prognosis. Aging (Albany NY). 2019;11(20). 20
- Jobin PG, Solis N, Machado Y, et al. Moonlighting matrix metalloproteinase subsRtrates: enhancement of proinflammatory functions of extracellular tyrosyl-tRNA synthetase upon cleavage. J Biol Chem. 2020 2020-02-21;295(8):2186–2202. PMID: 31771979.
- Zhou SL, Dai Z, Zhou ZJ, et al. CXCL5 contributes to tumor metastasis and recurrence of intrahepatic cholangiocarcinoma by recruiting infiltrative intratumoral neutrophils. CARCINOGENESIS. 2014 2014-03-01;35(3):597–605. PMID: 24293410.
- Kowalczuk O, Burzykowski T, Niklinska WE, et al. CXCL5 as a potential novel prognostic factor in early stage non-small cell lung cancer: results of a study of expression levels of 23 genes. Tumour Biol. 2014 2014-05-01;35(5):4619–4628. PMID: 24500664.
- Begley LA, Kasina S, Mehra R, et al. CXCL5 promotes prostate cancer progression. NEOPLASIA. 2008 2008-03-01;10(3):244–254. PMID: 18320069.
- Li A, King J, Moro A, et al. Overexpression of CXCL5 is associated with poor survival in patients with pancreatic cancer. Am J Pathol. 2011 2011-03-01;178(3):1340–1349. PMID: 21356384.
- Wong YF, Cheung TH, Lo KW, et al. Identification of molecular markers and signaling pathway in endometrial cancer in Hong Kong Chinese women by genome-wide gene expression profiling. ONCOGENE. 2007 2007-03-22;26(13):1971–1982. PMID: 17043662.
- Miyazaki H, Patel V, Wang H, et al. Down-regulation of CXCL5 inhibits squamous carcinogenesis. Cancer Res. 2006 2006-04-15;66(8):4279–4284. PMID: 16618752.
- Gao Y, Guan Z, Chen J, et al. CXCL5/CXCR2 axis promotes bladder cancer cell migration and invasion by activating PI3K/AKT-induced upregulation of MMP2/MMP9. Int J Oncol. 2015 2015-08-01;47(2):690–700. PMID: 26058729.
- Speetjens FM, Kuppen PJK, Sandel MH, et al. Disrupted expression of CXCL5 in colorectal cancer is associated with rapid tumor formation in rats and poor prognosis in patients. Clin Cancer Res. 2008;14(8):2276–2284.
- Lopez-Lago MA, Posner S, Thodima VJ, et al. Neutrophil chemokines secreted by tumor cells mount a lung antimetastatic response during renal cell carcinoma progression. ONCOGENE. 2013 2013-04-04;32(14):1752–1760. PMID: 22665059.
- Benoy IH, Salgado R, Van Dam P, et al. Increased serum interleukin-8 in patients with early and metastatic breast cancer correlates with early dissemination and survival. Clin Cancer Res. 2004 2004-11-01;10(21):7157–7162. PMID: 15534087.
- Lin GW, Xu C, Chen K, et al. Genetic risk of extranodal natural killer T-cell lymphoma: a genome-wide association study in multiple populations. Lancet Oncol. 2020 2020-02-01;21(2):306–316. PMID: 31879220.
- Molgora M, Esaulova E, Vermi W, et al. TREM2 modulation remodels the tumor myeloid landscape enhancing anti-PD-1 immunotherapy. CELL. 2020 2020-08-20;182(4):886–900. PMID: 32783918.