
ABSTRACT
Colorectal cancer (CRC) is one of the most common tumors, ranking second in the global cause of death from cancer. The prognosis of advanced patients is still very poor. In this study, hub modules with the highest association with tumor-infiltrating immune cells were identified by weighted gene co-expression network analysis based on CRC expression data from the Gene Expression Omnibus database. Next, three hub genes (ADAM8, IL-1A, VAV3) related to infiltrating immune cells were identified by co-expression network and prognostic analysis. After analysis and verification of the TIMER database, ADAM8 was selected as a prognostic biomarker. Finally, the result of functional test showed that ADAM8 gene expression down-regulation partially reversed the immune tolerance of CRC cells to TILs. By bioinformatics analysis methods and the experimental techniques, we identified ADAM8 as a prognostic biomarker and clinical therapeutic target related to tumor-infiltrating immune cells in CRC.
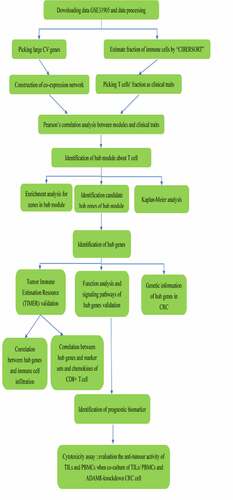
Graphical abstract
Introduction
Colon cancer is the 3rd most common malignancy worldwide with a relatively high mortality. Tumor, node and metastases (TNM) classification showed the value of evaluating disease prognosis [Citation1,Citation2]. However, identical TNM stage and similar therapeutic strategy may still lead to divergent clinical outcomes of patients with colon cancer [Citation3,Citation4]. T cells are divided into two categories: αβ T cells and γδ T cells according to TCR subtype with γδ T cells small numbers mainly distributed in tissues such as skin and intestinal mucosa. Tumor-infiltrating γδ-T-cells consist of Vδ1 and Vδ2 subtypes, γδ T cells are now considered to be promising candidates for adoptive cell immunotherapy [Citation5]. Big data analysis across 25 cancers and 14 solid non-brain tumors showed that among all tumor-infiltrating T lymphocytes, tumor-infiltrating γδT cells had the high correlation with good prognosis, indicating that γδT may play a vital important role in anti-tumor immunity [Citation6]. Previous research showed that the number of Vδ1 T cells were markedly increased, whereas Vδ2 T cells were significantly decreased. The imbalance of the ratio of the two disrupted the tumor immune microenvironment [Citation7]. Since γδ T cells do not have MHC restriction on tumor antigen recognition and also rapidly produce a substantial amounts of cytokines and effectively kill malignant tumors, γδ T cell-based cancer immunotherapy is considered a promising therapy in tumor immunotherapy field [Citation8,Citation9]. Currently, a number of clinical trials regarding γδ T-cell-based specific immunotherapy have been completed or are ongoing for the assessment of the safety and anti-tumor efficacy of γδ T cells [Citation10].
PD-1/PD-L1 and CTLA4 inhibitors require the participation of significant immune cell infiltration surrounding tumors. The abundance of TIL can be used as a biomarker to predict responsiveness of PD-1/PD-L1 inhibitors. In many clinical studies, TIL abundance has shown good predictive value for the clinical efficacy. One study investigated the possibility of TIL as a biomarker for PD-1 inhibitors in the treatment of melanoma and Non-small cell lung cancer (NSCLC). The density of CD4+ and CD8+ TIL in melanoma was found to be significantly correlated with the response rate after PD-1 inhibitor treatment. When CD8+ TIL count ≥1900/mm 2, the response rate (RR) was as high as 90% [Citation11]. The increasing number of CD8 + T cells, PD-1 + T cells and PDL1 + T cells at the tumor center and invasive margin of patients with good response to PD-1 inhibitor was significantly higher than that of patients with tumor progression [Citation11]. When there was CD8 + T cell infiltration in the tumor microenvironment, the response rate of PD-1 inhibitor treatment was higher [Citation12]. The high infiltration of CD8 + T cells on the invasive margin in CRC with hepatic metastases indicates a better response to chemotherapy [Citation13].
Therefore, the identification of immune-related biomarkers will help monitor colon cancer immunotherapy response, predict patient outcome and even reverse cancer immunotolerance. In this study, we used bioinformatics analysis methods to evaluate the immune microenvironmental cell infiltration in CRC patients, and then identify a novel biomarker. Finally, we explored its biological effects, providing new therapeutic targets for clinical treatment of CRC. We used WGCNA R package to construct a co-expression network about genes in the dataset. Based on the CIBERSORT algorithm, the T-cell compositions of CRC samples were evaluated. We then identified gene modules and key hub genes related to TILs cell infiltration. Then, some independent prognostic biomarkers were identified and verified. After analysis and verification of the TIMER database, ADAM8 was considered as a prognostic biomarker. Finally, the functional test result showed ADAM8 participated in the promotion of CRC cell proliferation. The ADAM8 gene expression down-regulation partially reversed the immune tolerance of CRC cells to TILs. With bioinformatics analysis methods and the experimental verification, we demonstrated that ADAM8 was a promising immune-related biomarker and therapeutic target related to tumor-infiltrating immune cells in CRC.
Materials and methods
WGCNA analysis
The Series Matrix File of GSE31905 was downloaded from the GEO database (https://www.ncbi.nlm.nih.gov/geo/query/acc.cgi?acc=GSE31905), including the transcriptome data of 55 groups of patients for subsequent analysis. This study found hub modules or genes and explored the relationship between the gene module network and a given cancer phenotype and the core genes in the network by using Weighted Gene Co-Expression Network Analysis. The WGCNA-R package was performed to construct a co-expression network and the genes with the top 5000 variances were selected by this algorithm. The soft threshold was set to 2. The weighted adjacency matrix was converted into a topological overlap matrix (TOM) to assess the network connectivity. The hierarchical clustering method was used to construct the clustering tree structure of the TOM. Different branches of the clustering tree represent different gene modules, and different colors represented different modules. Genes with similar patterns were grouped into one module according to the weighted correlation coefficients of genes.
Immune cell infiltration analysis:
The CIBERSORT algorithm(http://cibersort.stanford.edu) was performed to analyze the RNA-seq data of COAD patients to estimate the relative proportion of 22 immune infiltrating cells by using the R package ‘CIBERSORT’. The content of immune cells in every sample together with the mRNA expression data was constructed WGCNA network to find the module genes highly related to immune infiltration and further explore its specific molecular mechanism.
Gene module function enrichment analysis:
In order to understand the biological functions and signal pathways involved in the modules which had the highest correlation with the phenotype, we referred to the Metascape database (www.metascape.org), to annotate and visualize. The top 500 genes with the highest degree from specific modules were analyzed based on GO and KEGG pathway analysis. Min overlap≥3 was considered to be statistically significant, with P ≤ 0.01.
TCGA data acquisition:
The TCGA database(https://tcga-data.nci.nih.gov/tcga/) is currently the largest cancer gene information database including gene expression data, miRNA expression data, copy number variations, DNA methylation, SNP, etc. We downloaded raw and processed data containing information regarding mRNA expression in 473 tumor samples and 41 normal samples.
The relationship between hub genes and immune cells:
We used the TIMER database (https://cistrome.shinyapps.io/timer/) to detect the infiltration of different immune cells in tumor tissues according to RNA‐Seq expression profiling data. In our study, we explored the relationship between the hub gene and the content of different immune cells and compared the level of tumor infiltrating with different somatic copy number alterations of the hub gene by the TIMER database. Gene markers and chemokines of CD8 + T cells were measured via correlation modules in the TIMER database.
Genetic alteration from cBioPortal
Genomic alteration (amplification, deep deletion, mRNA high) of three hub genes in CRC was obtained from cBioPortal (https://www.cbioportal.org/). The OncoPrint schematic was plotted in cBioPortal.
GSVA (Gene Set Variation Analysis)
Gene set variation analysis (GSVA) is a non-parametric and unsupervised method for evaluating the enrichment of transcriptome gene sets. GSVA was implemented by the ‘GSVA’ package of R. All gene sets used in this study were acquired from the Molecular signatures database and the GSVA algorithm was applied to comprehensively score each gene set to evaluate potential changes in the biological function. Furthermore, the protein–protein interaction (PPI) network of hub genes was conducted via the String and Cytoscape (version 3.7.1).
Cell culture and siRNA-ADAM8 construction
The SW480 cells were purchased from Cell Bank of Typical Culture Preservation Committee of Chinese Academy of Sciences (Shanghai, China). The SW480 cells were cultivated in DMEM containing 10% of fetal calf serum. The ADAM8 siRNA sequences were as follows: si-ADAM8-1 sense 5ʹ-GGACAAGCUAUAUCAGAAAdTdT-3ʹ and antisense 3ʹ-dTdTCCUGUUCGAUAUAGUCUUU-5ʹ; and si-ADAM8-2 sense 5ʹ-GCACCUGCAUGACAACGUAdTdT-3ʹ and antisense 3ʹ-dTdTCGUGGACGUACUGUUGCAU-5ʹ, all of which were obtained from RiboBio Co. Ltd. SW480 cells (1 × 10⁵) were transfected with siRNA or control using Lipofectamine 2000 reagent according to the manufacturer's protocol. ADAM8 levels were measured and were analyzed after 48 h transfection.
RNA extraction and quantitative RT-PCR
RNA samples were isolated from SW480 using the FastPure Cell/Tissue Total RNA Isolation kit. Then, the RNA was reverse-transcribed into cDNA with HiScript III RT SuperMix. The transcript levels of ADAM8 were analyzed by Real-time fluorescent quantitative PCR with the SYBR Green I fluorescent dye reagent. Amplifications were performed with ADAM8 primers under the following reaction conditions at 95°C for 30 sec (1 cycle), followed by 45 cycles consisting of 95°C for 10 sec and 60°C for 35 sec. The ADAM8 primer sequences were as follows: 5′-ACA ATGCAGAGTTCCAGATGC-3′and 5′-GACCACACGGAAGTTGAGTT −3′.
Cytotoxicity assay
PBMCs or TILs were co-cultured with tumor cells under different treatment (NC/Si1/Si2) in 200 μL DMEM (including FBS) at 5:1, 10:1, 20:1, 50:1 efficiency target ratio (E: T) in a 96-well plate, done in triplicates, and incubated in a humid environment at 37°C for 48 hours in a 5% carbon dioxide cell incubator. Cell growth viability was determined using the Cell Counting Kit 8 (Beyotime, Shanghai, China) following the manufacturer’s instructions. Absorbance at 450 nm was read with a Elx800 Reader (BioTECH Instruments Inc., Winooski, Vermont, USA). The viability of tumor cells was calculated by the following formula: tumor cell viability (%) = (mixed cell absorbance-effector cell absorbance-medium control)/(target cell absorbance-medium control) × 100.
Statistical Analysis:
Statistical analyses were conducted using a statistical computing language R. Kaplan–Meier survival analysis for these two expressing groups split at median value was completed with R package ‘survival’. All statistical tests were two-sided and P value < 0.05 was considered to be statistically significant.
Results
This study aimed to identify a new prognostic biomarker related to TILs infiltration that would help monitor immunotherapy response and explore the mechanism of immune infiltration in CRC. By the CIBERSORT algorithm and constructing the WGCNA, gene modules and key hub genes were identified as biomarkers related to TILs infiltration. Then, enrichment analysis for genes in hub module and Kaplan-Meier analysis revealed that three genes (ADAM8, IL-1A, VAV3) were identified to be immune-related biomarkers. Then, TIMER analysis demonstrated that ADAM8, VAV3, IL-1A were positively correlated with the immune cells infiltration. PPI and Gene Set Variation Analysis showed three genes were related to immunity. However, ADAM8 was found to be more closely related to immune markers and chemokines of T cell. Finally, cytotoxicity assay demonstrated that ADAM8 gene may be involved in immune microenvironment regulation. Our data and experimental results showed that ADAM8 is a better immune-related prognostic marker compared with IL-1A and VAV3.
Public datasets
The TCGA database contained 514 samples from CRC patients, including 41 normal tissue samples and 473 tumor samples. Besides, the Series Matrix File of GSE31905 was downloaded from the GEO database, including the transcriptome data of 55 groups of patients for subsequent analysis. It stores data including gene expression, miRNA expression, copy number variations, DNA methylation, SNP, etc.
Gene co-expression network of colon cancer
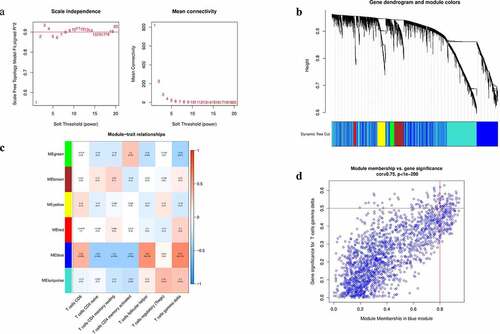
The CIBERSORT algorithm was performed to analyze the RNA-seq data of COAD patients to estimate abundances of 22 immune infiltrating cells. Then, the fractions of seven distinct subtypes of T Lymphocytes in each patient together with the mRNA expression data were selected as trait data of Weighted Gene Co-Expression Network Analysis network. Then, the WGCNA R package was used to construct a co-expression network of all genes in the original data set and the genes with the top 5000 variances were screened by this algorithm. The analysis of network topology was performed using an optimal soft threshold power conducive to a relatively good balance between scale-independence and mean connectivity. As presented in , according to scale-free topological criteria, soft power was chosen to be 2 to set up a scale free network. Subsequently, the hierarchical clustering method was performed to construct the clustering tree structure of the Topological Overlap Matrix. Genes with similar patterns formed a branch of the tree and were grouped into one module according to the weighed correlation coefficients of genes. Then, a cluster dendrogram was generated to obtain six gene modules (). Then, we computed the Pearson's correlation coefficient between module eigengenes and T-cell infiltration to determine the module-trait significance using module–trait relationship analysis. Heatmap was performed to show the correlation between the above modules and tumor-infiltrating immune cells ()
Figure 1. Construction of WGCNA analysis
Identification of hub modules and functional enrichment analysis
Among the six modules identified, the blue module showed the highest association with the phenotype (immune cells). High correlation with T cells follicular helper (R2 = 0.55, P = 5e-05) and T cells gamma delta (R2 = 0.57, P = 2e-05) was prominently observed with blue-colored module clusters. After performing the gene significance against module membership, we observed that genes with high module memberships tended to have high gene significance for T cells gamma delta in this module (cor = 0.75, P < 1e−200; ). However, the correlation between the remaining modules and T cells was below 0.5. So far, we have discovered that the bule module can be used as a hub module to be related to tumor-infiltrating immune cells.
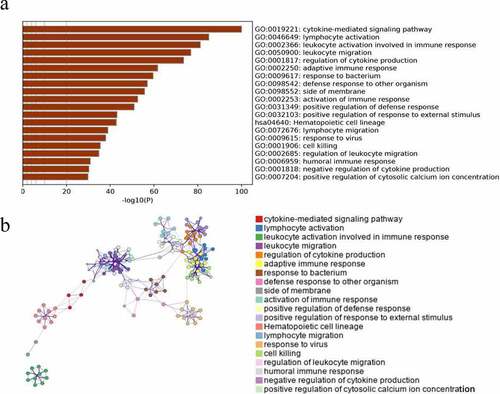
Next, we performed GO analysis and KEGG pathway analysis to better understand the biological functions of genes in the blue module using the online bioinformatics database Metascape. In our analysis we used the genes within the module to perform pathway analysis using metascape database. As shown in , the top 20 GO enrichment terms were related to immunity. The top three enriched biological process Gene Ontology (GO) terms were Cytokine-mediated Signaling Pathway, Lymphocyte Activation and Leukocyte Activation Involved In Immune Response ().
Figure 2. The enrichment analysis of hub module
Identification and validation of hub genes
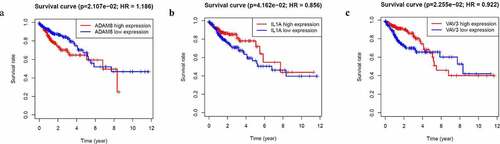
There were 1812 genes in the GSE31905 blue module. In order to screen out the core genes that are more clinically relevant and highly correlated to the module eigengene, we then performed survival analysis. Three genes (ADAM8, IL-1A, VAV3) were identified to be related to patient prognosis. As shown in , high ADAM8 expression was associated with poorer overall survival in CRC patients. Other results of IL-1A, VAV3 were also presented in .
Figure 3. Identification of hub genes
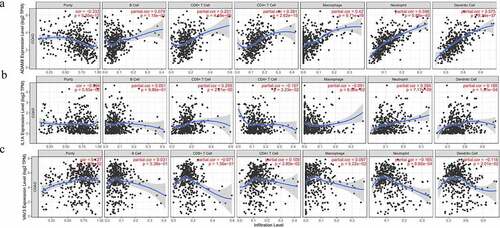
Pertinence of hub expression and immune infiltration level in CRC cancer
Then, we further explored whether expression of these three genes were related to immune infiltration in CRC, including some immune cell types. To reveal the relationship between hub genes and infiltrating immune cells, we used the TIMER database to analyze. As shown in , ADAM8 expression was positively correlated with CD4 + T cells (r = 0.381, P = 2.62e−15), Macrophages (r = 0.42, P = 9.71e−19), Neutrophil (r = 0.596, P = 5.88e−40), Dendritic Cell (r = 0.575, P = 8.34e−37), CD8 + T cells (r = 0.201, P = 4.48e−05; ). However, no significant correlation was found between ADAM8 expression and B cells. Similarly, IL-1A positively correlated with Neutrophil (r = 0.281, P = 7.17e−09). There was no apparent relationship between B cell, Macrophage and IL-1A (), but VAV3 had a modest association with immune infiltration (). Besides, we explored the correlation between ADAM8 expression and cell surface marker of CD8 + T cells (CD8A and CD8B), general T cells (CD2 and CD3D) and T cell chemokines (CCR5, CX3CR1, CXCR3, CXCR6 and CCL22) in CRC. The results showed that the expression level of ADAM8 was positively correlated with the immune biomarkers and chemokines of CD8 + T cells. There is no obvious correlation between IL-IA, VAV3 and these markers (Supplementary Figure S1).
Figure 4. Correlation between three expressed prognostic genes and immune cell infiltration through TIMER
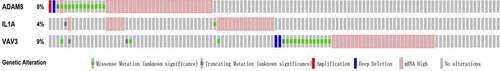
Genetic information of hub gene in CRC
Subsequently, the three hub genes’ alteration information in TCGA CRC patients were determined by performing OncoPrint of CBioPortal. The frequency of alteration of three hub genes was shown in . ADAM8 and VAV3 altered most (8% and 9%, respectively), amplification, and missense mutation was the main type. ADAM8 showed higher methylation in tumor tissues compared with matched normal tissues. On the contrary, other hub genes exhibited opposite results (Supplementary Figure S2).
Figure 5. Genetic Alteration of hub genes in CRC
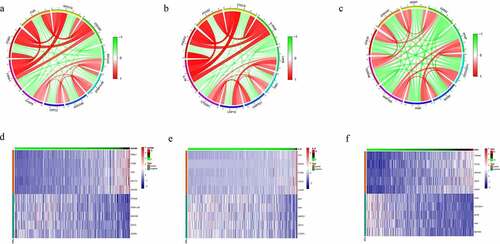
Co-expression Genes correlated with hub genes in CRC were confirmed using spearman method to analyze mRNA sequencing data from CRC patients. There were 955 genes high correlation to ADAM8 (cor > 0.3, P < 0.01). The top five significant genes sets positively and negatively correlated with ADAM8 were shown in the circos and heatmap (). As it turned out, ADAM8 seemed to have extensive influence on the transcriptome. Other results for the IL-1A and VAV3 outcomes identified were listed in . Using STRING and Cytoscape, we set up the PPI network for these genes and discovered that the core genes were mainly related to inflammatory response and positive regulation of cytokine production (Supplementary Figure S3).
Figure 6. Co-expression Genes correlated with hub genes in CRC
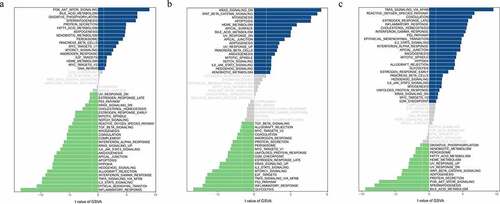
Functional analysis and signaling pathways of hub genes
By performing GSVA analysis on hub genes of the low-expression group and the high-expression group, we got the detailed functions of those hub genes. showed the genes were mainly involved in the regulation of molecular functions and biological processes and signaling pathways including inflammatory pathway, TNFA signaling via NFKB, and IL2-STAT5 signaling pathway.
Figure 7. Function analysis and signaling pathways of hub genes
Knockdown of ADAM8 increased the sensitivity of TILs cell killing
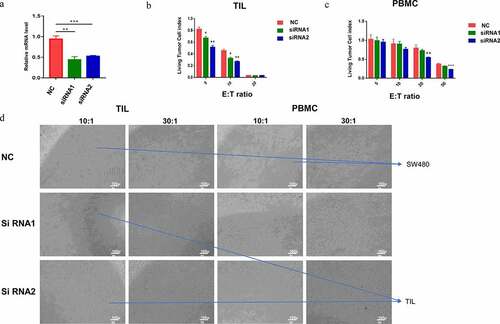
Among these three genes, these findings suggested that ADAM8 might play the most important role in regulating TME components, especially as it was associated with immune infiltration in CRC. To further investigate the potential effect of ADAM8 on CRC, gene silencing of ADAM8 in SW480 was performed by RNAi. Real-time RT-PCR indicated that siADAM8 had a high inhibitory effect compared with control siRNA (). Then, SW480 cells were used as target cells to evaluate the cytotoxic potential of 5:1, 10:1, 20:1, 50:1 TILs or PBMCs. PBMCs or TILs were co-cultured with different treatment tumor cells for 48 h. As shown in , the anti-tumor activity of TILs and PBMCs was evaluated after co-culture of TILs/PBMCs and control-knockdown or ADAM8-knockdown CRC cells (). Compared with the control group, the sensitivity of TIL cell killing in the ADAM8 knockdown group was significantly increased, suggesting that the ADAM8 gene expression down-regulation partially reversed the immune tolerance of SW480 cells to TILs. However, no significant difference was observed in PBMCs group. Down-regulation of ADAM8 gene expression regulated and enhanced the killing effect of TILs on tumor cells. ADAM8 gene may be involved in immune microenvironment regulation.
Figure 8. Functional experiments of ADAM8
Discussion
CRC, one of the most common malignancies of the digestive system, is a complex molecular network disease. To further understand the molecular mechanisms of its tumorigenesis and tumor progression, we presented the gene expression data matrix of CRC and normal tissue sample as raw data. Through the WGCNA, we successfully mined all related modules. WGCNA can be widely used as a data mining tool or gene screening method to find clusters of highly relevant genes in various cancers. For example, Zhen Xiang et al. performed WGCNA analysis to identify the brown module positively correlated with IDO1 expression level [Citation14].
The hub genes were ADAM8, IL-1A and VAV3. ADAM8 is abnormally expressed in a number of types of solid tumor, such as breast cancer [Citation15,Citation16], brain cancer [Citation17,Citation18], gastric cancer [Citation19], pancreatic cancer [Citation16,Citation20] and lung cancer [Citation21,Citation22]. ADAM8 was involved in tumor proliferation, invasion, metastasis, angiogenesis, chemoresistance, playing an important role in tumorigenesis [Citation23,Citation24]. Additionally, ADAM8 was revealed to be associated with poor patient prognosis [Citation25]. According to our results, CRC demonstrated VAV3 a high alteration rate of 9% among three hub genes. The previous study also confirmed that overexpression of VAV3 can promote the invasion and metastasis of colorectal cancer, which was related to poor prognosis [Citation26]. TIMER analysis demonstrated that ADAM8, VAV3, IL-1A were positively correlated with the immune cells infiltration. PPI and Gene Set Variation Analysis showed three genes were related to immunity. However, the relationship between VAV3, IL-1A and the immune cells infiltration, immune markers and chemokines of CD8 + T cell were not as obvious as ADAM8. Therefore, VAV3 may have a more prominent impact on the malignant biological behavior of CRC, but have a small or insignificant impact on the tumor microenvironment.
Tumor microenvironment (TME) is now considered one of the 10 hallmarks of cancer [Citation27]. Changes in the tumor microenvironment have been widely considered to be an important target that can affect the prognosis of patients with CRC. However, we found that the current researches on tumor microenvironment and CRC were slightly insufficient, and there was no research on the prognosis of CRC patients according to the analysis of cellular components of the immune microenvironment. This study analyzed the cellular infiltration of the immune microenvironment of CRC patients, proposed three immune-related prognostic biomarkers, and described their biological functions in CRC patients, providing a new target for CRC immunotherapy. Our study suggested that ADAM8 expression was positively correlated with infiltration of CD8 + T and CD4 + T cells immune and markers and chemokines of CD8 + T cell. Immunotherapy may be more suitable for these patients. Besides, our findings had similar results with previous study. ADAM8 was associated with poorer overall survival in CRC patients [Citation23]. Overall, our data and experimental results show that ADAM8 is a new prognostic biomarker that may be useful for developing more effective CRC treatment strategies.
In this study, the complex omics data were simplified into several functional modules by WGCNA. Based on the WGCNA data, we identified three hub genes as potential γδ T cell related biomarkers of CRC that are associated with OS. A variety of gene modules with different biological functions were identified. Next, TIMER database was used to explore the relationship between the hub gene and the content of immune cells and to compare the level of tumor infiltrating with different somatic copy number alterations of the hub gene. We experimentally further investigated the relationship between ADAM8 and the immunologic microenvironment. However, there were some shortcomings in this study. The sample size of the study was not large enough, and our population also had limited representativeness of CRC patients. Follow-up studies with a larger the target population are required to further solve the above-mentioned questions. Due to technical constraints of chip sequencing technology, the existence of batch effect might cause the risk of data bias.
Conclusion
In our study, three hub genes (ADAM8, IL-1A and VAV3) were considered as possible candidate prognostic biomarkers related to T cell infiltration. Further analysis including bioinformatical analysis and the validating experiments showed that ADAM8 expression was more associated with TILs infiltration. Overall, ADAM8 is a better immune-related prognostic marker compared with IL-1A and VAV3.
Highlights
(1) Hub genes (ADAM8, IL-1A, VAV3) would be related to tumor-infiltrating immune cells.
(2) ADAM8, IL-1A, VAV3 were selected as a prognostic biomarkers.
(3) Down-regulation of ADAM8 can enhance the killing effect of TILs on tumor cells.
Author Contributions
Liao R, Ma QZ and Zhu Q conceived the study and participated in its design and manuscript preparation. Rong Liao and Qi-zhi Ma carried out all lab experiments. All authors participated in acquisition, analysis, or interpretation of data. Liao R and Ma QZ performed bioinformatics and statistical analyses. All authors have read and approved the final manuscript.
Ethical approval
Because animal and human experiments were not involved in conducting or in the design of this study, there was no ethical statement.
Supplemental Material
Download ()Acknowledgements
We want to thank TCGA, GEO, TIMER and cBioPortal for free access of their database. We are grateful to Lei Qiu for English corrections.
Supplementary material
Supplemental data for this article can be accessed here
Disclosure statement
No potential conflict of interest was reported by the author(s).
Data availability statement
Data subject to third-party restrictions. The data were obtained from TCGA(https://tcga-data.nci.nih.gov/tcga/).
Additional information
Funding
Related Research Data
References
- Wittekind C, Compton CC, Greene FL, et al. TNM residual tumor classification revisited. Cancer. 2002;94(9):2511–2516.
- Galon J, Costes A, Sanchez-Cabo F, et al. Type, density, and location of immune cells within human colorectal tumors predict clinical outcome. Science. 2006;313(5795):1960–1964
- Dienstmann R, Mason MJ, Sinicrope FA, et al. Prediction of overall survival in stage II and III colon cancer beyond TNM system: a retrospective, pooled biomarker study. Ann Oncol. 2017;28(5):1023–1031.
- Meyers BM, Cosby R, Quereshy F, et al. Adjuvant Chemotherapy for Stage II and III Colon Cancer Following Complete Resection: a Cancer Care Ontario Systematic Review. Clin Oncol (R Coll Radiol). 2017;29(7):459–465.
- Yazdanifar M, Barbarito G, Bertaina A, et al. gammadelta T Cells: the Ideal Tool for Cancer Immunotherapy. Cells. 2020;9(5):1305.
- Gentles AJ, Newman AM, Liu CL, et al. The prognostic landscape of genes and infiltrating immune cells across human cancers. Nat Med. 2015;21(8):938–945.
- Rong L, Li K, Li R, et al. Analysis of tumor-infiltrating gamma delta T cells in rectal cancer. World J Gastroenterol. 2016;22(13):3573–3580.
- Silva-Santos B, Mensurado S, Coffelt SB. gammadelta T cells: pleiotropic immune effectors with therapeutic potential in cancer. Nat Rev Cancer. 2019;19(7):392–404.
- Sebestyen Z, Prinz I, Dechanet-Merville J, et al. Translating gammadelta (gammadelta) T cells and their receptors into cancer cell therapies. Nat Rev Drug Discov. 2020;19(3):169–184.
- Liu Y, Zhang C. The Role of Human gammadelta T Cells in Anti-Tumor Immunity and Their Potential for Cancer Immunotherapy. Cells. 2020;9(5):1206.
- Uryvaev A, Passhak M, Hershkovits D, et al. The role of tumor-infiltrating lymphocytes (TILs) as a predictive biomarker of response to anti-PD1 therapy in patients with metastatic non-small cell lung cancer or metastatic melanoma. Med Oncol. 2018;35(3):25.
- Herbst RS, Soria JC, Kowanetz M, et al. Predictive correlates of response to the anti-PD-L1 antibody MPDL3280A in cancer patients. Nature. 2014;515(7528):563–567.
- Halama N, Michel S, Kloor M, et al. Localization and density of immune cells in the invasive margin of human colorectal cancer liver metastases are prognostic for response to chemotherapy. Cancer Res. 2011;71(17):5670–5677.
- Xiang Z, Li J, Song S, et al. A positive feedback between IDO1 metabolite and COL12A1 via MAPK pathway to promote gastric cancer metastasis. J Exp Clin Cancer Res. 2019;38(1):314.
- Conrad C, Gotte M, Schlomann U, et al. ADAM8 expression in breast cancer derived brain metastases: functional implications on MMP-9 expression and transendothelial migration in breast cancer cells. Int J Cancer.2018;142(4):779-791 .
- Romagnoli M, Mineva ND, Polmear M, et al. ADAM 8 expression in invasive breast cancer promotes tumor dissemination and metastasis. EMBO Mol Med. 2014;6(2):278–294.
- Dong F, Eibach M, Bartsch JW, et al. The metalloprotease-disintegrin ADAM8 contributes to temozolomide chemoresistance and enhanced invasiveness of human glioblastoma cells. Neuro Oncol. 2015;17(11):1474–1485.
- Wildeboer D, Naus S, Amy Sang QX, et al. Metalloproteinase disintegrins ADAM8 and ADAM19 are highly regulated in human primary brain tumors and their expression levels and activities are associated with invasiveness. J Neuropathol Exp Neurol. 2006;65(5):516–527.
- Huang J, Bai Y, Huo L, et al. Upregulation of a disintegrin and metalloprotease 8 is associated with progression and prognosis of patients with gastric cancer. Transl Res. 2015;166(6):602–613.
- Schlomann U, Koller G, Conrad C, et al. ADAM8 as a drug target in pancreatic cancer. Nat Commun. 2015;6(1):6175.
- Zhang W, Wan M, Ma L, et al. Protective effects of ADAM8 against cisplatin-mediated apoptosis in non-small-cell lung cancer. Cell Biol Int. 2013;37(1):47–53.
- Hernandez I, Moreno JL, Zandueta C, et al. Novel alternatively spliced ADAM8 isoforms contribute to the aggressive bone metastatic phenotype of lung cancer. Oncogene. 2010;29(26):3758–3769.
- Yang Z, Bai Y, Huo L, et al. Expression of A disintegrin and metalloprotease 8 is associated with cell growth and poor survival in colorectal cancer. BMC Cancer. 2014;14(1):568.
- Miyauchi M, Koya J, Arai S, et al. ADAM8 Is an Antigen of Tyrosine Kinase Inhibitor-Resistant Chronic Myeloid Leukemia Cells Identified by Patient-Derived Induced Pluripotent Stem Cells. Stem Cell Reports. 2018;10(3):1115–1130.
- Li SQ, Wang DM, Zhu S, et al. The important role of ADAM8 in the progression of hepatocellular carcinoma induced by diethylnitrosamine in mice. Hum Exp Toxicol. 2015;34(11):1053–1072.
- Uen YH, Fang CL, Hseu YC, et al. VAV3 oncogene expression in colorectal cancer: clinical aspects and functional characterization. Sci Rep. 2015;5(1):9360.
- Hanahan D, Weinberg RA. Hallmarks of cancer: the next generation. Cell. 2011;144:646–674.