
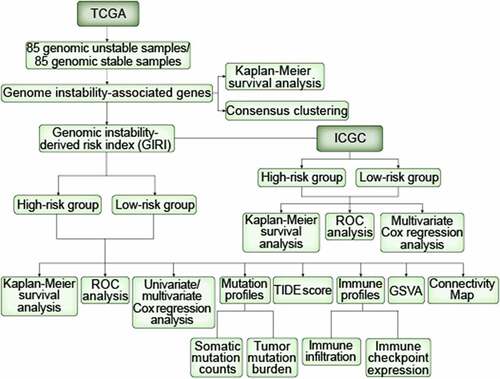
ABSTRACT
This study aims to originate agenomic instability-derived risk index (GIRI) for prognostic analysis of clear cell renal cell carcinoma (ccRCC) and explore the mutation characteristics, immune characteristics, and immunotherapy response defined by GIRI. Differentially expressed genome instability-associated genes were obtained from the genomic unstable (GU) group and the genomic stable (GS) group. Rigorous screening conditions were assigned to the screening of hub genes, which were then used to generate the GIRI through multivariate Cox regression analysis. The selected samples were assigned to the high-risk group or the low-risk group based on the median GIRI. Possible reasons for the prognostic differences in risk subgroups were explored from the aspects of mutation profiles, immune profiles, immunomodulators, and biological pathway activities. The possibility of immunotherapy response was predicted by Tumor Immune Dysfunction and Exclusion analysis results. The prediction of drugs that might reverse the expression profiles of the risk subgroups was discovered through theonnectivity Map (CMap). High-risk populations manifested poor overall survival than low-risk populations and were characterized by elevated cumulative mutation counts and tumor mutation burden. Also, high-risk populations had higher immune scores, immunomodulator (PD-1, CTLA4, LAG3, and TIGIT) expression, and genomic instability-related pathway activities, and were more likely to reap benefits from immunotherapy. Besides, we predicted several drugs (PI3K inhibitor, ATPase inhibitor, and phenylalanyl tRNA synthetase inhibitor) targeting risk subgroups. The well established GIRI was an effective cancer biomarker for predicting ccRCC prognosis and provided apotential reference value for identifying immunotherapy response.
Graphical abstract
Introduction
Renal cell carcinoma (RCC) is one of the malignant tumors of the urinary system, with tumors being most frequent in renal parenchyma [Citation1]. Clear cell RCC (ccRCC) is the most common subtype, encompassing 70% to 80% of RCC [Citation1]. Surgical resection is currently the mainstay of RCC therapy, but about 30% of patients will experience postoperative metastasis [Citation2]. The overall survival rate of advanced RCC has improved in recent years due to the emergence of new methods such as molecular targeted therapy (tyrosine kinase inhibitors and mTOR inhibitors) and immunotherapy [Citation3]. RCC has obvious heterogeneity in different histopathology, which limits the prognostic prediction of patients [Citation4]. The existence of drug resistance after the use of targeted therapy limits the long-term prognostic benefit of patients [Citation5]. Besides, in the actual clinical application of immune checkpoint blockade (ICB) therapy, only aminority of patients benefit from this emerging therapy, and the criteria for predicting responsiveness are not yet complete [Citation6]. In the application of tumor mutation burden (TMB) to predict the response to immunotherapy, renal cancer manifested an exception as the study of the IMmotion 150 trial showed that the moderated TMB in RCC has limited benefit in predicting the clinical response of patients to the PD-L1 inhibitor atezolizumab [Citation7]. And the application value of using the abundance of CD8+ Tcells in RCC to predict ICB therapy response remains to be verified [Citation6]. Therefore, it is of positive significance to provide possible and new biomarkers for the prognostic stratification and ICB therapy responsiveness of ccRCC.
Genome instability arises from accidental mutations during normal physiological activities such as replication, division, and cell self-repair [Citation8]. Genomic instability has been considered to be adriving factor in tumor initiation with prognostic significance in patient outcomes [Citation9,Citation10]. The hallmarks of cancer obtained based on genome instability, including immortality, anti-apoptosis, angiogenesis, invasion and metastasis, metabolic reprogramming, and immune escape, have caused difficulties in tumor treatment [Citation11]. Protein coding genes have shown key roles in genomic stability. The mismatch repair system maintains genome stability by identifying and eliminating DNA replication errors [Citation12]. Studies have shown that mismatch repair genes such as mutL homolog 1 (hMLH1) and mutS homolog 3 (hMSH3) are down-regulated in RCC tissues [Citation13]. Von Hippel–Lindau (VHL), the most frequently mutated gene in RCC, is involved in facilitating the proper spindle orientation and maintaining chromosome stability [Citation14]. The damage to the repair pathway of homologous recombination caused by the inactivation of the VHL function illustrates its important role in maintaining the genomic stability of RCC [Citation15]. Recently, Pu etal. reported that there are several correlations between genomic instability caused by genomic stress and anti-tumor immunity, and proposed the idea of predicting ICB therapy response through the state of genomic stress [Citation16]. However, the research of genomic instability-derived risk index (GIRI) in ccRCC has not been reported.
In this research, we hypothesized that GIRI is associated with ccRCC overall survival and ICB therapy response. Genome instability-associated genes were obtained from the currently available gene transcription profiles and mutation profiles, which were aimed at their use for constructing GIRI through bioinformatics methods. Then, the correlation between GIRI subtypes and clinical outcomes was explored to clarify the potential application value of GIRI as abiomarker of ccRCC.
Materials and Methods
Data collection
Two public databases, including the Cancer Genome Atlas (TCGA, https://tcga-data.nci.nih.gov/tcga/) and International Cancer Genome Consortium (ICGC, http://www.icgc.org), were used to obtain the data needed for this study. Specifically, information about the transcriptome data and somatic mutation profiles of 539 ccRCC samples was taken from the TCGA, and 91 ccRCC samples were obtained from the ICGC.
Identification of genes related to genomic instability from TCGA samples
For TCGA samples, only 337 samples contained both transcriptome data and somatic mutation data. Included ccRCC samples were ranked in descending order of somatic mutation counts. The first 25% of the samples were assigned to the genomic unstable (GU) group, and the last 25% of the samples were assigned to the genomic stable (GS) group. Before implementing analysis between the two groups, we filtered the genes with the condition of median absolute deviation (MAD) ≥ 0.5. Then, the ‘Limma’ package was used for differential expression analysis between GS and GU groups. Genome instability-associated genes (GAGs) were identified using afalse discovery rate (FDR) adjusted p< 0.05 and |log fold change (FC)| > 0.6.
Identification of TCGA ccRCC subclasses
GAGs with prognostic significance were further identified by Kaplan-Meier survival analysis and univariate Cox proportional hazards regression analysis. Then, candidate GAGs were included in the consensus clustering analysis only if p< 0.05 were satisfied. Based on the candidate GAGs expression profiles, we completed the unsupervised consensus clustering of 337 ccRCC patients through the Rpackage ‘ConsensusClusterPlus’ and identified subgroups with similar profile distributions. The clustering method evaluated the size of unsupervised classes in the form of displaying quantitative and visible evidence. Then, we used the k-means algorithm and defined the maximum value of Kas 9 (maxK = 9), and showed the variation trend of each cluster through the cumulative distribution function (CDF) plot derived from the algorithm. To show the clinical characteristics of the TCGA subclasses, we used the Rpackage ‘pheatmap’.
Generation of agenomic instability-derived risk index for prognosis prediction
In our research, we chose to determine atraining set (n = 271), atest set (n = 268), and an entire set (n = 539) based on the TCGA samples due to its more complete prognostic information. The independent external dataset downloaded from ICGC (n = 91) was regarded as averification set to test the prediction accuracy of our analysis results. We introduced the ‘Combat’ function to eliminate technical bias between platforms to normalize the data. The candidate GAGs were further screened by the least absolute shrinkage and selection operator (LASSO) Cox regression analysis. Hub GAGs for generating genomic instability-derived risk index (GIRI) were finally determined by multivariate Cox regression analysis, using Akaike Information Criterion (AIC) for bi-level selection. Correspondingly, the GIRI of each ccRCC sample was calculated, using the expression value and regression coefficient of the hub GAGs. We selected the median GIRI of the training set to decide high-risk and low-risk groups. The R‘survival’ package evaluated the OS differences between high- and low-risk index subtypes with the log-rank test. Receiver operating characteristic (ROC) curves were yielded for each parameter to obtain the area under the ROC curve (AUC) and to evaluate whether GIRI was more appropriate than other clinical parameters (age, gender, tumor grade, clinical stage). Univariate and multivariate Cox regression analyses were used to clarify the prognostic significance of GIRI and other conventional clinical parameters (age, gender, tumor grade, clinical stage) in predicting overall survival (OS). Similarly, we also explored the differences in risk index among different clinical subgroups, including genomic instability-associated subclasses, age, tumor grade, clinical stage, vital status, and cancer status.
Identification of mutation profiles and immune profiles of risk subgroups
The tumor immune microenvironment is of great implication to the patient outcomes and is regulated by multiple infiltrating immune cell subtypes, including dendritic cells, Blymphocytes, Tlymphocytes, and macrophages [Citation17]. The higher clonal indel mutation frequency in renal cell carcinoma is associated with neoantigen enrichment and CD8+ Tcell activation [Citation18], which has been shown to contribute to improved immune system recognition performance and ICB therapy response [Citation19,Citation20]. Given the differences in OS of risk subgroups, we explored the differential immune profiles and mutation profiles between TCGA subgroups from multiple aspects. Specifically, we compared the differences in cumulative mutation counts and TMB between risk subgroups through the Wilcox test. We acquired the immune score of each sample in the application of the ESTIMATE algorithm; besides, we further analyzed the potential relationship between subgroups and the expression of multiple immune checkpoint molecules. Next, we introduced anovel method called Immune Cell Abundance Identifier (ImmuCellAI) to estimate the infiltration abundance of 24 immune cell populations (18 T-cell subtypes, Bcell, monocyte cell, macrophage cell, NK cell, neutrophil cell, and dendritic cell) based on the gene expression matrix (http://bioinfo.life.hust.edu.cn/ImmuCellAI/) [20]. ICB therapy has proven to be an advantageous way to improve the prognosis of cancer. To predict the responsiveness of the risk subgroups defined by GIRI to ICB therapy, we quantified the TIDE score on the Tumor Immune Dysfunction and Exclusion (TIDE) website (http://tide.dfci.harvard.edu/), which was used to assess the likelihood of patients benefiting from ICB therapy [Citation21]; besides, we also obtained the microsatellite instability (MSI) score, Tcell dysfunction score, and Tcell exclusion score.
Characterization of risk subgroups
We counted the clinicopathological characteristics associated with the prognosis of each sample in the subgroups. The expression levels of highly mutated genes in clear cell renal carcinoma were extracted and the median value was used to characterize the high and low expression samples. Then, we visualized the distribution characteristics of the above variables in the risk subgroups, and the p-value was originated from the chi-square test.
Gene set variation analysis (GSVA)
GSVA, anon-parametric and unsupervised enrichment method, quantifies variations in gene set activity based on transcription profiles. Next, we obtained the activity scores of the Kyoto Encyclopedia of Genes and Genomes (KEGG) biological pathways and identified differential pathways between risk subgroups based on limma’s t-test. Only representative pathways were displayed in the heatmap, and the filter criteria were defined as adjusted p-value < 0.05.
Clinical correlation analysis of hub genes
Overall survival curves were produced by the Kaplan-Meier survival analysis and the discrepancies in OS between high and low expression groups were identified by the log-rank test. To further characterize the connection between gene expression and clinical prognosis, we used the Wilcox test or Kruskal-Wallis test to detect differences in gene expression of clinicopathological subclasses, namely age, tumor stage, and tumor grade.
Prediction of small molecule drugs
At the end of this study, we used the online analysis tool Connectivity Map (CMap) to predict possible drugs targeting genomic instability-related pathways based on the top 100 genes with the highest specific expression (FDR p-value < 0.001, |log2FC| > 0.6).
Statistical analysis
All statistical analysis and processing procedures were completed in Rversion 4.0.0. The Rsoftware package ‘survival’ completed all survival probability analyses. Generally, the statistical p-value between multiple groups was calculated by the Kruskal-Wallis test, and the statistical p-value between the two groups was calculated by the Wilcox test. Differences in the distribution of clinical variables between risk subgroups were identified by the chi-square test. The identification of differential pathway activities and differential expression analysis were completed according to limma’s t-test. Correlation analysis was completed by the Spearman nonparametric test.
Results
In this study, we aimed to construct aGIRI to predict the overall survival and ICB therapy response of ccRCC patients. We first performed the selection of differentially expressed genes between GU and GS groups. Subsequently, we identified two genes (TBC1D1 and PLCL1), which were used to construct the GIRI through multivariate Cox regression analysis. The differences in somatic mutation counts, TMB levels, clinical features, immune infiltration, immune checkpoint expression, and TIDE scores based on the subtypes defined by the median GIRI were compared. Functional enrichment analysis was used to explore subgroup-specific biological pathways. CMap was also performed to explore potential drugs that may reverse the expression profiles of risk subgroups.
Identification of genomic instability-associated genes and subclasses
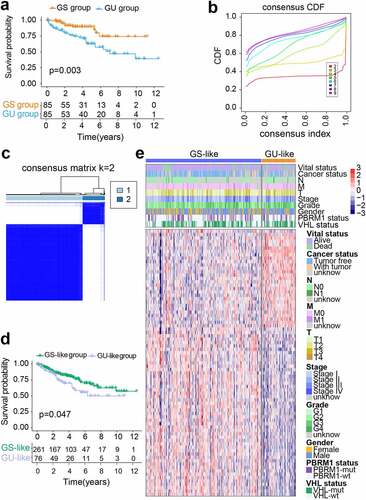
Detailed information about the cumulative mutation counts of 337 TCGA samples was shown in Table S1. On this basis, we defined the GS group (n = 85) and the GU group (n = 85). We found apoor OS in the GU group through the Kaplan-Meier method (p= 0.003; ). Subsequently, 414 differentially expressed genes (also denoted as GAGs) were screened between the GS group and the GU group, using the ‘limma’ Rpackage. Atotal of 176 GAGs were upregulated and 238 GAGs were downregulated in the GU group (Table S2). After performing multiple preprocessing as described before, we retained 108 GAGs and performed consensus clustering on TCGA ccRCC samples based on GAGs expression profiles (Table S3). The Rpackage ‘ConsensusClusterPlus’ completed the cluster analysis, and the size of the subclasses ranged from two to nine (). Considering the CDF curve and the size of each cluster, we finally decided to divide the TCGA samples into two subclasses (). Moreover, when the value of kwas set to 2, the consensus matrix heatmap showed sharp boundaries, suggesting steady sample clustering and evident intra-group correlation. We compared the median cumulative mutation counts of the two subclasses and redefined the genomic unstable (GU)-like group (n = 76) and the genomic stable (GS)-like group (n = 261) (p= 0.002; Figure S1a). Also, we found that the TMB of the GU-like group was higher than that of the GS-like group (p= 0.002; Figure S1b). In terms of survival outcome, the GU-like group showed apoor prognosis (p= 0.047; ). We then identified 79 genes specifically expressed in subclasses (; Table S4). Our results showed that the two molecular subclasses of ccRCC can be effectively distinguished based on the genomic instability-associated gene expression profiles.
Figure 1. Differentiation of GAGs-based molecular characteristic clusters of ccRCC. GAGs, genomic instability-associated genes. ccRCC, clear cell renal cell carcinoma. (a) Kaplan-Meier survival curves of the genomic stable (GS) group and the genomic unstable (GU) group. (b) Consensus CDF. (c) Consensus clustering matrix of 337 TCGA samples for k= 2. The samples were grouped into the genomic stable (GS)-like group and the genomic unstable (GU)-like group. (d) Kaplan-Meier survival curves of subclasses in consensus clustering. (e) Heatmap characterized by subclass-specific genes
Identification of genomic instability-derived risk index (GIRI)
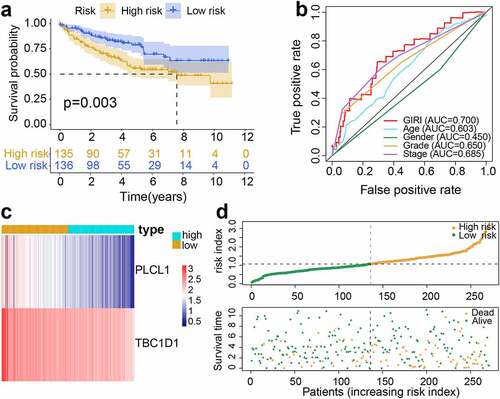
The 108 differentially expressed GAGs with prognostic significance derived from the genomic instability subclasses were regarded as seed genes for the following GIRI construction. We subsequently identified 14 GAGs from the seed genes, which were also considered to have potential significance in predicting OS in the ICGC dataset (Table S5). To improve the robustness and accuracy of GAGs selection, we performed LASSO regression analysis and chose eight GAGs (ADGRF5, ANO3, GDF7, MYH14, PLCL1, RFTN2, TBC1D1, and ZFP28) for further identification (Figure S2). The training set and the test set were randomly generated at aratio of 5:5. No differences were observed between the two sets with regard to age (p= 0.589), gender (p= 0.585), tumor grade (p= 0.607), stage (p= 0.420), TNM-classification (p= 0.453; p= 0.429; p= 0.828), vital status (p= 0.521), and cancer status (p= 0.465) (Table S6). We implemented the multivariate Cox regression analysis and retained two GAGs using bi-level selection, and then used gene expression values and regression coefficients to calculate comparable GIRI: GIRI = PLCL1*(−0.4744172) + TBC1D1*(−0.5117152) (). High-risk samples and low-risk samples were identified based on the median risk index of the training set. According to this grouping standard: the training set was composed of the high-risk group (n = 135) and the low-risk group (n = 136); the test set was composed of the high-risk group (n = 130) and the low-risk group (n = 138); the entire set was composed of the high-risk group (n = 265) and the low-risk group (n = 274); the verification set was composed of the high-risk group (n = 35) and the low-risk group (n = 56). For the training set, the KM curve proved the poor prognosis of the high-risk group (p= 0.003; ). The area under the ROC curve (AUC) proved that GIRI has better prognostic predictive performance than other clinical factors (). The synergistic changes in gene expression and GIRI were shown in . showed the vital status of each sample. Also, we found that the cumulative mutation counts and TMB of the high-risk group were higher than that of the low-risk group (Figure S1c, d).
Table 1. Multivariate Cox regression analysis
Figure 2. Construction of genomic instability-derived risk index (GIRI) for patients with ccRCC in the training set. (a) Kaplan-Meier survival plot of the high-risk GIRI and the low-risk GIRI. (b) Comparison of time-dependent receiver operating characteristic curves among the GIRI, age, gender, tumor grade, and clinical stage. (c) Expression characteristics of genes. (d) Distribution of GIRI and vital status
The strong prognostic prediction ability of the GIRI
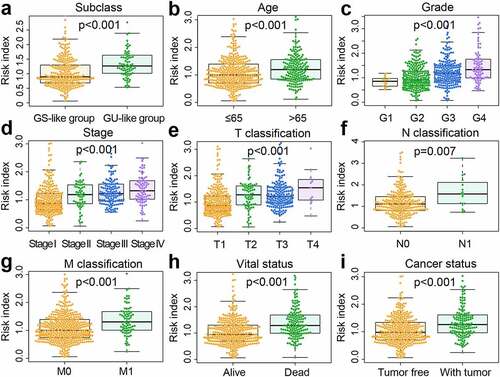
To further test the predictive potential of the GIRI, we performed the same analysis on the test set and the entire set. For the test set, the OS of the high-risk ccRCC was worse than that of the low-risk ccRCC (p< 0.001; ). By computing the AUC of age, gender, tumor grade, clinical stage, and GIRI, we found that the AUC of GIRI (0.693) was slightly lower than that of the clinical stage (0.735) (). The gene expression and vital status of the risk subgroups were shown in . Also, we found that the cumulative mutation counts and TMB of the high-risk ccRCC were higher than that of the low-risk ccRCC (Figure S1e, f). For the entire set, the high-risk ccRCC manifested apoor OS (p< 0.001; ). The ROC curve analysis of GIRI in the entire set produced results consistent with the test set (). The gene expression and vital status of the risk subgroups were shown in . Compared with the low-risk ccRCC, high-risk ccRCC had higher cumulative mutation counts and TMB (Figure S1g, h). For the verification set from ICGC, poor OS was observed in the high-risk group (p< 0.001; Figure S3a). ROC curve analysis for GIRI in the verification set showed an AUC of 0.643 (Figure S3b). We also showed the vital status and gene expression trends of the risk subgroups (Figure S3c). In the multivariate Cox regression analysis, some samples with missing clinicopathological data were removed, the results revealed that the GIRI was significantly associated with OS in TCGA and ICGC datasets when adjusted for age sex, and clinicopathological characteristics (; Figure S3d). We grouped samples according to different baseline characteristics, including age (≤ 65 and > 65), gender (male and female), grade (G1-2 and G3-4), stage (stage I-stage II and stage III-stage IV), VHL status (VHL-wt/- mutant), and PBRM1 status (PBRM1-wt/- mutant). Kaplan-Meier survival analysis proved the OS differences of GIRI subtypes in multiple stratified subgroups, indicating that age (> 65 years & high GIRI vs. > 65 years & low GIRI, p= 0.034; ≤ 65 years & high GIRI vs. ≤ 65 years & low GIRI, p< 0.001), sex (male & high GIRI vs. male & low GIRI, p= 0.002; female & high GIRI vs. female & low GIRI, p< 0.001), tumor grade (G1-2 & high GIRI vs. G1-2 & low GIRI, p= 0.042; G3-4 & high GIRI vs. G3-4 & low GIRI, p= 0.004), advanced clinical stage (stage I–II & high GIRI vs. stage I–II & low GIRI, p= 0.300; stage III–IV & high GIRI vs. stage III–IV & low GIRI, p= 0.001), VHL status (VHL-mut & high GIRI vs. VHL-mut & low GIRI, p= 0.007; VHL-wt & high GIRI vs. VHL-wt & low GIRI, p< 0.001), and PBRM1 status (PBRM1-mut & high GIRI vs. PBRM1-mut & low GIRI, p= 0.002; PBRM1-wt & high GIRI vs. PBRM1-wt & low GIRI, p< 0.001) did not affect the robustness of GIRI in OS prediction (). Next, we further explored the differential levels of risk index in different clinical groups (). In the two subclasses of consensus clustering, the risk index was significantly different: the GU-like group with poor prognosis ranked higher, and the GS-like group with favorable prognosis ranked lower (p< 0.001). Elderly patients (age > 65 years) manifested higher risk index compared to patients ≤ 65 years (p< 0.001). Patients with more advanced tumor grades (p< 0.001) or stages (p< 0.001) tended to score higher risk index, and the risk index of the survival group was significantly lower than that of the death group (p< 0.001). The risk index of patients who survived with renal tumors was also higher than that for patients who exhibited tumor-free survival (p< 0.001).
Table 2. Univariate and Multivariate Cox regression analysis of the correlation of GIRI with OS among TCGA patients
Figure 3. Performance validation of genomic instability-derived risk index (GIRI). Kaplan-Meier survival plot of the high-risk GIRI and the low-risk GIRI in the test set (a) and the entire set (d). Comparison of time-dependent receiver operating characteristic curves among the GIRI, age, gender, tumor grade, and clinical stage in the test set (b) and the entire set (e). Distribution characteristics of gene expression, GIRI, and vital status between high-risk and low-risk groups in the test set (c) and the entire set (f)
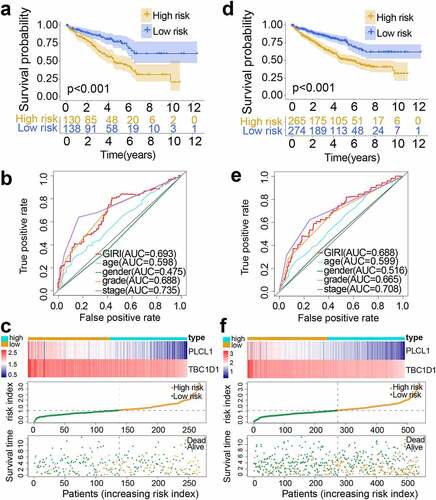
Figure 4. Stratified survival analysis of genomic instability-derived risk index (GIRI) subtypes in different clinical subgroups. Samples were classified according to age (a), gender (b), tumor grade (c), clinical stage (d), PBRM1 status (e), and VHL status (f). PBRM1, polybromo 1. VHL, von Hippel-Lindau tumor suppressor
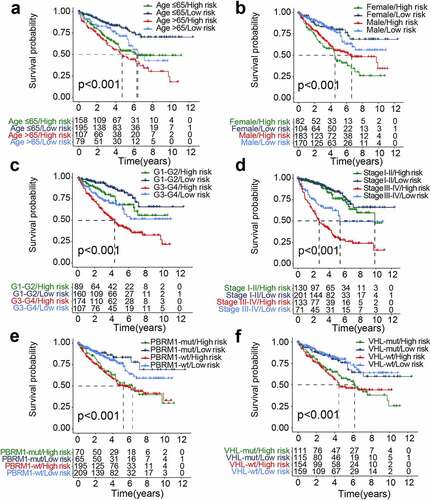
Figure 5. The differential distribution of the genomic instability-derived risk index (GIRI) in each clinical subgroup. TCGA samples stratified by genomic instability-associated subclasses (a), age (b), tumor grade (c), clinical stage (d), Tclassification (e), Nclassification (f), Mclassification (g), vital status (h), and cancer status (i)
Clinical characteristics in risk subgroups
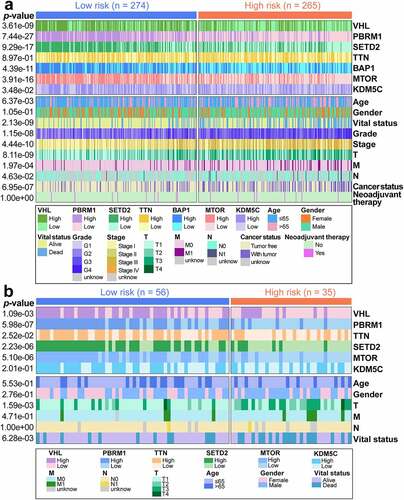
We then displayed the clinical variables related to risk subgroups and prognosis in the TCGA (; Table S7) and ICGC (; Table S8) datasets in the heatmap. The statistical results revealed some correlations between the selected clinical variables and TCGA risk subgroups. The high-risk group accounted for the majority of all deaths (p= 2.13e-09) and patients with tumor status (p= 6.95e-07). Besides, high-risk populations showed more advanced clinicopathological characteristics, including tumor grade (p= 1.15e-08), stage (p= 4.44e-10), and TMN-classification (p= 8.11e-09; p= 1.97e-04; p= 4.63e-02). Chi-square test revealed that elevated expression of VHL (p= 3.61e-09), PBRM1 (p= 7.44e-27), SETD2 (p= 9.29e-17), BAP1 (p= 4.39e-11), MTOR (p= 3.91e-16), and KDM5C (p= 3.48e-02) was associated with the low-risk group. No differences in TTN expression (p= 8.97e-01), gender (p= 1.05e-01), and neoadjuvant treatment history (p= 1.00e+00) were observed. Similarly, in ICGC risk subgroups, the high-risk group accounted for the majority of all deaths (p= 6.28e-03) and advanced T-classification (p= 1.59e-03), and elevated expression of VHL (p= 1.09e-03), PBRM1 (p= 5.98e-07), TTN (p= 2.52e-02), SETD2 (p= 2.23e-06), and MTOR (p= 5.10e-06) was associated with the low-risk group. Also, no differences in KDM5C expression (p= 2.01e-01), age (p= 5.53e-01), gender (p= 2.76e-01), M-classification (p= 4.71e-01), and N-classification (p= 1.00e+00) were observed.
Figure 6. The differential distribution of prognosis-associated clinical features in the risk subgroups. (a) Differences in clinicopathological characteristics and expression of highly mutated genes in TCGA samples. TCGA, The Cancer Genome Atlas. (b) Differences in clinicopathological characteristics and expression of highly mutated genes in ICGC samples. ICGC, International Cancer Genome Consortium. The statistical p-value was derived from the chi-square test
Differential mutation profiles and immune profiles of high-risk and low-risk patients
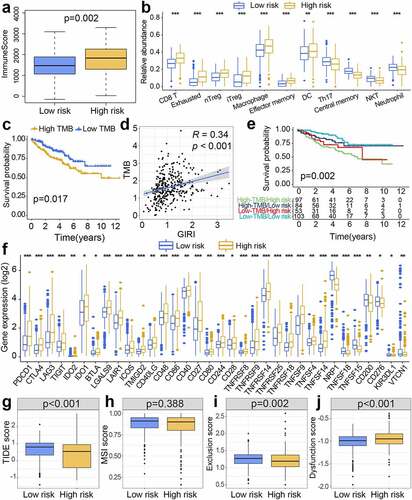
The identification of differences in immune score between high-risk and low-risk groups was done through the Wilcox test, and the high-risk group ranked higher in the immune score (p= 0.002; ). The method for obtaining the infiltration abundance of immune cell subtypes was as described above. Multiple statistical differences were observed between risk subgroups, with higher infiltration abundance of CD8+ Tcells, exhausted Tcells, nTreg, iTreg, macrophages, effector memory Tcells, and dendritic cells (DCs) for the high-risk group compared with the low-risk group (). Besides, the low-risk group manifested higher enrichment for Th17, central memory Tcells, natural killer T(NKT) cells, and neutrophils (). Differential information on the cumulative mutation counts and TMB in risk subgroups was described before. Concerning the differences in the prognosis of different TMB levels, we found that people with high TMB showed apoor prognosis (p= 0.017; ). The positive relationship between GIRI and TMB was presented by Spearman correlation analysis (R = 0.34, p< 0.001; ). We analyzed the synergistic interaction of TMB and GIRI in prognostic stratification, and stratified survival analysis revealed significant OS differences of GIRI subtypes in TMB subgroups (high TMB & high GIRI vs. high TMB & low GIRI, p= 0.031; low TMB & high GIRI vs. low TMB & low GIRI, p= 0.031; ). Subsequently, we studied the differential expression of immunomodulators in risk subclasses. Information on the 27 immunomodulators with higher expression in the high-risk population and the 7 immunomodulators with higher expression in the low-risk population was given in . The high-risk group ranked higher expression for PD-1, CTLA4, LAG3, TIGIT, IDO1, and IDO2 than the low-risk group. To predict whether patients will benefit from immunotherapy, we queried the TIDE website and obtained relevant scores. In the online analysis results, higher TIDE scores corresponded to the possibility of experiencing immune escape. In the risk subgroups of this work, the low-risk population ranked higher TIDE scores, indicating that this population may not benefit much from immunotherapy (p< 0.001; ). No differential MSI score was observed (p= 0.388; ). The low-risk group ranked higher Tcell exclusion score (p= 0.002; ), while the high-risk group ranked higher Tcell dysfunction score (p< 0.001; ).
Figure 7. Immunity-associated landscapes of TCGA samples. (a) Boxplot of immune scores for risk subgroups. (b) Tumor-infiltrating immune cells with different infiltration abundance in the risk subgroups. (c) Kaplan-Meier survival analysis of low and high TMB patients. TMB, tumor mutation burden. (d) The positive correlation between GIRI and TMB was characterized by Spearman correlation analysis. GIRI, genomic instability-derived risk index. (e) Stratified survival analysis of GIRI subtypes in TMB subgroups. (f) Differentially expressed immune checkpoint molecules in the risk subgroups. *p< 0.05, **p< 0.01, ***p< 0.001. TIDE score (g), MSI score (h), Tcell exclusion score (i), and Tcell dysfunction score (j) between high-risk and low-risk groups. TIDE, tumor immune dysfunction and exclusion. MSI, microsatellite instability
Gene set variation analysis (GSVA)
The Rpackage ‘GSVA’ quantified the selected pathway information into comparable values. We then used the differential analysis function of the ‘limma’ package to identify biological pathways specific to risk subclasses, which represented pathways with higher activity scores in the corresponding subgroups. The difference comparison results revealed enriched autophagy and leukocyte transendothelial migration characteristics of the low-risk group. Notably, the p53 signaling pathway, multiple genomic instability-associated pathways (mismatch repair, nucleotide excision repair, cell cycle, DNA replication), and oxidative phosphorylation were related to the high-risk group ().
Figure 8. Gene set variation analysis (GSVA) and prognostic analysis of genes. (a) Heatmap of subgroup-specific KEGG biological pathways. The statistically adjusted p-value was derived from limma’s t-test. KEGG, Kyoto Encyclopedia of Genes and Genomes. (b) Kaplan-Meier survival analysis of different expression levels of TBC1D1 and PLCL1 in the TCGA dataset. TCGA, The Cancer Genome Atlas. (c) Kaplan-Meier survival analysis of different expression levels of TBC1D1 and PLCL1 in the ICGC dataset. ICGC, International Cancer Genome Consortium. The differential levels of gene expression stratified by age (d), tumor grade (e), and clinical stage (f). *p< 0.05, **p< 0.01, ***p< 0.001
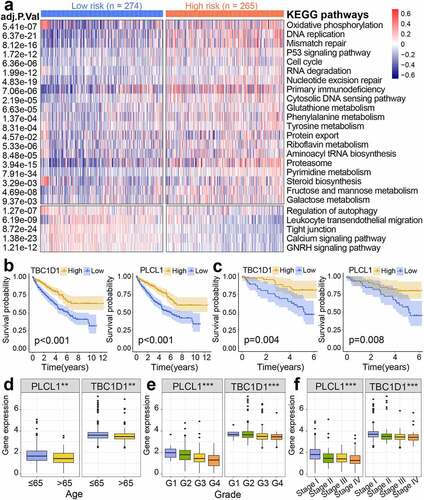
Prognostic significance of genes
Kaplan-Meier survival analysis revealed the correlation between the expression level of genes and survival probability. The decreased expression of PLCL1 and TBC1D1 corresponded to apoor prognosis both in TCGA () and ICGC datasets (). We then further visualized the differential expression of genes in different clinical baseline characteristics (). Decreased gene expression was associated with more advanced clinicopathological features (tumor grade and clinical stage) and advanced age (age >65 years).
Determination of drugs
After characterizing the subclasses related to the genomic instability characteristics through the GIRI, we chose to query the CMap database with representative differentially expressed genes to obtain potential small molecule drugs targeting the subclasses (Table S9). As aresult, 29 drugs with the ability to repress the differential expression characteristics were identified from the CMap website, and 28 mechanisms of action were revealed from the mode of action (MoA) analysis (). That is, three drugs (KU-0060648, PIK-90, and PI-828) represented the MoA of PI3K inhibitor; KU-0060648 and NU-7441 represented the MoA of DNA dependent protein kinase inhibitor; Helveticoside and digitoxin represented the MoA of ATPase inhibitor. Besides, atotal of 9 compounds represented the following 9 mechanisms: glucocorticoid receptor agonist, protein tyrosine kinase inhibitor, PARP inhibitor, progesterone receptor agonist, cholinesterase inhibitor, adenosine receptor antagonist, thromboxane receptor antagonist, glutamate receptor antagonist, and phenylalanyl tRNA synthetase inhibitor.
Figure 9. Prediction of potential drugs for risk subgroups
Discussion
RCC accounts for 2%-3% of all human tumors, with an upward trend in its incidence [Citation22]. The prognostic status of RCC patients shows obvious heterogeneity, and there are disadvantages in using asingle method to predict clinical outcomes. The rise of bioinformatics tools and high-throughput sequencing technologies has deepened and facilitated our in-depth identification of tumor prognostic biomarkers. Genomic instability serves as one of the driving forces behind tumorigenesis and continued tumor growth, which may be triggered by genetic and epigenetic alterations in cells [Citation23,Citation24]. Although immunotherapy has brought great advantages to improving prognosis, only some patients benefit from the treatment. Moreover, biomarkers based on genomic instability characteristics for predicting ccRCC clinical outcome and ICB therapy response remain poorly reported. Therefore, given the possible connection between genomic instability and anti-tumor immunity, we attempted to find areliable biomarker derived from genomic instability.
In this analysis, we obtained genome instability-associated genes (GAGs) and then identified two ccRCC clusters with different genome instability characteristics by consensus cluster analysis based on GAGs with prognostic significance, and the prognostic analysis showed the survival differences of the two clusters. Subsequently, we chose two hub genes and then developed agenomic instability-derived risk index (GIRI) to predict the prognosis. The TCGA and ICGC cohorts confirmed the robustness of the GIRI in predicting overall survival. We also confirmed that the risk index ranked higher in more advanced clinicopathological characteristics groups and worse prognostic groups.
Phospholipase C-related catalytically inactive protein (PRIP) is officially designated as PLCL, including PLCL1 and PLCL2 [Citation25]. PRIP is believed to bind to an autophagy-associated initiator, microtubule-associated protein 1 light chain 3 (LC3), thereby limiting autophagosome formation [Citation26]. Autophagy involves the degradation process, which has necessary implications for keeping cellular homeostasis and genomic stability [Citation27,Citation28]. However, abundant evidence reveals that although autophagy has apositive effect in maintaining homeostasis, its tumor suppressor and tumor-promoting effects in cancer have not been fully elucidated [Citation29–32]. Moreover, PLCL1 has been demonstrated in ccRCC to reduce tumor cell volume and inhibit tumor progression by up-regulating uncoupling protein 1 (UCP1) and promoting lipid browning [Citation33]. We also identified another hub gene, namely TBC1 domain family member 1 (TBC1D1). Heterozygous mutations of TBC1D1 were found in multiple patients with congenital anomalies of the kidneys and urinary tract (CAKUT), and severe CAKUT phenotype appeared [Citation34]. Also, the mutant TBC1D1 was identified as acandidate for the obesity disease predisposition locus [Citation35]. These analysis results suggested that the well established GIRI not only has astrong prognostic predictive potential but also can be effectively used as agenomic instability-associated biomarker for ccRCC patients.
We found that the expression of multiple driver genes such as VHL, BAP1, PBRM1, KDM5C, and SETD2 decreased in high-risk populations, which were confirmed to have tumor suppressor potential in ccRCC [Citation36,Citation37]. For example, researchers reported that the loss of BAP1 and PBRM1 expression in early stage ccRCC represents tumor recurrence and weak prognosis [Citation38]. Similarly, the decreased expression of VHL was correlated with apoor prognosis [Citation39]. Furthermore, the risk subgroups defined by GIRI were also proved to have widely differing main clinical characteristics, with alarger share of advanced age, pathological grades, and stages in high-risk populations. Age at diagnosis has been shown to have significant prognostic significance in RCC outcome [Citation40,Citation41]. Multiple study cohorts showed that tumor grades and TNM stages were important risk factors affecting patient prognosis [Citation42,Citation43]. After that, we explored the differential immune profiles and mutation profiles of the risk subtypes. Existing research has proved that there is an important connection between the initiation and progression of cancer and tumor immunity, proposing the implications of immunity on tumor prognosis [Citation44]. Tumor-infiltrating immune cells (TIICs) gradually embody their roles in regulating tumor prospects [Citation17]. There were multiple types of TIICs in the risk subtypes with different infiltration patterns, such as iTreg, nTreg, CD8+ Tcells, macrophages, DCs, neutrophils, NKT, and Th17. Regulatory Tcells (Tregs) are atype of cell with immunosuppressive function, and highly infiltrating Tregs in tumors are related to the poor prognosis of multiple malignant tumors [Citation45]. Highly infiltrated CD8+ Tcells in the tumors are considered to be an indicator of afavorable prognosis [Citation46]. There are extensively infiltrated CD8+ Tcells in kidney tumors [Citation47]. But studies have revealed that CD8+ Tcell infiltration poses the occurrence of poor prognosis in RCC [Citation48]. Moreover, although CD8+ Tcells in RCC show tumor immune recognition ability, their tumor-killing effects are present at aweak level [Citation49]. It is suggested that inhibitory cytokines in the tumor microenvironment act on dendritic cells (DCs), causing their dysfunction, thereby aggravating tumor immune escape [Citation50,Citation51]. The tumor suppressor or tumor-promoting properties of another differentially infiltrated Thelper 17 cells (Th17) in tumors have not been fully elucidated [Citation52]. The direct anti-tumor effect of NKT cells makes it one of the first-line defense forces against tumors [Citation53]. The differential infiltration TIIC subtypes and TIIC-mediated immunity likely interpret the differences in prognosis between the risk subpopulations. Therefore, it was speculated that the reasons for the poor prognosis of high-risk populations may in part be high infiltration of CD8+ Tcells, Tregs, and DCs, low infiltration of NKT, advanced age, poor pathological grade and stage, low expression levels of VHL, BAP1, PBRM1, KDM5C and SETD2, and relatively higher Tcell dysfunction score.
We found that the cumulative mutation counts and TMB of the high-risk population showed higher levels, which also partially hinted at the poor prognosis of this population. The loss-of-function mutation of PBRM1 reflects apositive effect on improving the response of metastatic RCC to anti-PD-1 treatment [Citation54]. In the stratified survival analysis, we found that the OS prediction performance of GIRI is not affected by TMB levels and PBRM1 status, suggesting the GIRI has the potential to be regarded as abiomarker for predicting ICB therapy response independently of PBRM1 status and TMB levels. Although Mcdermott etal. showed that TMB has limited benefit in the prediction of RCC immunotherapy response [Citation7]. The high expression of immune checkpoint molecules mainly appeared in high-risk populations, such as PD-1, CTLA4, LAG3, and TIGIT. Highly expressed PD-1 on the surface of activated Tlymphocytes in the tumor microenvironment is regarded as aT cell brake, and its binding to the PD-L1 ligand expressed on the surface of tumor cells triggers the reduction of tumor suppressor factors, thereby inhibiting the anti-tumor immune response and tumor-killing potential mediated by cytotoxic Tcells [Citation55,Citation56]. The immunosuppressive mechanisms of CTLA4 are also similar to PD-1 [Citation57]. This might explain the weak tumor-killing ability of CD8+ Tcells and higher Tcell dysfunction scores in high-risk populations. From the perspective of the differential distribution of TIDE scores, we speculated that the high-risk group defined by GIRI are more likely to benefit from ICB therapy. And arecent large-scale cohort study on ICB therapy for advanced RCC also proved that low-risk patients have less advantage from ICB therapy compared to high- or intermediate-risk patients who significantly yielded from ICB therapy (nivolumab plus ipilimumab) [Citation58]. It was speculated that ICB therapy-mediated relief of immunosuppression and restoration of tumor cell killing ability of Tcells may be the potential reasons why high-risk populations benefit from ICB therapy.
GSVA revealed that the poor prognosis of high-risk populations was associated with the increased activities of multiple DNA damage repair pathways (cell cycle, mismatch repair, DNA replication, and nucleotide excision repair), which were thought to be related to the phenomenon of genome instability [Citation59–63]. Moreover, oxidative phosphorylation is an important signaling crosstalk pathway in clear cell RCC [Citation64]. Finally, small molecule drugs such as NU-7441, PIK-90, fludrocortisone, megestrol, amonafide, and digitoxin identified based on differential expressed genes might provide some new insights in treatment for patients. Therefore, it was speculated that the established GIRI has good performance in predicting the prognosis and ICB therapy response of ccRCC.
Many previous studies have proposed risk indexes based on gene expression, in hopes of predicting ccRCC prognosis. You-Peng Zhang etal. have presented arisk signature of 18-lncRNA to perform the stratification and prediction of ccRCC prognosis [Citation65]. The 10-gene risk signature, which was highly associated with immune infiltration and immune checkpoint expression, acted as aprognostic factor of VHL-mutant patients [Citation66]. However, there are few risk signatures for the prediction of ICB therapy response. The introduction of ICB therapy is amilestone in the field of renal carcinoma treatment, but the clinical response is limited to apart of patients. For the first time, we considered the correlation between genome instability and prognosis and immune microenvironment, and then established aGIRI that can predict clinical outcome and ICB therapy response, and predicted small molecule drugs that may target risk subtypes. This was the main novelty of our work.
However, the limitations of this work must be disclosed: (I) The sample sizes of the external independent dataset are not sufficient, which may reduce the reliability of the prediction results; (II) The comparison results between risk subgroups based on GIRI only represent statistical differences, and their clinical significances need to be verified; (III) The results of the correlation between GIRI and tumor mutation burden are obtained through statistical data, and its inherent regulatory relationship is not yet clear; (IV) The differential immune profiles, mutation profiles and drug prediction of the risk subgroups are all predicted based on bioinformatics methods, and have not been fully verified in the actual clinical cohort; (V) More study is needed to explore the potential mechanisms and reasons of high-risk populations responding to ICB therapy.
Conclusion
In summary, we constructed and verified agenomic instability-derived risk index (GIRI). The GIRI was apotential prognostic biomarker for assessing the overall survival of clear cell renal cell carcinoma and might provide areference value for predicting the response of patients to ICB therapy.
Authors’ contributions
SW assisted in designing the project, analyzed data, completed the diagrams, interpreted the results, and wrote the manuscript. XL designed the project and revised the manuscript. All authors read and approved the final manuscript.
Highlights
Genomic instability-derived risk index (GIRI) could predict the ccRCC prognosis.
Patients with higher GIRI manifested alower survival rate.
The immune checkpoint expression levels in the GIRI subgroups were different.
GIRI could be used to predict immune checkpoint blockade therapy response.
Acknowledgements
We would like to thank the contributions of the TCGA and ICGC for providing free access to online data.
Disclosure statement
No potential conflict of interest was reported by the author(s).
Data availability statements
The data associated with this manuscript can be downloaded from The Cancer Genome Atlas database (TCGA, https://portal.gdc.cancer.gov/) and International Cancer Genome Consortium (ICGC, https://dcc.icgc.org/).
Supplementary material
Supplemental data for this article can be accessed here
Additional information
Funding
Related Research Data
References
- VasudevNS, SelbyPJ, BanksRE. Renal cancer biomarkers: the promise of personalized care. BMC Med. 2012;10(1):112.
- HsiehJJ, PurdueMP, SignorettiS, etal. Renal cell carcinoma. Nat Rev Dis Primers. 2017;3(1):17009..
- HuangJJ, HsiehJJ. The therapeutic landscape of renal cell carcinoma: from the dark age to the golden age. Semin Nephrol. 2020;40(1):28–41.
- CorreaAF, RuthKJ, Al-Saleem T, etal. Overall tumor genomic instability: an important predictor of recurrence-free survival in patients with localized clear cell renal cell carcinoma. Cancer Biol Ther. 2020;21(5):424–431..
- DuensingS, HohenfellnerM. Adjuvant therapy for renal-cell carcinoma: settled for now. Lancet. 2016;387(10032):1973–1974.
- XuW, AtkinsMB, McDermottDF. Checkpoint inhibitor immunotherapy in kidney cancer. Nat Rev Urol. 2020;17(3):137–150.
- McDermottDF, HuseniMA, AtkinsMB, etal. Clinical activity and molecular correlates of response to atezolizumab alone or in combination with bevacizumab versus sunitinib in renal cell carcinoma. Nat Med. 2018;24(6):749–757..
- CassidyLD, VenkitaramanAR. Genome instability mechanisms and the structure of cancer genomes. Curr Opin Genet Dev. 2012;22(1):10–13.
- CarterSL, EklundAC, KohaneIS, etal. Asignature of chromosomal instability inferred from gene expression profiles predicts clinical outcome in multiple human cancers. Nat Genet. 2006;38(9):1043–1048.
- HieronymusH, MuraliR, TinA, etal. Tumor copy number alteration burden is a pan-cancer prognostic factor associated with recurrence and death. Elife. 2018;7. DOI:10.7554/eLife.37294.
- HanahanD, WeinbergRA. Hallmarks of cancer: the next generation. Cell. 2011;144(5):646–674.
- KunkelTA, ErieDA. Eukaryotic mismatch repair in relation to DNA replication. Annu Rev Genet. 2015;49(1):291–313.
- DeguchiM, ShiinaH, IgawaM, etal. DNA mismatch repair genes in renal cell carcinoma. JUrol. 2003;169(6):2365–2371.
- HellMP, DudaM, WeberTC, etal. Tumor suppressor VHL functions in the control of mitotic fidelity. Cancer Res. 2014;74(9):2422–2431.
- MetcalfJL, BradshawPS, KomosaM, etal. K63-ubiquitylation of VHL by SOCS1 mediates DNA double-strand break repair. Oncogene. 2014;33(8):1055–1065.
- PuC, TaoS, XuJ, etal. Harnessing genomic stress for antitumor immunity. Antioxid Redox Signal. 2020. DOI:10.1089/ars.2020.8221
- GrivennikovSI, GretenFR, KarinM. Immunity, inflammation, and cancer. Cell. 2010;140(6):883–899.
- TurajlicS, LitchfieldK, XuH, etal. Insertion-and-deletion-derived tumour-specific neoantigens and the immunogenic phenotype: a pan-cancer analysis. Lancet Oncol. 2017;18(8):1009–1021..
- ShollLM, HirschFR, HwangD, etal. The promises and challenges of tumor mutation burden as an immunotherapy biomarker: aperspective from the international association for the study of lung cancer pathology committee. JThorac Oncol. 2020;15(9):1409–1424.
- MiaoYR, ZhangQ, LeiQ, etal. ImmuCellAI: aunique method for comprehensive T-cell subsets abundance prediction and its application in cancer immunotherapy. Adv Sci (Weinh). 2020;7(7):1902880.
- JiangP, GuS, PanD, etal. Signatures of Tcell dysfunction and exclusion predict cancer immunotherapy response. Nat Med. 2018;24(10):1550–1558.
- BarataPC, RiniBI. Treatment of renal cell carcinoma: current status and future directions. CA Cancer JClin. 2017;67(6):507–524.
- TysnesBB. Tumor-initiating and -propagating cells: cells that we would like to identify and control. Neoplasia. 2010;12(7):506–515.
- SieberOM, HeinimannK, TomlinsonIP. Genomic instability–the engine of tumorigenesis? Nat Rev Cancer. 2003;3(9):701–708.
- MatsudaM, TsutsumiK, KanematsuT, etal. Involvement of phospholipase C-related inactive protein in the mouse reproductive system through the regulation of gonadotropin levels. Biol Reprod. 2009;81(4):681–689.
- UmebayashiH, MizokamiA, MatsudaM, etal. Phospholipase C-related catalytically inactive protein, anovel microtubule-associated protein 1 light chain 3-binding protein, negatively regulates autophagosome formation. Biochem Biophys Res Commun. 2013;432(2):268–274.
- OnoratiAV, DyczynskiM, OjhaR, etal. Targeting autophagy in cancer. Cancer. 2018;124(16):3307–3318.
- BuW, HaoX, YangT, etal. Autophagy contributes to the maintenance of genomic integrity by reducing oxidative stress. Oxid Med Cell Longev. 2020;2020:2015920.
- BhutiaSK, MukhopadhyayS, SinhaN, etal. Autophagy: cancer’s friend or foe? Adv Cancer Res. 2013;118:61–95.
- LevyJ, TowersCG, ThorburnA. Targeting autophagy in cancer. Nat Rev Cancer. 2017;17(9):528–542.
- RybsteinMD, Bravo-San PJ, KroemerG, etal. The autophagic network and cancer. Nat Cell Biol. 2018;20(3):243–251.
- EvanGI, VousdenKH. Proliferation, cell cycle and apoptosis in cancer. Nature. 2001;411(6835):342–348.
- XiongZ, XiaoW, BaoL, etal. Tumor Cell “Slimming” regulates tumor progression through PLCL1/UCP1-mediated lipid browning. Adv Sci (Weinh). 2019;6(10):1801862..
- KosfeldA, KreuzerM, DanielC, etal. Whole-exome sequencing identifies mutations of TBC1D1 encoding a Rab-GTPase-activating protein in patients with congenital anomalies of the kidneys and urinary tract (CAKUT). Hum Genet. 2016;135(1):69–87..
- StoneS, AbkevichV, RussellDL, etal. TBC1D1 is acandidate for asevere obesity gene and evidence for agene/gene interaction in obesity predisposition. Hum Mol Genet. 2006;15(18):2709–2720.
- DizmanN, PhilipEJ, PalSK. Genomic profiling in renal cell carcinoma. Nat Rev Nephrol. 2020;16(8):435–451.
- NiuX, ZhangT, LiaoL, etal. The von Hippel-Lindau tumor suppressor protein regulates gene expression and tumor growth through histone demethylase JARID1C. Oncogene. 2012;31(6):776–786..
- DaCW, DaCI, FaresAF, etal. Prognostic impact of concomitant loss of PBRM1 and BAP1 protein expression in early stages of clear cell renal cell carcinoma. Urol Oncol. 2018;36(5):243.e1–243.e8.
- HognerA, KrauseH, JandrigB, etal. PBRM1 and VHL expression correlate in human clear cell renal cell carcinoma with differential association with patient’s overall survival. Urol Oncol. 2018;36(3):94.e1–94.e14.
- YusimI, MermershtainW, NeulanderE, etal. Influence of age on the prognosis of patients with renal cell carcinoma (RCC). Onkologie. 2002;25(6):548–550.
- SakaiI, MiyakeH, MuramakiM, etal. Significant impact of age at diagnosis on the prognosis of Japanese patients with pT1 renal cell carcinoma following surgical resection. BJU Int. 2012;109(5):695–699.
- KucukU, PalaEE, SezerO, etal. Significance of TNM staging, demographic and histologic features in predicting the prognosis of renal cell carcinoma. Acta Chir Belg. 2015;115(3):202–207.
- KeZB, ChenSH, ChenYH, etal. Risk factors for brain metastases in patients with renal cell carcinoma. Biomed Res Int. 2020;2020:6836234.
- VeselyMD, KershawMH, SchreiberRD, etal. Natural innate and adaptive immunity to cancer. Annu Rev Immunol. 2011;29(1):235–271.
- NishikawaH, SakaguchiS. Regulatory Tcells in tumor immunity. IntJCancer. 2010;127(4):759–767.
- FridmanWH, ZitvogelL, Sautes-Fridman C, etal. The immune contexture in cancer prognosis and treatment. Nat Rev Clin Oncol. 2017;14(12):717–734.
- ZhangS, ZhangE, LongJ, etal. Immune infiltration in renal cell carcinoma. Cancer Sci. 2019;110(5):1564–1572..
- DrakeCG, SteinMN. The immunobiology of kidney cancer. Jclin oncol. 2018;36(36):3547-+.
- SiskaPJ, BeckermannKE, MasonFM, etal. Mitochondrial dysregulation and glycolytic insufficiency functionally impair CD8 Tcells infiltrating human renal cell carcinoma. JCI Insight. 2017;2(12). DOI:10.1172/jci.insight.93411.
- PaluckaK, BanchereauJ. Cancer immunotherapy via dendritic cells. Nat Rev Cancer. 2012;12(4):265–277.
- FucikovaJ, Palova-Jelinkova L, BartunkovaJ, etal. Induction of tolerance and immunity by dendritic cells: mechanisms and clinical applications. Front Immunol. 2019;10(2393). DOI:10.3389/fimmu.2019.02393
- AsadzadehZ, MohammadiH, SafarzadehE, etal. The paradox of Th17 cell functions in tumor immunity. Cell Immunol. 2017;322:15–25.
- ShisslerSC, LeeMS, WebbTJ. Mixed signals: co-stimulation in invariant natural Killer T cell-mediated cancer immunotherapy. Front Immunol. 2017;8:1447.
- MiaoD, MargolisCA, GaoW, etal. Genomic correlates of response to immune checkpoint therapies in clear cell renal cell carcinoma. Science. 2018;359(6377):801–806.
- FifeBT, PaukenKE, EagarTN, etal. Interactions between PD-1 and PD-L1 promote tolerance by blocking the TCR-induced stop signal. Nat Immunol. 2009;10(11):1185–1192.
- KeirME, LiangSC, GuleriaI, etal. Tissue expression of PD-L1 mediates peripheral Tcell tolerance. JExp Med. 2006;203(4):883–895..
- BuchbinderEI, DesaiA. CTLA-4 and PD-1 pathways: similarities, differences, and implications of their inhibition. Am JClin Oncol. 2016;39(1):98–106.
- MotzerRJ, EscudierB, McDermottDF, etal. Survival outcomes and independent response assessment with nivolumab plus ipilimumab versus sunitinib in patients with advanced renal cell carcinoma: 42-month follow-up of arandomized phase 3 clinical trial. JImmunother Cancer. 2020;8(2). DOI:10.1136/jitc-2020-000891.
- HarfeBD, Jinks-Robertson S. DNA mismatch repair and genetic instability. Annu Rev Genet. 2000;34:359–399.
- MiyagawaK. Genetic instability and cancer. IntJHematol. 1998;67(1):3–14.
- Dominguez-Brauer C, ThuKL, MasonJM, etal. Targeting Mitosis in Cancer: emerging Strategies. Mol Cell. 2015;60(4):524–536.
- WangG, VasquezKM. Effects of replication and transcription on DNA structure-related genetic instability. Genes (Basel). 2017;8:1.
- MassagueJ. G1 cell-cycle control and cancer. Nature. 2004;432(7015):298–306.
- LaGoryEL, WuC, TaniguchiCM, etal. Suppression of PGC-1alpha is critical for reprogramming oxidative metabolism in renal cell carcinoma. Cell Rep. 2015;12(1):116–127..
- ZhangYP, ChengYB, LiS, etal. An epithelial-mesenchymal transition-related long non-coding RNA signature to predict overall survival and immune microenvironment in kidney renal clear cell carcinoma. Bioengineered. 2021;12(1):555–564.
- ZhangJ, YanA, CaoW, etal. Development and validation of a VHL-associated immune prognostic signature for clear cell renal cell carcinoma. Cancer Cell Int. 2020;20(1):584.