2,986
Views
15
CrossRef citations to date
0
Altmetric
Research Paper

Potential prognostic biomarkers related to immunity in clear cell renal cell carcinoma using bioinformatic strategy

, , , , & ORCID Icon
Pages 1773-1790 | Received 09 Mar 2021, Accepted 27 Apr 2021, Published online: 18 May 2021

ABSTRACT

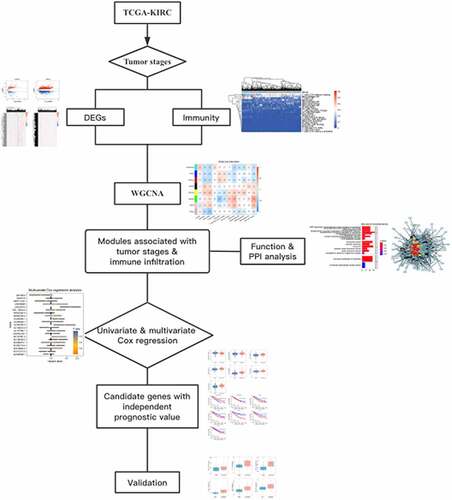
The clear cell renal cell carcinoma (ccRCC) is the main pathological subtype of renal cell carcinoma. Immune system evasion, one hallmark of cancer, contributes to cancer cells in escaping from the attack of immune cells. In order to identify potential prognostic biomarkers in ccRCC patients and immune cells fraction, we collected and downloaded profiles from The Cancer Genome Atlas (TCGA) database and Gene Expression Omnibus (GEO) database. We obtained 2 modules significantly associated with tumor stage and immune cells; functional enrichment analysis showed that genes in the module ‘yellow’ were significantly enriched in proteins targeting to membrane and ribosome, as well as the oxidative phosphorylation pathway, while genes in the module ‘green’ mainly participate in molecular functions associated with immunity like activation of T cells. Four LncRNAs (LINC00472, AL590094.1, AL365203.3, and AC147651.3) and RPL27A and RPL22L1 in the module ‘yellow’ and two lncRNAs (LINC00426 and AC129507.2) and five protein-coding genes (CSF1, NOD2, ITGAE, CD7, and PDCD1) in the module ‘green’ represented independent prognostic values in patients with ccRCC. Expression of LINC0042, NOD2, CD7, and PDCD1 were significantly correlated with ratio of immune cells (like T cells CD8 and resting mast cells). LINC00426, with significant correlation with immune cell fraction, shows potential prognostic value in ccRCC patients. Our findings provide a strategy in exploring biomarkers with prognostic significance and significant association with the fraction of immune cells.

GA

Introduction

Renal cell carcinoma (RCC) is the most frequent malignancy in the kidney, accounting for 2–3% of all cancers [Citation1]. Clear cell renal cell carcinoma (ccRCC) is the most common pathological subtype of RCC, originating from the proximal uriniferous tubules and often presenting an aggressive phenotype [Citation2]. ccRCC has high morbidity and mortality, as well as a poor prognosis. Since ccRCC is insensitive to chemotherapy and radiotherapy [Citation3], and the clinicopathological risk factors cannot fully identify ccRCC patients, it is urgent and necessary to mine the potential biomarkers that could help to distinguish patients with ccRCC.

Long non-coding RNAs (lncRNAs) are RNA transcripts longer than 200 nucleotides in length, which cannot be translated into proteins. lncRNAs play an essential role in tumor biology, such as cell proliferation, metabolism, differentiation, and angiogenesis [Citation4]. Previous studies have shown that lncRNA MALAT1 modified the progression of ccRCC by regulating miR-194-5p/ACVR2B signaling [Citation5]. lncRNA MSC-AS1 could activate the Wnt-β-catenin signaling pathway to modulate cell proliferation and migration in ccRCC via miR-3924/WNT5A [Citation6]. A novel lncRNA, LINC00997, contributed to metastasis by regulating S100A11 in ccRCC [Citation7]. Besides, lncRNAs were reported as potential prognostic molecular biomarkers for RRC. A panel of four-lncRNA signature was identified as a potential biomarker for predicting survival in ccRCC [Citation8]. Four lncRNAs were potential therapeutic targets and prognostic biomarkers of ccRCC [Citation9]. A recent publication reported a novel prognostic lncRNA with association of transition of epithelial-mesenchymal in ccRCC [Citation10]. Interactions between cancer cells and immune cells play critical roles in patients in response to cancers. Cancer cells might escape from immune cell attack or influence the dysfunction and apoptosis of immune cells by expressing immune inhibitory molecules [Citation11]. Analysis of lncRNAs associated with immune cells in patients with ccRCC, however, is limited. Therefore, more potential and valuable lncRNA biomarkers, especially immune-related lncRNAs, need to be identified to improve the prognosis.

Weighted gene co-expression network analysis (WGCNA) describes the correlation patterns among genes and clinically relevant traits across microarray samples. Researchers can find modules of highly correlated genes, associate modules with external sample traits, and count module membership measures based on WGCNA [Citation12]. WGCNA has been increasingly used in disease research. Key modules and genes of subtypes of non-small-cell lung cancer were identified by WGCNA [Citation13]. Key pathways and genes were identified in the dynamic progression of HCC based on WGCNA [Citation14]. ILF3-AS1 could regulate PTBP1 by sponging miR-29a in gastric cancer according to WGCNA co-expression network analysis [Citation15]. Hub-methylated differentially expressed genes in patients with gestational diabetes mellitus were identified by multi-omic WGCNA based on epigenome-wide and transcriptome-wide profiling [Citation16].

In this study, our study aims to identify potential prognostic biomarkers related to immunity in distinguishing ccRCC patients at early and advanced stages. We identified modules related to ccRCC tumor-stage and immune infiltration using WGCNA; functional enrichment and protein–protein interactions analyses were conducted to explore relevant signaling pathways and gene clusters; univariate and multivariate Cox regression analyses were conducted to identify potential prognostic biomarkers for ccRCC; correlation among immune cells and candidate genes was conducted to analyze genes with significant association with immune infiltration.

Materials and methods

Data collection, processing, and quality control

TCGA-ccRCC (containing 530 RCC samples and 72 control tissue samples) was downloaded from the TCGA database (https://portal.gdc.cancer.gov/) for analysis. To investigate genes associated with tumor stage, gender, and tumor immune microenvironment (TIME) [Citation17], 530 tumor samples were taken for analysis. Due to the lack of cancer stage information, 3 data were excluded, leaving 527 data for further analysis.

Immune cell distribution analysis

To explore the immune cell distributions, an analytical tool CIBERSORTx (https://cibersortx.stanford.edu/) was used to examine the fractions of 22 immune cells in tumor samples. The samples were separated into two groups: early (I/II) and advanced (III/IV) ccRCC according to the clinical information. The abundance of immune cells was depicted using a heatmap.

Differential gene analysis

Patients were divided into two groups: early (I/II) and advanced (III/IV) ccRCC as per tumor stages. All data from TCGA-ccRCC were normalized using the limma package. The threshold to identify differentially expressed genes (DEGs) was set to |fold change| >>1.2 P < 0.05 to ensure sufficient genes for downstream analysis. Volcano plots and heatmaps were used to visualize the DEGs using the ggplot2 package and pheatmap software, respectively.

WGCNA network construction

The gene expression matrix and clinical information (tumor stage (TS), gender (G), and immune cells fraction (ICF)) matrix network were constructed by setting the ‘minModuleSize’ parameter to 80. The ‘mergeCloseModules’ function was used to merge modules with the correlation of 0.75 and other default parameters were added. The correlation between clinical traits and sample expression was calculated with the ‘cor’ function; the P-value was calculated with the ‘corPvalueStudent’ function. Genes with significant relationships (P < 0.05) with clinical traits were identified for further analysis.

Functional enrichment analysis and protein–protein interaction (PPI)

DEGs associated with immunity and tumor stages in identified modules using WGCNA were used for functional enrichment analysis. Gene Ontology (GO) and Kyoto Encyclopedia of Genes and Genomes (KEGG) enrichment analyses were conducted using clusterProfiler [Citation18]. GO terms can be classified into 3 categories: biological processes (BP), cellular components (CC), and molecular functions (MF). GO terms (top ten of each category) and KEGG pathways were visualized with bar plots and bubble plots, respectively. PPI was analyzed using an online tool STRING (https://string-db.org/), which provides functional protein association networks. PPI was visualized using Cytoscape software to predict gene clusters.

Cox regression analysis and Kaplan-Meier (KM) survival analysis

Univariate Cox regression analysis was performed to explore potential prognosis-associated genes. Genes with clinical prognostic value were visualized with forest trees for further analysis. Then, multivariate Cox regression analysis was conducted using genes identified to evaluate the independent prognostic value of genes as biomarkers. The Cox regression analysis was visualized by forest plot.

To compare the expression level of genes between patients with ccRCC at early and advanced stages, we calculated the difference of two groups with the T-test method; the expression levels were depicted with box plots. The patients with ccRCC were divided into two groups according to the expression of genes, KM survival plots are depicted to explore the association between expression levels and survival probability.

Correlation analysis of genes and immune cells

To explore the impact of genes on immunity, we analyzed the association between gene expression and fraction of immune cells. In detail, we conducted a matrix containing the expression of genes with significant prognostic value and proportion of immune cells and calculated the correlation scores among them with the Pearson method; significant value (P-value) was calculated and set to 0.01 for significance.

Validation of candidate genes

To validate the expression of genes obtained in this analysis, we collected independent profiles related to different stages of ccRCC from Gene Expression Omnibus (GEO) database. GSE150404, with 60 tumor samples (30 in early stage, 30 in advanced stage), was downloaded and normalized. We annotated the genes according to the annotation profile, GPL17692[HuGene-2_1-st] Affymetrix Human Gene 2.1 ST Array [transcript (gene) version]. Boxplots were depicted with method described above.

Results

Immune cell distribution

The fraction of immune cells between two tumor stages was analyzed to explore the variety of immune infiltration; the analysis revealed differences in multiple immune cells (T cells CD4 memory resting, Macrophages M2 and T cells CD8) among different samples (). Representative immune cells (B cells naïve, T cells CD8, T cells CD4 memory resting, NK cells resting, Monocytes, Macrophages M0, Macrophages M1, Macrophages M2, and Mast cells resting) were selected for immune-related gene analysis.

Figure 1. Immune cell distribution analysis between two groups

Heatmap was used to depict the distribution of immune cells between early (I/II) and advanced (III/IV) stages; ‘Group’ bar indicates different tumor stages: turquoise represents advanced stage while pink indicates early stage; right color bar shows ratio of immune cells.
Figure 1. Immune cell distribution analysis between two groups

DEGs at different stages of ccRCC

DEGs between two tumor stages of ccRCC were analyzed; a total of 2902 DEGs were detected, including 2556 protein-coding genes (PC) and 218 lncRNAs according to the threshold. The DEGs were visualized using volcano plots () and heatmaps ().

Figure 2. Visualization of differentially expressed genes (DEGs) at different stages of ccRCC

(a) represents volcano plots of DEGs at different stages of ccRCC; dash line indicates | fold change | = 1.2; red dots refer to up-regulated genes in advanced stages, blue dots to down-regulated genes. (b) represents heatmaps of differentially expressed lncRNAs and protein-coding genes between two stages of ccRCC; turquoise in ‘Group’ refers to advanced samples, pink to early samples.
Figure 2. Visualization of differentially expressed genes (DEGs) at different stages of ccRCC

Weighted co-expression network construction

Topology trees were constructed based on expression levels and the outlier samples were removed (). Then, we matched the samples with clinical information provided ().

Figure 3. Sample clustering dendrogram of TCGA-ccRCC

a) A clustering tree of samples was constructed according to expression levels; the red line represents cutoff for outgroups. b) The clinical traits and immune cells were mapped to the clustering tree without outgroups; green in gender bar refers to female, yellow to male; vital states were color coded (alive: blue, dead: brown); turquoise in tumor stages indicates advanced stage, while pink shows early stage; red colors in immune cells represent samples with higher ratio (> average ratio of patients), black colors indicate those patients with lower ratio of immune cells.
Figure 3. Sample clustering dendrogram of TCGA-ccRCC

After removing the outlier samples, 448 samples (270 early stages, 178 advanced stages) with 2092 genes were finally selected to build the network. The soft-threshold power β = 7 was selected to construct a network based on the scale-free topology ()), and 7 modules were obtained (), ). Module ‘green’ with 554 genes indicated a significant correlation with multiple immune cells including T cells CD8, Monocytes, and Mast cells resting (). Given that the module ‘yellow’ correlated with survival, cancer stage, and multiple immune cell distribution (), this module (containing 343 genes) was also selected for subsequent analysis.

Table 1. Modules identified using weighted gene co-expression network analysis

Figure 4. Weighted gene co-expression network analysis (WGCNA) of TCGA-ccRCC

a) and b) represent the mean connectivity and scale independence of different soft-threshold power analysis. c) Hierarchical clustering of module eigengenes. d) Cluster dendrogram of the co-expression network modules. e) The modules related to different clinical traits.
Figure 4. Weighted gene co-expression network analysis (WGCNA) of TCGA-ccRCC

Functional enrichment analysis and PPI network construction

Interactions of proteins, forming a machine, play a crucial role in regulating ccRCC. Genes in the most significant modules related to traits (module ‘yellow’) were selected for functional enrichment analysis. These genes were enriched in 59 BP, 6 CC, and 2 MF. These genes were significantly enriched in BP terms related to membranes, such as the establishment of protein localization to the membrane, co-translational protein targeting to membrane, and protein targeting to membrane; CC terms related to the ribosome (). Genes in the module ‘green’ were enriched in 935 terms including 826 terms in BP, 45 in CC, and 64 in MF. Multiple molecular functions associated with immunity such as T cell activation, immunological synapse, immune receptor activity, and regulation of cytokine were enriched (). KEGG enrichment analysis showed that genes in module ‘yellow’ were enriched in pathways like prion disease, oxidative phosphorylation, and retrograde endocannabinoid signaling (). KEGG analysis of genes in the module ‘green’ indicated the enrichment of pathways associated with immunity such as the interaction of cytokine-cytokine receptor, signaling pathway of T cell, and primary immunodeficiency ().

Figure 5. Functional enrichment analysis of genes in yellow modules

a, c) Gene Ontology (GO) enrichment analysis was visualized using a bar plot. BP, biological processes; CC, cellular components; MF, molecular functions. Different colors showed the fold-change of genes; b, d) Kyoto Encyclopedia of Genes and Genomes (KEGG) pathways were visualized using a bubble plot.
Figure 5. Functional enrichment analysis of genes in yellow modules

PPI network was constructed using the STRING database ( for module ‘yellow’, 6c for ‘green’). Genes in the gene cluster with the highest score predicted by Cytoscape based on interactions of genes in the module ‘yellow’ were selected for further analysis (). Given the complex interactions among genes in the module ‘green’, we selected the top 2 gene clusters for further analysis ().

Figure 6. Protein-protein interaction (PPI) and gene cluster prediction

a, c) PPI of DEGs using STRING database. b, d) Gene clusters were collected and visualized using Cytoscape.
Figure 6. Protein-protein interaction (PPI) and gene cluster prediction

Univariate and multivariate Cox regression analysis

For the ‘yellow’ module, univariate regression analysis identified 271 genes of prognostic significance out of 343 genes, including 21 lncRNAs (as in ) and 17 genes in gene clusters (). All three tests (likelihood ratio test, Wald test, and Logrank test) suggested reliable regression models (P < 0.05). Multivariate Cox regression analysis identified four LncRNAs (LINC00472, AL590094.1, AL365203.3, and AC147651.3) () and RPL27A and RPL22L1 () in the gene cluster with independent prognostic value in distinguishing patients with ccRCC in early stages from advanced stages. We obtained 19 lncRNAs and 26 protein-coding genes in top 2 gene clusters with prognostic significance ()); Multivariate Cox regression analysis revealed that two lncRNAs (LINC00426 and AC129507.2) and five protein-coding genes (CSF1, NOD2, ITGAE, CD7, and PDCD1) had potential independent prognostic value ()).

Figure 7. Prognostic analysis visualized with forest plots

a) and b) represent univariate Cox regression analysis of 21 lncRNAs and 17 genes in the module ‘yellow’, respectively; c) and d) represent multivariate Cox regression analysis of 21 lncRNAs and 17 genes, respectively. e) and f) refer to univariate Cox regression analysis of 19 lncRNAs and 26 genes in the module ‘green’, respectively, while (c) and (d) to multivariate Cox regression analysis.
Figure 7. Prognostic analysis visualized with forest plots

Expression level and KM analysis

The expression of four LncRNAs (LINC00472, AL590094.1, AL365203.3, and AC147651.3) and RPL27A and RPL22L1 was visualized with box plots (). LINC00472 was significantly decreased in the advanced stages of ccRCC compared with that in early stages; AL590094.1, AL365203.3, AC147651.3, RPL27A, and RPL22L1 were significantly increased in advanced stages compared with that in early stages (). The KM plots showed that high expression of LINC00472 had a greater survival probability, while the other five genes showed the opposite trend ().

Figure 8. Expression level and Kaplan-Meier (KM) survival of genes in module ‘yellow’

a) The expression levels of genes in module ‘yellow’; significance was marked with ‘*’, ‘**’, ‘***’ and ‘****’ for P < 0.05, P < 0.01, P < 0.001 and P < 0.0001, respectively. b) KM plots of genes; the red line represents high expression and blue represents low expression.
Figure 8. Expression level and Kaplan-Meier (KM) survival of genes in module ‘yellow’

For module ‘green’, gene expression was significantly stimulated in patients with ccRCC in advanced stages, compared with those in early stages, except lncRNA, AC129507.2, showed a decrease in patients with ccRCC in advanced stages (). LnRNA, LINC00426, did not present a significant prognostic value in the KM method; AC129507.2 expression indicated a positive correlation with survival probability, while the other five protein-coding genes represented a negative association ().

Figure 9. Expression level and Kaplan-Meier (KM) survival of genes in module ‘green’

a) The expression levels of genes are depicted with box plots. b) KM plots of genes.
Figure 9. Expression level and Kaplan-Meier (KM) survival of genes in module ‘green’

Immune association analysis

Six genes (4 lncRNAs and 2 protein-coding genes) showed weak or no relation to the fraction of immune cells; LINC00472 indicated a negative correlation with the expression of the other threelncRNAs (). We observed an obvious association of genes in the module ‘green’, the immune cells proportion; expression of LINC00426, NOD2, CD7, and PDCD1 indicated a positive correlation with a fraction of T cells CD8; the increase of LINC00426 decreased the accumulation of monocytes and mast cells (resting); negative correlation of NOD2 and mast cells (resting) fraction was observed; PDCD1 expression limited the accumulation of NK cells (resting), monocytes, and mast cells (resting) ().

Figure 10. Correlation of genes and immune cells

The association of 9 type immune cells and genes with significant prognostic value in module ‘yellow’ a) and ‘green’ b) was depicted; significant values larger than 0.01 were represented with blank boxes; correlation scores were color-coded and depicted with the size of the sector.
Figure 10. Correlation of genes and immune cells

Validation of crucial DEGs

The expression of seven protein coding genes (RPL27A, RPL22L1, CSF1, NOD2, ITGAE, CD7, and PDCD1) between the early and advanced stage of ccRCC were validated with GSE150404. We failed to examine the expression of RPL22L1 due to the absence of expression in the matrix. Five genes (CSF1, NOD2, ITGAE, CD7, and PDCD1) showed significantly increased expression level in patients in advanced stage compared with those in early stage; expression of RRL27A was increased in advanced stage though not significant.

Discussion

WGCNA was used to find the most significant module related to ccRCC tumor stage and immunity, and we found that genes in the ‘yellow’ and ‘green’ modules were significantly related to tumor stage and immunity (). Previous publications reported the histological tumor types in TCGA-ccRCC project [Citation19]; similarly, we observed multiple outliers in TCGA-ccRCC (). GO enrichment analysis showed that genes in the ‘yellow’ module were significantly enriched in CC terms related to the ribosome (). The previous research showed that knockdown of ribosomal protein S15A inhibited human kidney cancer cell growth in vitro and in vivo [Citation20]. Ribosomal s6 protein kinase 4 was a prognostic factor for RCC [Citation21]. Genes in module ‘green’ were enriched in immune-related terms like T cell activation and cytokine activity, which have been widely reported in the process of RCC [Citation22–25]. KEGG enrichment analysis showed that identified genes in module ‘yellow’ were enriched in pathways like oxidative phosphorylation (). Papillary renal cell carcinomas rewired glutathione metabolism and were deficient in both anabolic glucose synthesis and oxidative phosphorylation [Citation26]. System biology analysis showed that eight proteins were mainly distributed in oxidative phosphorylation in RCC with bone metastasis via mitochondrial dysfunction [Citation27]. Some co-expressed genes in RCC were also reported to be enriched in oxidative phosphorylation [Citation28,Citation29], which is consistent with our research. Cytokine-cytokine receptor interaction and chemokine signaling pathway were significantly enriched by genes in the ‘green’ module; cytokines play a critical role in regulating the RCC microenvironment and mediating immune cell infiltration [Citation30]. C-X-C Motif Chemokine Ligand 10 (CXCL10), a protein-coding gene engaged in chemokine activity, has been revealed to be associated with disease-free survival (DFS) in patients remedied with adjuvant VEGFR TKIs in RCC [Citation31].

The Cox regression analysis showed that LINC00472 had a independent diagnostic value in distinguishing patients with ccRCC in early stages from advanced stages ()). The KM plot showed that ccRCC patients with high expression of LINC00472 had a greater survival probability (). LINC00472 acted as a tumor suppressor in NSCLC through the KLLN-Mediated p53-signaling pathway via microRNA-149-3p and microRNA-4270 [Citation32]. Downregulation of LINC00472 promotes osteosarcoma tumorigenesis by reducing FOXO1 expressions via miR-300 [Citation33]. LINC00472 regulated cell stiffness and inhibited the migration and invasion of lung adenocarcinoma by binding to YBX1 [Citation34]. LINC00472 suppressed proliferation and promoted apoptosis through elevating PDCD4 expression by sponging miR-196a in colorectal cancer [Citation35]. It was reported that LINC00472 may serve as a potential diagnostic marker for diabetic kidney disease [Citation36]. LINC00472 was identified as an RNA transcriptional marker associated with ccRCC prognosis by a competing endogenous RNA network analysis [Citation37]. However, that study differed from our study in terms of the study object. Our research aimed to identify biomarkers to distinguish patients with ccRCC at early and advanced stages, while the previous research aimed to distinguish patients with ccRCC from healthy individuals. We found that RPL22L1 and RPL27A had the potential in distinguishing ccRCC patients at early and advanced stages (). The KM plots showed that patients with lower expression of RPL22L1 and RPL27A had higher survival probability (). The previous research showed that ribosomal subunit protein RPL27A is a target of miR-595 and may contribute to the myelodysplastic phenotype through ribosomal dysgenesis [Citation38]. Heavy-ion radiation-induced DNA damage mediated apoptosis via RPL27A-RPL5-MDM2-p53/E2F1 signaling pathway in mouse spermatogonia [Citation39].

Recent works revealed that LINC00426 expression represented significantly prognostic value in patients with lung cancer and hepatocellular carcinoma [Citation40,Citation41]. Zhang, et al. found the potential of immune-related lncRNAs (including LINC00426) in predicting immune checkpoint blockade [Citation41]. In this study, we observed a significant correlation between LINC00426 expression and fraction of T cells CD8 and mast cells (resting) (). LINC00426 showed independent prognostic significance in patients with ccRCC ()). However, we did not obtain a prognostic value for LINC00426 consistent with the KM approach (). Kaplan–Meier curves are powerful as categorical predictors; however, they might represent instability in analyzing quantitative predictors like gene expression [Citation42]. More expression data are required to assess the prognostic significance of LINC00426. Expression of NOD2, CD7, and PDCD1 was significantly increased in advanced stage and indicated a significant positive correlation with T cells CD8 fraction (). NOD2 was reported in regulating innate and adaptive immunity in patients with Crohn’s disease [Citation43]. Researchers found that the NOD2 expression showed potential as a biomarker for kidney cancer patients [Citation44]. CD7 plays a crucial role in mediating the apoptosis of galectin-3-induced type II T-cells and was considered as a critical target for acute lymphoblastic leukemia [Citation45,Citation46]. Programmed cell death 1 (PDCD1, also called PD1), a critical inhibitory molecule mainly expressed in pro-B-cells, participates in T cell receptor signaling and innate immune system; one ligand of PDCD1, programmed death-ligand-1 (PD-L1), was utilized as a critical target in treating patients with cancers [Citation47,Citation48]. In our analysis, we observed the differential expression of NOD2, CD7, and PDCD1 between two tumor stages of ccRCC and the potential of NOD2, CD7, and PDCD1 as independent prognostic biomarkers in patients with ccRCC.

Figure 11. Validation of candidate genes

The expression of candidate genes between two stages was validate using GSE150404; the significance of difference was marked.
Figure 11. Validation of candidate genes

In conclusion, based on systematic analysis of the correlation of genes expression, tumor stage, and immune cells fraction, we observed 6 lncRNAs and 7 protein coding genes with independent prognostic significance in patients with ccRCC; one lncRNA (LINC00426) and three genes (NOD2, CD7, and PDCD1) indicated significant correlation with immune cells fraction, especially T cells CD8.

Conclusions

Six lncRNAs (LINC00472, AL590094.1, AL365203.3, AC147651.3, AC129507.2, and LINC00426) and 7 genes (RPL27A, RPL22L1, CSF1, NOD2, ITGAE, CD7, and PDCD1) show expression differences in patients with ccRCC at early stages compared to those at advanced stages, representing independent prognostic significance; LINC00426 is one potential biomarker with prognostic value and indicates a significant correlation with immune cell fraction.

Highlights

  • Six lncRNAs (LINC00472, AL590094.1, AL365203.3, AC147651.3, AC129507.2, and LINC00426) and 7 genes (RPL27A, RPL22L1, CSF1, NOD2, ITGAE, CD7, and PDCD1) show expression differences in patients with KIRC at early stages compared to those at advanced stages;

  • Six lncRNAs and 7 genes represent independent prognostic significance.

  • LINC00426 is one potential biomarker of prognostic value and indicates a significant correlation with immune cell fraction.

Author contributions

Zhenfei Xiang: Data curation, Writing-Original draft preparation.

Erdong Shen: Visualization, Investigation.

Mingyao Li: Conceptualization, Methodology.

Danfei Hu: Software.

Zhanchun Zhang: Validation

Senquan Yu: Writing- Reviewing and Editing, Supervision.

Supplemental material

Supplemental Material

Download ()

Disclosure statement

No potential conflict of interest was reported by the author(s).

Availability of data and material

The datasets used and/or analyzed during the current study are available from the corresponding author on reasonable request.

Supplementary material

Supplemental data for this article can be accessed here.

Additional information

Funding

This work was supported by grants from The Medical Science and Technology Project of Zhejiang Provincial Health Commission [2019KY188] and Zhejiang Traditional Chinese Medicine Science and Technology Plan Project [2021ZB140];

References

  • Wang Q, Zhang H, Chen Q, et al. Identification of METTL14 in kidney renal clear cell carcinoma using bioinformatics analysis. Dis Markers. 2019;2019:5648783.
  • Liang T, Sang S, Shao Q, et al. Abnormal expression and prognostic significance of EPB41L1 in kidney renal clear cell carcinoma based on data mining. Cancer Cell Int. 2020;20:356.
  • Ljungberg B, Bensalah K, Canfield S, et al. EAU guidelines on renal cell carcinoma: 2014 update. Eur Urol. 2015;67:913–924.
  • Yu G, Yao W, Wang J, et al. LncRNAs expression signatures of renal clear cell carcinoma revealed by microarray. PLoS One. 2012;7:e42377.
  • Ye Y, Zhang F, Chen Q, et al. LncRNA MALAT1 modified progression of clear cell kidney carcinoma (KIRC) by regulation of miR-194-5p/ACVR2B signaling. Mol Carcinog. 2019;58:279–292.
  • Hu Z, Li L, Cheng P, et al. lncRNA MSC-AS1 activates Wnt/beta-catenin signaling pathway to modulate cell proliferation and migration in kidney renal clear cell carcinoma via miR-3924/WNT5A. J Cell Biochem. 2020;121:4085–4093.
  • Chang Y, Li N, Yuan W, et al. LINC00997, a novel long noncoding RNA, contributes to metastasis via regulation of S100A11 in kidney renal clear cell carcinoma. Int J Biochem Cell Biol. 2019;116:105590.
  • Liu H, Ye T, Yang X, et al. A panel of four-lncRNA signature as a potential biomarker for predicting survival in clear cell renal cell carcinoma. J Cancer. 2020;11:4274–4283.
  • Zhu H, Lu J, Zhao H, et al. Functional long noncoding RNAs (lncRNAs) in clear cell kidney carcinoma revealed by reconstruction and comprehensive analysis of the lncRNA-miRNA-mRNA regulatory network. Med Sci Monit. 2018;24:8250–8263.
  • Zhang YP, Cheng YB, Li S, et al. An epithelial-mesenchymal transition-related long non-coding RNA signature to predict overall survival and immune microenvironment in kidney renal clear cell carcinoma. Bioengineered. 2021;12:555–564.
  • Chen J, Jiang CC, Jin L, et al. Regulation of PD-L1: a novel role of pro-survival signalling in cancer. Ann Oncol. 2016;27:409–416.
  • Langfelder P, Horvath S. WGCNA: an R package for weighted correlation network analysis. BMC Bioinformatics. 2008;9:559.
  • Niemira M, Collin F, Szalkowska A, et al. Molecular signature of subtypes of non-small-cell lung cancer by large-scale transcriptional profiling: identification of key modules and genes by weighted gene co-expression network analysis (WGCNA). Cancers (Basel). 2019;12.
  • Yin L, Cai Z, Zhu B, et al. Identification of key pathways and genes in the dynamic progression of HCC based on WGCNA. Genes (Basel). 2018;9:92.
  • Ren ZH, Shang GP, Wu K, et al. WGCNA co-expression network analysis reveals ILF3-AS1 functions as a CeRNA to regulate PTBP1 expression by sponging miR-29a in gastric cancer. Front Genet. 2020;11:39.
  • Chen M, Yan J, Han Q, et al. Identification of hub-methylated differentially expressed genes in patients with gestational diabetes mellitus by multi-omic WGCNA basing epigenome-wide and transcriptome-wide profiling. J Cell Biochem. 2020;121:3173–3184.
  • Binnewies M, Roberts EW, Kersten K, et al. Understanding the tumor immune microenvironment (TIME) for effective therapy. Nat Med. 2018;24:541–550.
  • Yu G, Wang LG, Han Y, et al. clusterProfiler: an R package for comparing biological themes among gene clusters. OMICS. 2012;16:284–287.
  • Favazza L, Chitale DA, Barod R, et al. Renal cell tumors with clear cell histology and intact VHL and chromosome 3p: a histological review of tumors from the Cancer Genome Atlas database. Mod Pathol. 2017;30:1603–1612.
  • Liang J, Liu Z, Zou Z, et al. Knockdown of ribosomal protein S15A inhibits human kidney cancer cell growth in vitro and in vivo. Mol Med Rep. 2019;19:1117–1127.
  • Fan L, Li P, Yin Z, et al. Ribosomal s6 protein kinase 4: a prognostic factor for renal cell carcinoma. Br J Cancer. 2013;109:1137–1146.
  • Uzzo RG, Rayman P, Kolenko V, et al. Renal cell carcinoma-derived gangliosides suppress nuclear factor-kappaB activation in T cells. J Clin Invest. 1999;104:769–776.
  • Finke JH, Rayman P, George R, et al. Tumor-induced sensitivity to apoptosis in T cells from patients with renal cell carcinoma: role of nuclear factor-kappaB suppression. Clin Cancer Res. 2001;7:940s–6s.
  • Menard LC, Fischer P, Kakrecha B, et al. Renal Cell Carcinoma (RCC) tumors display large expansion of Double Positive (DP) CD4+CD8+ T cells with expression of exhaustion markers. Front Immunol. 2018;9:2728.
  • Zhao X, Zhang Z, Li H, et al. Cytokine induced killer cell-based immunotherapies in patients with different stages of renal cell carcinoma. Cancer Lett. 2015;362:192–198.
  • Al Ahmad A, Paffrath V, Clima R, et al. Papillary renal cell carcinomas rewire glutathione metabolism and are deficient in both anabolic glucose synthesis and oxidative phosphorylation. Cancers (Basel). 2019;11:1298.
  • Wang J, Zhao X, Qi J, et al. Eight proteins play critical roles in RCC with bone metastasis via mitochondrial dysfunction. Clin Exp Metastasis. 2015;32:605–622.
  • Cheng Q, Qu D, Lu Z, et al. Knockdown of CHCHD2 inhibits migration and angiogenesis of human renal cell carcinoma: a potential molecular marker for treatment of RCC. Oncol Lett. 2019;17:765–772.
  • Wang L, Qi Y, Wang X, et al. ECHS1 suppresses renal cell carcinoma development through inhibiting mTOR signaling activation. Biomed Pharmacother. 2020;123:109750.
  • Braun DA, Bakouny Z, Hirsch L, et al. Beyond conventional immune-checkpoint inhibition - novel immunotherapies for renal cell carcinoma. Nat Rev Clin Oncol. 2021;18:199–214.
  • Xu W, Puligandla M, Manola J, et al. Angiogenic factor and cytokine analysis among patients treated with adjuvant VEGFR TKIs in resected renal cell carcinoma. Clin Cancer Res. 2019;25:6098–6106.
  • Zou A, Liu X, Mai Z, et al. LINC00472 acts as a tumor suppressor in NSCLC through KLLN-mediated p53-signaling pathway via MicroRNA-149-3p and MicroRNA-4270. Mol Ther Nucleic Acids. 2019;17:563–577.
  • Zhang J, Zhang J, Zhang D, et al. Down-regulation of LINC00472 promotes osteosarcoma tumorigenesis by reducing FOXO1 expressions via miR-300. Cancer Cell Int. 2020;20:100.
  • Deng X, Xiong W, Jiang X, et al. LncRNA LINC00472 regulates cell stiffness and inhibits the migration and invasion of lung adenocarcinoma by binding to YBX1. Cell Death Dis. 2020;11:945.
  • Ye Y, Yang S, Han Y, et al. Linc00472 suppresses proliferation and promotes apoptosis through elevating PDCD4 expression by sponging miR-196a in colorectal cancer. Aging (Albany NY). 2018;10:1523–1533.
  • Wang YZ, Zhu DY, Xie XM, et al. EA15, MIR22, LINC00472 as diagnostic markers for diabetic kidney disease. J Cell Physiol. 2019;234:8797–8803.
  • Yang Q, Chu W, Yang W, et al. Identification of RNA transcript makers associated with prognosis of kidney renal clear cell carcinoma by a competing endogenous RNA network analysis. Front Genet. 2020;11:540094.
  • Alkhatabi HA, McLornan DP, Kulasekararaj AG, et al. RPL27A is a target of miR-595 and may contribute to the myelodysplastic phenotype through ribosomal dysgenesis. Oncotarget. 2016;7:47875–47890.
  • Li H, Zhang H, Huang G, et al. Heavy ion radiation-induced DNA damage mediates apoptosis via the Rpl27a-Rpl5-MDM2-p53/E2F1 signaling pathway in mouse spermatogonia. Ecotoxicol Environ Saf. 2020;201:110831.
  • Du W, Sun J, Gu J, et al. Bioinformatics analysis of LINC00426 expression in lung cancer and its correlation with patients’ prognosis. Thorac Cancer. 2020;11:150–155.
  • Zhang Y, Zhang L, Xu Y, et al. Immune-related long noncoding RNA signature for predicting survival and immune checkpoint blockade in hepatocellular carcinoma. J Cell Physiol. 2020;235:9304–9316.
  • Bradburn MJ, Clark TG, Love SB, et al. Survival analysis part II: multivariate data analysis–an introduction to concepts and methods. Br J Cancer. 2003;89:431–436.
  • Kobayashi KS, Chamaillard M, Ogura Y, et al. Nod2-dependent regulation of innate and adaptive immunity in the intestinal tract. Science. 2005;307:731–734.
  • Xu D, Zhang S, Zhang S, et al. NOD2 maybe a biomarker for the survival of kidney cancer patients. Oncotarget. 2017;8:101489–101499.
  • Fukumori T, Takenaka Y, Yoshii T, et al. CD29 and CD7 mediate galectin-3-induced type II T-cell apoptosis. Cancer Res. 2003;63:8302–8311.
  • Peipp M, Kupers H, Saul D, et al. A recombinant CD7-specific single-chain immunotoxin is a potent inducer of apoptosis in acute leukemic T cells. Cancer Res. 2002;62:2848–2855.
  • Peng DH, Rodriguez BL, Diao L, et al. Collagen promotes anti-PD-1/PD-L1 resistance in cancer through LAIR1-dependent CD8(+) T cell exhaustion. Nat Commun. 2020;11:4520.
  • Miao Y, Wang J, Li Q, et al. Prognostic value and immunological role of PDCD1 gene in pan-cancer. Int Immunopharmacol. 2020;89:107080.