
ABSTRACT
Pancreatic cancer (PAAD) is a common malignancy with a poor survival rate. The identification of novel biomarkers could improve clinical outcomes for patients with PAAD. Here we evaluated the expression and clinical significance of PPP1CB in PAAD. PPP1CB expression was higher in PAAD tissue than in matched paracancerous tissue (P < 0.05). We predicted a network of regulatory targets and protein interaction partners of PPP1CB, and identified a PPI network consisting of 39 node genes. The expression of 33 node genes was higher in PAAD tissue than in matching paracancerous tissue. High expression of the node genes ACTN4, ANLN, CLTB, IQGAP1, SPTAN1, and TMOD3 was associated with improved overall survival (P < 0.05). SiRNA knockdown of PPP1CB significantly reduced the migration and invasion of PAAD cells. A PPP1CB immunohistochemical staining was performed using a tissue microarray (TMA), consisting of tumor samples collected from 91 patients with PAAD (88 of which contained matched paracancerous tissues). The expression of PPP1CB in PAAD was significantly higher than in the matched paracancerous tissue, (P = 0.016). High PPP1CB expression was associated with patient sex (P = 0.048), alcohol use (P = 0.039), CEA (P= 0.038), N stage (P = 0.001), and invasion of nerve (P = 0.036). Furthermore, high PPP1CB expression was associated with significantly poorer overall survival (P = 0.022). Our data demonstrate that PPP1CB is associated with the migration and invasion of PAAD cells, and may be useful as an independent prognostic indicator for clinical outcome in patients with PAAD.
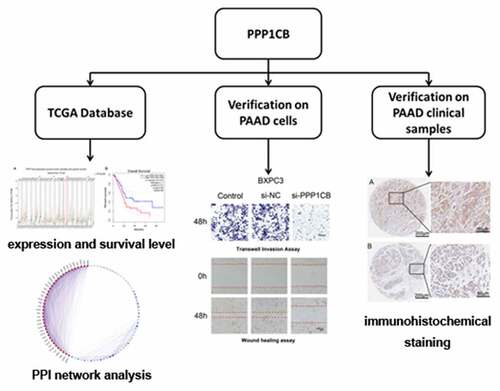
Graphical abstract
Introduction
Pancreatic cancer (PAAD) is a highly malignant and fatal tumor. Despite treatment advances, the 5-year survival rate of PAAD remains at only 8%, and PAAD is expected to become the second greatest cause of cancer death over the next two decades [Citation1,Citation2]. Approximately 80–85% of patients with PAAD will have advanced metastases that cannot be surgically removed [Citation3]. Unfortunately, conventional radiotherapy and chemotherapy treatments do not significantly prolong the survival of PAAD patients [Citation4,Citation5]. Even in the cases of those patients who are diagnosed with locally resectable tumors, disease metastasis and recurrence frequently occur after surgery, and the prognosis remains dismal [Citation5]. There is a need to estimate the survival rate of patients after operation for resectable PAAD, but the current prognostic methods are inaccurate [Citation6].
As one of the catalytic subunits of protein phosphatase 1 (PP1C), protein phosphatase 1 catalytic subunit beta (PPP1CB; encoded by PPP1CB gene) is a serine/threonine-specific protein phosphatase, and is involved in the regulation of a variety of cellular processes such as survival, cell cycle regulation, and apoptosis [Citation7]. PPP1CB is important for the dephosphorylation of myosin light chain [Citation8]. Phosphorylation of a PPP1CB inhibitor can promote contractile actomyosin mechanisms and accelerate tumor metastasis [Citation9]. PPP1CB plays a vital role in regulating the cytoskeleton network and cell migration, processes germane to cancer invasion and metastasis [Citation10]. The absence of PPP1CB negatively impacts nuclear integrity, resulting in nuclear fragmentation, nuclear envelope rupture, loss of the nuclear compartment barrier, and genome instability [Citation11,Citation12]. PPP1CB is also associated with metastasis in gastric cancer and melanoma, and is a latent anti-metastatic target for the treatment of early stage melanoma [Citation13,Citation14]. As a regulator of endothelial cell migration, PPP1CB may be an effective target for anti-angiogenic therapy and inhibition of tumor growth [Citation15]. Additionally, PPP1CA, PPP1CB, PPP2CA, PPP2CB, and PPP3CA facilitate PAAD progression, while PPP3CB, PPP5C, and PPP6C inhibit PAAD progression, however the role of PPP1CB has not been thoroughly investigated [Citation16].
Therefore, we evaluated the correlation between PPP1CB expression and PAAD prognosis in this study, and we explored the role of PPP1CB role in PAAD progression.
We analyzed gene expression from The Cancer Genome Atlas (TCGA) public dataset to evaluate PPP1CB expression in PAAD, to screen for potential PPP1CB interaction partners, and to examine expression correlation between PPP1CB and potential interacting partners via protein-protein interaction (PPI), and to explore the prognostic value of these genes on clinical outcomes for PAAD patients.
Based on previous findings, we speculated that PPP1CB may serve as an independent predictor of poor PAAD outcome. In this study, the effects of PPP1CB knockdown on the migration and invasion of PAAD cells was evaluated. We investigated the expression levels of PPP1CB in tumor samples from PAAD patients and determined the correlation of PPP1CB expression with clinical outcomes of PAAD patients.
Materials and methods
Bioinformatics analysis
PPP1CB expression and prediction of interacting protein partners
TCGA is a multidimensional human cancer dataset, including gene expression profiling and clinical data [Citation17]. We obtained the gene expression of PPP1CB from a variety of human cancers and matched with paracancerous tissues, shows the types of cancers and the number of cases assessed by the TCGA dataset. (), and used the GEPIA tool (http://gepia.cancer-pku.cn/) to analyze these data [Citation18]. Based on the UCSC Xena project (http://xena.ucsc.edu), the TCGA dataset GEPIA tool was used to determine the optimal sample size to compare tumors with the matched paracancerous non-tumor tissue [Citation19].
Table I. Cancer types evaluated from the TCGA dataset
The term ‘PPPC1B’ was entered into the following databases to predict protein interactions and target genes regulated by PPPCIB: STRINGv11.0 (https://string-db.org/), InBioMapv2019 (https://www.intomics.com/inbio/map/#home), BioGRID v4.0 (https://thebiogrid.org/), HPRD v2009 (http://www.hprd.org/), and IntAct v4.2.16 (https://www.ebi.ac.uk/intact/). Screening criteria for potential interacting partners were determined based on the optimal homology score for each gene database [Citation20–25]. We constructed a Venn diagram to further screen the prediction results and selected overlapping predicted genes for further in-depth analysis (http://bioinformatics.psb.ugent.be/webtools/Venn/).
Enrichment analysis and PPI network analysis in Metascape
Metascape version 2019 (http://metascape.org/gp/index.html) was used for enrichment analysis of the overlapping PPP1CB predicted interacting partners [Citation26]. CORUM, GO, KEGG Pathway, and Reactome Gene Sets were constructed to determine the biological functions related to the target genes. The overlapping interacting partners of PPP1CB were analyzed by a protein-protein interaction (PPI) network using Metascape. Node scores were calculated in Metascape, and the cutoff value of node scores was determined to be 1.273. The module Molecular Complex Detection (MCODE) algorithm was used to generate intensively connected networks, and different MCODE components are indicated by color coding to represent potential biological significance [Citation27].
Analysis of the target gene correlation with disease prognosis
The gene expression profile interactive analysis (GEPIA) (http://gepia.cancer-pku.cn/) tool was used to analyze the node target genes, and to compare the expression levels of these genes in tumors with matched paracancerous tissues, in order to determine the prognostic value of these genes in predicting PAAD outcomes [Citation18].
Verification experiments on PAAD cells
Cell source and culture
Human PAAD cell lines (BXPC3, CAPAN-1, PANC-1) were acquired from the American Type Culture Collection (Manassas, Virginia, USA). BXPC3 and CAPAN-1 cells were cultured in Roswell Park Memorial Institute (RPMI) 1640 medium (Gibco, Grand Island, New York, USA), and PANC-1 cells were cultured in Dulbecco’s Modified Eagle’s Medium (DMEM; Gibco, Carlsbad, California, USA). All culture medium was supplemented with 10% fetal bovine serum (FBS; Gibco, Grand Island, New York, USA) and 1% penicillin/streptomycin (Sigma, St. Louis, Missouri, USA). All cells were cultured at 37°C in a 5% CO2 incubator. The same culture medium was used for subcultures. The cell lines were passaged at a dilution of 1:3–1:4 every 3–5 days.
RNA Transfection
Small interfering RNA (siRNA) targeting PPP1CB was purchased from Genepharma Biotechnology (Shanghai, China) and Lipofectamine-2000 (Invitrogen, Carlsbad, California, USA) was used to transfect PAAD cells with the siRNA, in accordance with the manufacturer’s instructions. The siRNA sequences are as follows: PPP1CB-homo-459: 5'- GCAGAAGUUCGAGGCUUAUTT-3' and 5'- AUAAGCCUCGAACUUCUGCTT-3'; PPP1CB-homo-911: 5'- GGAGCAGAUUCGGAGAAUUTT-3' and 5'- AAUUCUCCGAAUCUGCUCCTT-3'; PPP1CB-homo-1137: 5'- GCUAAACGACAGUUGGUAATT-3' and 5'- UUACCAACUGUCGUUUAGCTT-3'; Negative Control: 5'-UUCUCCGAACGUGUCACGUTT-3' and 5'-ACGUGACACGUUCGGAGAATT-3'.
Western blotting
Cell lysis buffer (Cell Signaling Technology, Danfoss, Massachusetts, USA) was used to extract proteins from PAAD cells. Protein concentration was determined using a bicinchoninic acid protein assay kit (BCA; Sigma-Aldrich, Merck KGaA, Darmstadt, Germany). Then the protein samples (40 μg/lane) were separated by 10% sodium dodecyl sulfate-polyacrylamide gel electrophoresis (SDS PAGE), and transferred to polyvinylidene fluoride (PVDF) membranes (Millipore, Billerica, Massachusetts, USA). Tris buffered saline and 0.1% Tween 20 (TBST) with 5% bovine serum albumin (BSA) was used to block the membranes. Subsequently, membranes were incubated with primary antibody against PPP1CB (1:1000 dilution in TBST; Abcam, Cambridge, Massachusetts, USA) overnight at 4°C. After rinsing with 0.1% TBST three times, membranes were incubated with HRP-labeled secondary antibodies (1:2000 dilution in TBST; Abcam, Cambridge, Massachusetts, USA) of the corresponding species at room temperature for 2 hours with gentle shaking. The normalization control used was α-tubulin protein expression. The immunoreacted proteins were detected using an Enhanced Chemiluminescence Detection Kit-HRP (EZ-ECL, 20–500-120, Biological Industries, ISR), and the level of protein expression was determined.
Wound healing assay
A wound healing assay was used to study the impact of PPP1CB knockdown on PAAD cell migration. Briefly, cells were seeded at 3 × 10⁵ cells/well in 6-well plates, and then transfected with si-PPP1CB or si-NC. A micropipette tip was used to create a wound in a cell monolayer. The wound was washed with PBS, and photographed at 0 hours and 48 hours under an inverted optical microscope (Olympus IX51, Olympus, Center Valley, Pennsylvania, USA). The ratio of the residual wound area to the initial area was calculated and quantified by ImagePro Plus V 6.0 (Media Cybernetics, Bethesda, Maryland, USA).
Transwell invasion assay
Cell invasion was examined using a 24-well Transwell chamber (8 μm; Corning, New York, USA). First, PAAD cells (5 × 10⁴ cell) were seeded into the upper chamber in 200 μL medium without FBS, and 700 μL complete medium (containing 10% FBS) was added to the bottom chamber. After incubation for 48 hours, the cells that had invaded to the bottom of the Transwell insert were washed with PBS, fixed with methanol for 10 minutes, and then stained with 0.1% crystal violet for 10 minutes. Using a reverse microscope (Olympus, Tokyo, Japan) at 40× magnification, the cell membrane was observed in five random fields, and the number of cells that had migrated was counted and photographed.
Verification experiments on PAAD clinical samples
Clinical samples collection
A PAAD tissue microarray (TMA) was acquired from the National Human Genetic Resources Sharing Service Platform (Number: 2005DKA21300). The experimental procedures were approved by the Shanghai Outdo Biotech Company ethics committee (Number: YB M-05-02), which authorized the collection of tissue samples from patients. The TMA included 91 PAAD tumor tissues, 88 of which also included matched paracancerous tissues. All patients signed informed consent, these patients underwent resection surgery between January 2004 and December 2013. Clinicopathological information included age (year), N stage, histology, invasion of nerve, invasion of large blood vessels, jaundice status, alcohol use, M stage, location, T stage, CA199, grade, CEA, tumor sizes, TopoII, sex, diabetes, smoking, TNM stage, and p53, p63, and Ki67 status. In total, 88 pairs of cancer tissue and matched paracancerous tissue were used to analyze the expression differences between cancer and matched paracancerous tissue. For the correlation analysis relationships between clinicopathological information and PAAD gene expression, all 91 PAAD tissue samples were used, even though about three samples did not have matched paracancerous tissues.
Immunohistochemical staining evaluation
Immunohistochemical staining of the PAAD TMA was performed using an immunohistochemistry kit (EnVision™ FLEX+, cat. no. K8002, Dako; Agilent Technologies, Inc.). The Biochip Shanghai National Human Genetic Resources Sharing Service Platform provides an Automated Autostainer Link 48 system (Dako; Agilent Technologies, Inc.). In order to evaluate the expression of PPP1CB in tissue samples, two professional pathologists used an Aperio scanner (Aperio XT, Leica Microsystems GmbH, magnification, x200) to score immunohistochemical staining. The intensity of cytoplasm/nucleus staining and the positive staining rate of PPP1CB in PAAD and matched paracancerous tissues were measured, and the cytoplasm and nuclear staining were scored, respectively. Staining intensity scoring standards were as follows: 0 points (negative), 1 point (+), 2 points (++), 3 points (+++). A revised score is given to the staining intensity of each sample based on criteria [Citation26]. Finally, the product of ‘staining intensity scores’ and ‘staining rate’ is the total score for the group. Samples with a score <1.2 were categorized into the low expression group, and samples ≥1.2 were categorized into the high expression group.
Statistical analysis
Fisher’s exact test and Chi-square test were used to analyze the expression of PPP1CB in PAAD specimens and matched paracancerous tissues, as well to assess relationship between PPP1CB expression and clinicopathological characteristics. The Kaplan‑Meier method was used to create survival curves, and univariate survival analysis utilized the log-rank statistical test. Statistical analyses were performed using SPSS version 22.0 (SPSS, Inc.) and GraphPad Prism version 8 (GraphPad, San Diego, California, USA). A P-value of P < 0.05 was considered to be statistically significant.
Results
Bioinformatics analysis
PPP1CB expression in the TCGA database
In order to investigate the expression of PPP1CB in pancreatic cancer and its clinical prognostic value, we first performed a bioinformatics analysis. PPP1CB is highly expressed in a variety of human cancers, including pancreatic adenocarcinoma (PAAD), glioblastoma multiforme (GBM), thymoma (THYM), and brain lower grade glioma (LGG) (P < 0.05), compared to normal tissue. PPP1CB was not differentially expressed between normal and cancer tissue in other cancers, such as adrenocortical carcinoma (ACC), lung adenocarcinoma (LUAD), or prostate adenocarcinoma (PRAD). These results demonstrated that PPP1CB is significantly differentially expressed in various tumors compared to normal tissue, including significantly elevated expression in PAAD, suggesting that PPP1CB might play a role as an oncogene ().
High PPP1CB expression is associated with poor prognosis in patients with PAAD
We analyzed data from 178 patients in the TCGA dataset. These patients were subset into a low PPP1CB expression group (n = 89), and a high PPP1CB expression group (n = 89). Low expression of PPP1CB was significantly associated with improved survival (P = 0.012; ).
Identification of PPP1CB interaction partners/regulatory target genes
Using InBioMap, STRING, BioGRID, HPRD and IntAct, we identified 51, 10, 325, 11, and 273 PPP1CB candidate interaction partners/target genes, respectively (Supplementary file 1). Moreover, 222 genes from these five databases overlapped in at least two databases, shown in the Venn diagram (). These overlapping genes were selected for further analysis.
Enrichment analysis of candidate PPP1CB interacting partners
The biological processes and functions of 222 target genes through pathway enrichment analysis were explored. Enrichment analysis demonstrated that the target genes of PPP1CB take part in GO Biological Processes, including ‘regulation of dephosphorylation’, ‘actin filament-based movement’, ‘positive regulation of organelle organization’, ‘actomyosin structure organization’, ‘cell morphogenesis involved in differentiation’, ‘actin cytoskeleton organization’, ‘cell morphogenesis involved in differentiation’, ‘cell division’, ‘cell junction assembly’, ‘actin filament bundle assembly’, and ‘actin filament severing’. KEGG pathway analysis identified enrichment of target genes in the following KEGG Pathways: ‘Regulation of actin cytoskeleton’, ‘Tight junction’, ‘Adherens junction’ and ‘Oxytocin signaling pathway’. Metascape analysis identified Reactome gene sets including ‘Membrane Trafficking’, ‘EPH-Ephrin signaling’, ‘RHO GTPases activate PAKs’, ‘Gap junction degradation’, ‘Smooth Muscle Contraction’, and ‘Cell-Cell communication’, and CORUM protein complexes including ‘Emerin complex 1' ().
Table II. Gene Set Enrichment Analysis for PPP1CB target genes
Identification of node genes through PPI network analyses
PPI network analyses was performed using Metascape software () to further study the relationship between the 222 overlapping target genes. The MCODE algorithm was used to identify dense networks and to connect each adjacent MCODE component with different colors to represent different types of biological interactions. We identified 39 node genes: ACTB, ACTG1, ACTN4, ACTR2, ACTR3, ANLN, AP2A1, ARPC4, CALML3, CAPZA2, CAPZB, CFL1, CLTA, CLTB, CORO1B, CORO1C, DAB2, DBN1, EPS15, FLNA, FLNB, INF2, IQGAP1, LIMA1, MYH9, MYO18A, MYO19, MYO1B, MYO5A, MYO5C, PIK3C2A, SPTAN1, SPTBN1, SVIL, SYNPO, TMOD1, TMOD3, TPM1, and WDR1.
Node genes are differentially expressed between pancreatic adenocarcinoma and matched paracancerous tissue and may have prognostic value for PAAD outcomes
We used the GEPIA tool to analyze expression of the 39 node genes in PAAD tissues and matched paracancerous tissues (Supplementary file 2). The expression of ACTB, ACTG1, ACTN4, ACTR2, ACTR3, ANLN, AP2A1, ARPC4, CAPZA2, CAPZB, CFL1, CLTA, CLTB, CORO1B, CORO1C, DAB2, DBN1, EPS15, FLNA, FLNB, INF2, IQGAP1, LIMA1, MYH9, MYO18A, MYO5A, SPTAN1, SPTBN1, SVIL, SYNPO, TMOD3, TPM1, and WDR1 were significantly increased in PAAD tissue (P < 0.05) (Supplementary File 3). The GEPIA RNA-SEQ dataset is based on the UCSC Xena project and is analyzed through a standard pipeline (http://xena.ucsc.edu) [Citation19]. The GEPIA approach solves the problem of invalid analysis resulting from differences between different tumor types. Furthermore, the overall survival rate of PAAD cases with high expression of six nodal genes, ACTN4, ANLN, CLTB, IQGAP1, SPTAN1, and TMOD3, was significantly lower than those expressing low levels of these nodal genes. ()
SiRNA knockdown of PPP1CB expression in PAAD cells
We knocked down the expression of PPP1CB in PAAD cells and verified the knockdown of PPP1CB protein by Western Blot. All three of the siRNA constructs (si-PPP1CB-459, si-PPP1CB-911, and si-PPP1CB-1137) significantly inhibited PPP1CB expression in BXPC3, CAPAN-1, and PANC-1 cells; si-PPP1CB-1137 achieved the most significant down-regulation of PPP1CB, and was selected to knock down PPP1CB in subsequent experiments ().
PPP1CB facilitates the migration of PAAD cells
In order to study whether PPP1CB might contribute to PAAD metastasis, we used si-PPP1CB-1137 to knockdown PPP1CB expression in BXPC3, CAPAN-1, and PANC-1 cells. After transfection, the expression of PPP1CB in cells decreased and cell migration was inhibited. PAAD cell migration was significantly inhibited by si-PPP1CB 48 h after transfection, compared with the control group and the si-NC group. However, there was no significant difference in migration between the control group and the si-NC group. These results indicate that PPP1CB promotes the migration of PAAD cells in vitro ().
Effects of PPP1CB silencing on the invasion of PAAD cells in vitro
Transwell invasion assays were performed to evaluate the influence of PPP1CB knockdown on the invasion capability of BXPC3, CAPAN-1, and PANC-1 cells. Compared to the control group, the si-PPP1CB group exhibited significantly reduced cell invasion, while there was no difference between the control and si-NC group. These results demonstrate that PPP1CB knockdown inhibits the invasion of PAAD cells in vitro ()
PPP1CB expression in PAAD clinical samples
Immunohistochemical staining was performed to determine the expression levels of PPP1CB in 88 PAAD samples and matched paracancerous tissue samples (). PPP1CB expression was high in 50 PAAD tissue samples (56.82%) and low in 38 samples (43.18%). However, in the matched paracancerous tissues, PPP1CB expression was high in 34 samples (38.64%) and low in 54 samples (61.36%). Compared with the matched paracancerous tissue samples, PPP1CB expression in PAAD tissue was significantly increased (P = 0.016; ).
Table III. The expression levels of PPP1CB in clinical PAAD tissue are significantly higher compared with matched paracancerous tissue samples
PPP1CB expression levels are associated with clinicopathological characteristics
PPP1CB expression levels were found to be associated with sex (P = 0.048), alcohol use (P = 0.039), CEA (P = 0.038), N stage (P = 0.001), and invasion of nerve status (P = 0.036). PPP1CB expression was not significantly associated with other clinicopathological characteristics ().
Table IV. Relationship between PPP1CB expression and clinicopathological characteristics in PAAD patients
Relationship between the expression of PPP1CB and overall survival
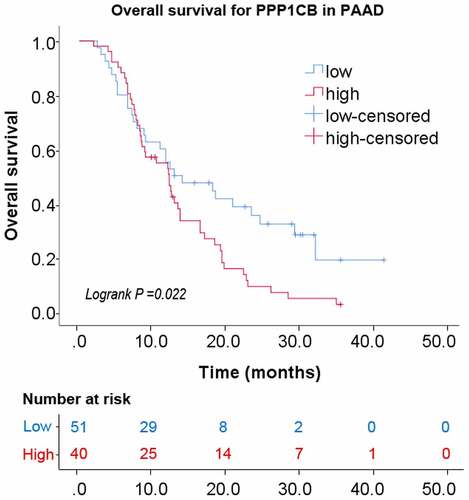
Kaplan–Meier analysis with a log-rank test was performed for univariate survival analyses. The overall survival of the PPP1CB high-expression group was significantly reduced than the PPP1CB low-expression group (P = 0.022; ). The results demonstrate a correlation between high PPP1CB expression and poor prognosis in PAAD, and suggest that PPP1CB might have value as an independent prognostic factor for PAAD outcomes.
Discussion
Pancreatic cancer (PAAD) is one of the main causes of cancer-related deaths especially in more developed countries [Citation3]. PAAD often lacks distinct symptoms at early stages, and the prognosis of PAAD is usually poor, with a 5-year survival rate of merely 8% [1]. Surgery is the only curative treatment for PAAD, and immunotherapy, chemotherapy and radiotherapy are only used to improve long-term survival as auxiliary therapies [Citation28]. The discovery of novel therapeutic targets is critical in the development of tumor-specific targeted treatments. New treatments have emerged in recent years, including targeted therapies that target genes involved in the pathophysiological processes of PAAD [Citation29]. Zhu et al. reported that reducing the activity of PPP1CB inhibits the progression of prostate cancer [Citation30]. Additionally, it has been shown that PPP1CB is related to tumor cell migration and metastasis, PPP1CB can promote actomyosin contraction and accelerate tumor metastasis when the PPP1CB inhibitor is phosphorylated [Citation9]. In this study, we conducted a bioinformatics analysis using the TCGA dataset to understand whether PPP1CB is related to the prognosis of PAAD, and validated the results in cell experiments in vitro and in clinical tissue samples from patients with PAAD. Our findings support the hypothesis that PPP1CB facilitates the progression of PAAD. The expression of PPP1CB in PAAD tissue was notably higher than in matched paracancerous tissues from patient samples. Experiments in vitro demonstrated that knockdown of PPP1CB inhibited the migration and invasion capability of PAAD cell lines. In addition, immunohistochemical staining of clinical tissue samples show that high PPP1CB expression was associated with sex, alcohol use, CEA, N stage and invasion of nerve. Survival analysis suggested that the overall survival rate of PAAD patients with low PPP1CB expression was better than patients with high PPP1CB expression. These data demonstrate that the expression levels of PPP1CB in PAAD tissue may have prognostic significance in predicting outcomes for patients with PAAD. In recent years, it has been reported that PPP1CA, PPP1CB, PPP2CA, PPP2CB, and PPP3CA accelerate the progression of pancreatic cancer, while PPP3CB, PPP5C, and PPP6C hinder PAAD progression [Citation16] .
In addition, studies have reported that PPP1CB has a positive relationship with the proliferation, migration and invasion of prostate cancer, gastric cancer, and melanoma, however studies have not evaluated the specific role of PPP1CB [Citation13,Citation14,Citation30]. In this study, the expression and prognosis of PPP1CB in PAAD was evaluated through bioinformatics analysis, and the relationship between PPP1CB expression, and migration and invasion ability was verified at the cellular level. Finally, immunohistochemical analysis of PPP1CB expression in clinical PAAD samples was used to determine whether PPP1CB can be used as an independent prognostic factor for PAAD. However, when exploring the relationship with PPP1CB expression level and clinicopathological characteristics, incomplete clinicopathological data collection may confound the results. Furthermore, the preponderance of Chinese patients represented in the PAAD and matched paracancerous tissue comparison necessitates that these results should be further verified in other ethnically diverse populations. In addition, the precise mechanism by which PPP1CB contributes to poor outcome of PAAD requires further evaluation.
Figure 1. PPP1CB expression profiling in cancer tissue and normal tissue from The Cancer Genome Atlas. (a) PPP1CB expression across tumor datasets (T; red dots) and matched paracancerous tissue (N; green dots) datasets. Each single point represents the expression of PPP1CB in a single sample. Comparison between tumor and normal tissue was performed using the GEPIA tool, and significantly elevated expression was determined by a high log2FC value and a percentage value greater than the threshold value. Cancer types indicated in red have significantly higher PPP1CB expression than corresponding normal tissue. (b) Kaplan‑Meier survival analysis of patients based on PPP1CB expression (data from TCGA datasets). HR: hazard ratio. *P < 0.05.
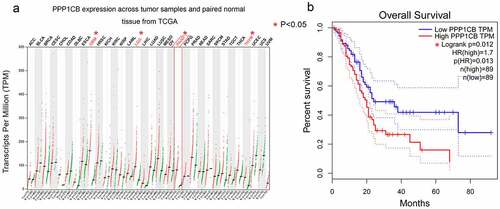
Figure 2. The Venn diagram produced by five databases to predict PPP1CB interacting partners and regulatory target genes. Each color represents the corresponding database
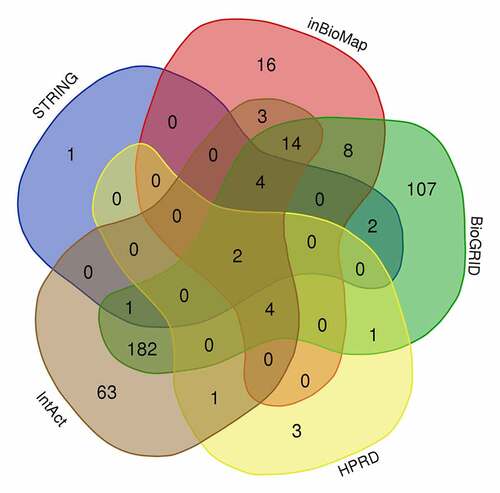
Figure 3. PPI network analysis of overlapping PPP1CB target genes. The PPI network contained 222 genes. Different nodes represent different genes and corresponding proteins connected in the PPI network. A variety of genes cooperate with each other to carry out biological functions. Red nodes indicate a node score of 13.64, blue nodes indicate a node score of 2.97, purple nodes indicate a node score of 2.875, orange nodes indicate a node score of 1.6, and green nodes indicate a node score of 1.273. Densely connected network components were identified via the MCODE algorithm, and the 39 genes with the highest score were selected as node genes (node score 13.64). PPI: protein protein interaction
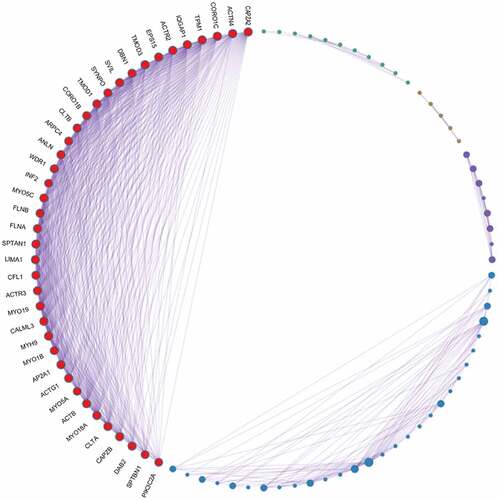
Figure 4. Evaluation of gene expression and prognostic significance of six nodal PPP1CB gene targets in PAAD. (a) Expression levels of six selected nodal genes were evaluated in PAAD and matched paracancerous tissues. The expression of 6 nodal genes in PAAD tissues (n = 179) was significantly higher compared with the matched paracancerous tissues (n = 171). Red and gray indicate PAAD and matched paracancerous tissues, respectively. (b) Prognostic value for the six nodal genes related to overall survival for patients with PAAD. Kaplan-Meier curves were generated using an online tool (data from the TCGA dataset). PAAD: pancreatic cancer. *P < 0.05.
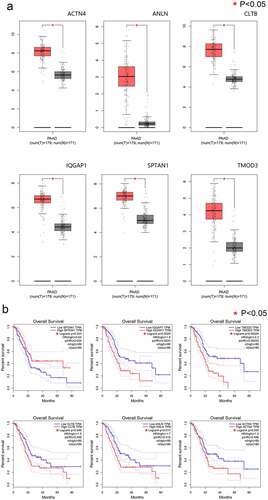
Figure 5. Effects of PPP1CB knockdown on invasion and migration of PAAD cell lines. (a) PPP1CB was knocked down in BXPC3, CAPAN-1, and PANC-1 cells using siRNA: si-NC (non-silencing control), si-PPP1CB-459, si-PPP1CB-911 and si-PPP1CB-1137. Knockdown efficiency was evaluated by Western Blot. (b) PPP1CB knockdown reduces PAAD cell migration. The wound healing assay was performed in BXPC3, CAPAN-1, and PANC-1 cell monolayers for 48 h, and the width of the gap for each group at 0 hours was used as the reference. (c) Invasion analyses of PAAD cells transfected with si-NC, or si-PPP1CB, relative to the invasion in the control group, reported as mean ± SD (n = 3). ***P < 0.001.
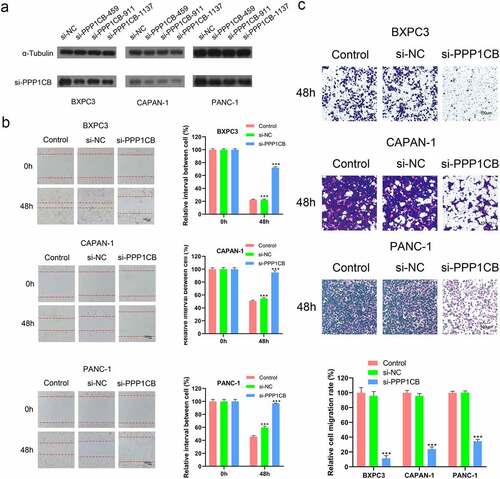
Figure 6. Photomicrographs of immunohistochemical staining for PPP1CB in PAAD clinical patient tissue samples. (a) Positive staining for PPP1CB. (b) Negative staining for PPP1CB. PPP1CB: protein phosphatase 1 catalytic subunit beta
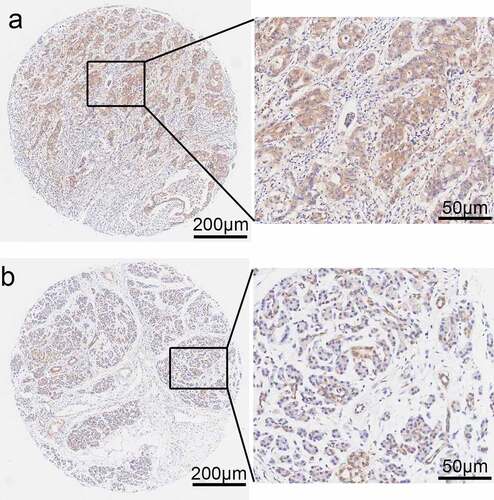
Figure 7. Kaplan-Meier analysis of PAAD. PPP1CB protein expression impact on overall survival. Immunohistochemical staining of PAAD tissue microarrays was used to determine the expression levels of PPP1CB. PPP1CB: protein phosphatase 1 catalytic subunit beta; PAAD: pancreatic adenocarcinoma
Conclusion
In conclusion, our data shows that PPP1CB may serve as an independent predictor of poor outcome, and PPP1CB has the potential to be used for early diagnosis of PAAD. Following further investigation, this could improve the survival of patients with pancreatic cancer.
Availability of Data and Materials
The datasets used and/or analyzed during the current study are available from the corresponding author upon reasonable request.
Authors’ contributions
ZX and YG conceived the idea; LY, HK and BW performed the experiments; LY, XG and FC analyzed the data; LY wrote the manuscript. All authors have read and approved the final version of the manuscript.
Disclosure of potential conflicts of interest
No potential conflict of interest was reported by the author(s).
Highlight
High PPP1CB expression is associated with poor prognosis in patients with PAAD in TCGA
PPP1CB promoted the migration and invasion capability of PAAD cell lines.
PPP1CB expression levels are associated with clinicopathological characteristics.
PPP1CB may serve as an independent predictor of poor outcome.
Supplemental Material
Download ()Acknowledgements
Not applicable.
Supplementary material
Supplemental data for this article can be accessed here
Additional information
Funding
Related Research Data
References
- Mizrahi JD, Surana R, Valle JW, et al. Pancreatic cancer. Lancet. 2020;395:2008–2020.
- Sano M, Takahashi R, Ijichi H, et al. Blocking VCAM-1 inhibits pancreatic tumour progression and cancer-associated thrombosis/thromboembolism. Gut. 2020. DOI:10.1136/gutjnl-2020-320608.
- Siegel RL, Miller KD, Jemal A. Cancer statistics. CA Cancer J Clin. 2020;70:7–30. [ 2020].
- Aroldi F, Bertocchi P, Rosso E, et al. Pancreatic Cancer: promises and Failures of Target Therapies. Rev Recent Clin Trials. 2016;11:33–38.
- Ansari D, Tingstedt B, Andersson B, et al. Pancreatic cancer: yesterday, today and tomorrow. Future Oncol. 2016;12:1929–1946.
- Yan Y, Ouellette MM. Rac1 GTPase in pancreatic cancer. Aging (Albany NY). 2015;7:609–610.
- Cohen PT. Protein phosphatase 1–targeted in many directions. J Cell Sci. 2002;115:241–256.
- Grassie ME, Moffat LD, Walsh MP, et al. The myosin phosphatase targeting protein (MYPT) family: a regulated mechanism for achieving substrate specificity of the catalytic subunit of protein phosphatase type 1δ. Arch Biochem Biophys. 2011;510:147–159.
- Madsen CD, Hooper S, Tozluoglu M, et al. STRIPAK components determine mode of cancer cell migration and metastasis. Nat Cell Biol. 2015;17:68–80.
- Aman A, Piotrowski T. Cell migration during morphogenesis. Dev Biol. 2010;341:20–33.
- Takaki T, Montagner M, Serres MP, et al. Actomyosin drives cancer cell nuclear dysmorphia and threatens genome stability. Nat Commun. 2017;8:16013.
- Capalbo L, Bassi ZI, Geymonat M, et al. The midbody interactome reveals unexpected roles for PP1 phosphatases in cytokinesis. Nat Commun. 2019;10(1):4513.
- Huang Z, Lin B, Pan H, et al. Gene expression profile analysis of ENO1 knockdown in gastric cancer cell line MGC-803. Oncol Lett. 2019;17:3881–3889.
- Sun D, Zhou M, Kowolik CM, et al. Differential expression patterns of capping protein, protein phosphatase 1, and casein kinase 1 may serve as diagnostic markers for malignant melanoma. Melanoma Res. 2011;21(4):335–343.
- Iacobazzi D, Garaeva I, Albertario A, et al. Protein Phosphatase 1 Beta is Modulated by Chronic Hypoxia and Involved in the Angiogenic Endothelial Cell Migration. Cell Physiol Biochem. 2015;36(1):384–394.
- Hang J, Lau SY, Yin R, et al. The role of phosphoprotein phosphatases catalytic subunit genes in pancreatic cancer. Biosci Rep. 2020;41(1).
- Liu J, Lichtenberg T, Hoadley KA, et al. An Integrated TCGA Pan-Cancer Clinical Data Resource to Drive High-Quality Survival Outcome Analytics. Cell. 2018;173(400–16):e11.
- Tang Z, Li C, Kang B, et al. GEPIA: a web server for cancer and normal gene expression profiling and interactive analyses. Nucleic Acids Res. 2017;45:W98–w102.
- Vivian J, Rao AA, Nothaft FA, et al. Toil enables reproducible, open source, big biomedical data analyses. Nat Biotechnol. 2017;35:314–316.
- Szklarczyk D, Gable AL, Lyon D, et al. STRING v11: protein-protein association networks with increased coverage, supporting functional discovery in genome-wide experimental datasets. Nucleic Acids Res. 2019;47:D607–d13.
- Li T, Wernersson R, Hansen RB, et al. A scored human protein-protein interaction network to catalyze genomic interpretation. Nat Methods. 2017;14:61–64.
- Oughtred R, Stark C, Breitkreutz BJ, et al. The BioGRID interaction database: 2019 update. Nucleic Acids Res. 2019;47:D529–d41.
- Peri S, Navarro JD, Amanchy R, et al. Development of human protein reference database as an initial platform for approaching systems biology in humans. Genome Res. 2003;13:2363–2371.
- Keshava Prasad TS, Goel R, Kandasamy K, et al. Human Protein Reference Database–2009 update. Nucleic Acids Res. 2009;37:D767–72.
- Orchard S, Ammari M, Aranda B, et al. The MIntAct project–IntAct as a common curation platform for 11 molecular interaction databases. Nucleic Acids Res. 2014;42:D358–63.
- Zhou Y, Zhou B, Pache L, et al. Metascape provides a biologist-oriented resource for the analysis of systems-level datasets. Nat Commun. 2019;10:1523.
- Shannon P, Markiel A, Ozier O, et al. Cytoscape: a software environment for integrated models of biomolecular interaction networks. Genome Res. 2003;13:2498–2504.
- McGuigan A, Kelly P, Turkington RC, et al. Pancreatic cancer: a review of clinical diagnosis, epidemiology, treatment and outcomes. World J Gastroenterol. 2018;24:4846–4861.
- Liu H, Ma Q, Xu Q, et al. Therapeutic potential of perineural invasion, hypoxia and desmoplasia in pancreatic cancer. Curr Pharm Des. 2012;18:2395–2403.
- Zhu Y, Kosmacek EA, Chatterjee A, et al. MnTE-2-PyP Suppresses Prostate Cancer Cell Growth via H(2)O(2) Production. Antioxidants (Basel). 2020;9;9(6):490.