
ABSTRACT
In this study, we evaluated the diagnostic value of key genes in myocardial infarction (MI) based on data from the Gene Expression Omnibus (GEO) database. We used data from GSE66360 to identify a set of significant differentially expressed genes (DEGs) between MI and healthy controls. Logistic regression, least absolute shrinkage and selection operator (LASSO) regression, support vector machine recursive feature elimination (SVM-RFE), and SignalP 3.0 server were used to identify the potential role of genes in predicting diagnosis in patients with MI. Principal component analysis (PCA), receiver operating characteristic (ROC) curve analyses, area under the curve (AUC) analyses, and C-index were used to estimate the diagnostic value of genes in patients with MI. The association was validated using six other independent data sets. Subsequently, bioinformatics analysis was conducted based on the aforementioned potential genes. A meta-analysis was performed to evaluate the diagnostic value of the genes in MI. Forty-four DEGs were selected from the GSE66360 dataset. A three-gene signature consisting of CCL20, IL1R2, and ITLN1 could effectively distinguish patients with MI. The three-gene signature was validated in seven independent cohorts. Functional enrichment and Kyoto Encyclopedia of Genes and Genomes (KEGG) analyses were performed to reveal the involvement of the three-gene signature in inflammation-related biological processes and pathways. Moreover, diagnostic meta-analysis results of the three-gene signature showed that the pooled sensitivity, specificity, and AUC for MI were 0.80, 0.90, and 0.93, respectively. These results suggest that the three-gene signature is a novel candidate biomarker for distinguishing MI from healthy controls.
Graphical abstract
1. Introduction
Myocardial infarction (MI), also known as a heart attack, is a leading cause of hospital admission and mortality worldwide [Citation1,Citation2]. Early prevention, screening, monitoring, diagnosis, and treatment may reduce the incidence and mortality of MI. However, recent research advances in effective treatment for MI are lacking; thus, the best strategies for determining treatment methods should focus on early diagnosis aimed at managing the underlying etiologies and MI-related complications. Although cardiac troponin T (cTnT) and creatine kinase MB (CK-MB) are useful diagnostic tools for MI, their relatively low diagnostic accuracy limits their application [Citation3–5]. Previous studies have also shown that a relatively low level of cTnT is difficult to detect in the serum of healthy individuals [Citation6,Citation7]. The concentration of CK-MB in the blood decreases gradually after the onset of acute MI (36–72 h), becoming almost equivalent to normal levels [Citation7,Citation8]. Molecular markers are critical for the research and clinical treatment of cardiovascular diseases [Citation9–12]. Therefore, the identification of promising novel molecular markers is crucial for enhancing our understanding of MI initiation and progression and promoting the early detection of MI.
The National Center for Biotechnology Information developed the Gene Expression Omnibus (GEO) database, a consolidation of available transcriptomic data, to further expand the scope of biomedical research. With the rapid development of gene microarray technology, the database provides an efficient alternative for screening genetic alterations at the genome level. Furthermore, it is beneficial for confirming the differentially expressed genes (DEGs) and functional pathways involved in the progression of MI. However, it is challenging to identify reliable results obtained from independent microarray analyses. Many studies have identified novel molecular markers for predicting diagnosis in patients with MI and the underlying mechanisms of MI using microarray analysis [Citation9,Citation11–14].
Therefore, in the current study, DEGs between patients with MI and healthy controls were identified, followed by univariable logistic regression, least absolute shrinkage and selection operator (LASSO) regression, support vector machine recursive feature elimination (SVM-RFE) [Citation15,Citation16], SignalP 3.0 server [Citation17,Citation18], and multivariable logistic regression analyses. Using receiver operating characteristic (ROC) curve analyses, the area under the curve (AUC), and the C-index, a robust MI diagnosis-related gene signature was used to estimate the diagnostic value of genes in patients with MI. Subsequently, the diagnosis-related gene signature was validated using seven independent data sets. Furthermore, the diagnosis-related gene signature was explored to determine its accuracy in discriminating MI from healthy control tissues by performing a meta-analysis of all data sets.
2. Materials and methods
2.1. Data mining based on the GEO database
Initially, microarray data up to December 2019 were downloaded from the GEO database (http://www.ncbi.nlm.nih.gov/geo/). The search term ‘myocardial infarction’ was used in this study. Microarray data were considered eligible if they were obtained from case-control studies that reported differences in gene expression profiles between patients with MI and healthy controls. The exclusion criteria were as follows: (1) duplicate microarray data, (2) lack of case-control data, (3) non-human data, and (4) sample size of less than 12 [Citation19]. Seven GEO data sets were identified and included according to the inclusion criteria (see ). shows a flow diagram of the selection of the GEO data sets used in this study. For the available data sets, normalized gene expression profile data were downloaded from the GEO database.
Table 1. Information on the included microarray data sets
Figure 1. Flow chart of microarray data set selection
2.2. Identification of the diagnosis-related gene signature associated with MI
The GSE66360 data set [Citation14] contained the largest number of samples and was used as the training cohort to identify a diagnosis-related gene signature associated with MI. Initially, to identify the DEGs between MI and control tissues, we used the edgeR package in R statistical software with the following thresholds: false discovery rate (FDR) < 0.05 and |log fold change (logFC)|>2. Then, the DEGs with statistical significance in the univariable logistic regression analysis were subjected to LASSO regression analysis to obtain the diagnostic genes from the patients with MI. Another method, such as SVM-RFE, was simultaneously used to screen the genes for MI diagnosis. Then, we combined the LASSO and SVM methods to obtain the first-rank common MI genes. To identify clinically detectable serum biomarkers in patients with MI, the optimal diagnostic genes were investigated using the SignalP 3.0 server (http://www.cbs.dtu.dk/services/SignalP-3.0/). Finally, multivariable logistic regression analysis was utilized to build a diagnosis-related gene signature by incorporating the detectable features selected from the peripheral blood of patients in the SignalP 3.0 server. Principal component analysis (PCA) was used to demonstrate the ability of a diagnosis-related gene signature to distinguish between MI and controls. ROC curve analyses and AUC were used to estimate the diagnostic value of the diagnosis-related gene signature in patients with MI and controls. Moreover, Harrell’s C-index was calculated to quantify the discrimination performance of the diagnosis-related gene signature. Statistical significance was set at P < 0.05.
2.3. Validation of the diagnosis-related gene signature
The following six data sets were used as validation sets: GSE141512, GSE24519, GSE34198, GSE48060, GSE60993, and GSE109048. To validate whether the candidate genes have important diagnostic value in patients with MI, we also measured the ROC curve value, AUC value, and C-index in the validation sets.
2.4. Functional and pathway enrichment analyses of the diagnosis-related gene signature
Functional analysis of the diagnosis-related gene signature was performed using Gene Ontology (GO) and Kyoto Encyclopedia of Genes and Genomes (KEGG) pathway analyses using the clusterProfiler and org.Hs.eg.db packages [Citation20]. GO terms and KEGG pathways were considered statistically significant at P< 0.05.
2.5. Meta-analysis
The sensitivity and specificity of each included data set were calculated using diagnosis-related gene signatures. Then, true positives, false negatives, false positives, and true negatives were tabulated and stratified by the included data sets in patients with MI and controls. A meta-analysis was subsequently performed to determine the pooled sensitivity, specificity, positive likelihood ratio (PLR), negative likelihood ratio (NLR), diagnostic odds ratio (DOR), bivariate summary receiver operator characteristic (SROC) curve, and AUC, which indicated the overall diagnostic value of the diagnosis-related gene signature in distinguishing patients with MI from controls. Statistical heterogeneity among the data sets was assessed using Cochran’s Q statistic and I2 tests. Values of 25%, 50%, and 75% for the I2 test were suggestive of the presence of low, medium, and high heterogeneity, respectively. In addition, Fagan’s nomogram was used to determine the clinical utility of the diagnosis-related gene signature. Meta-regression analysis was performed to investigate the effects of potential factors on the diagnostic ability of MI. We assessed the publication bias of the included data sets using Deeks’ regression test for funnel plot asymmetry [Citation21]. All statistical analyses were conducted using STATA 14.0 (Stata Corp., College Station, TX, USA) [Citation22]. Meta-DiSc 1.4 (XI Cochrane Colloquium, Barcelona, Spain) was used to determine the threshold effect [Citation23]. Statistical significance was set at P < 0.05.
3. Results
3.1. Identification of the diagnosis-related gene signature for MI
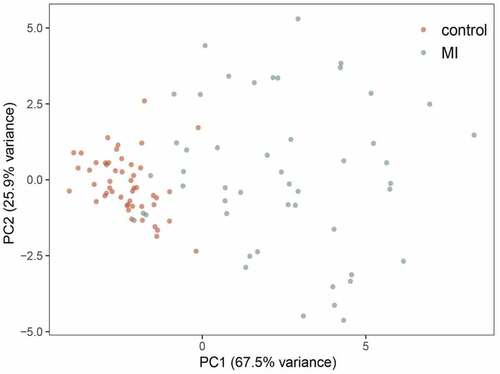
A total of 44 DEGs were identified by the gene profiling data of the discovery group () and subjected to univariable logistic regression analysis (). Among them, eight DEGs were selected by the LASSO and SVM methods for further investigation using the SignalP 3.0 server (). On the premise of considering signal peptide probability, we identified three DEGs: CCL20, IL1R2, and ITLN1. The three DEGs were analyzed by multivariable logistic regression, and the results showed that CCL20, IL1R2, and ITLN1 remained significantly associated with MI ()). Next, we used CCL20, IL1R2, and ITLN1 to construct a diagnosis-related gene signature to distinguish patients with MI from healthy controls. The PCA results indicated that MI could be distinguished from the control group based on these three genes (). Considering the discriminatory ability of the diagnosis-related gene signature, ROC curve analysis was conducted. The sensitivity, specificity, and AUC were 0.918, 0.980, and 0.975, respectively, indicating a high prediction efficacy of the diagnosis-related gene signature for MI. Moreover, the C-index of 0.975 for the three DEGs in MI patients also indicated good discriminatory ability.
Figure 2. Differentially expressed genes (DEGs) between myocardial infarction (MI) and healthy control tissues
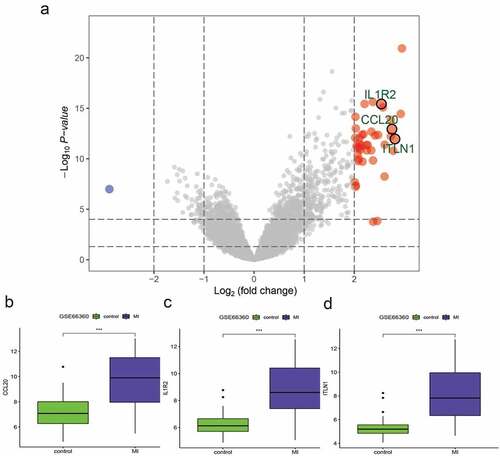
Figure 3. Univariate logistic regression of differentially expressed genes (DEGs) between myocardial infarction (MI) and healthy control tissues
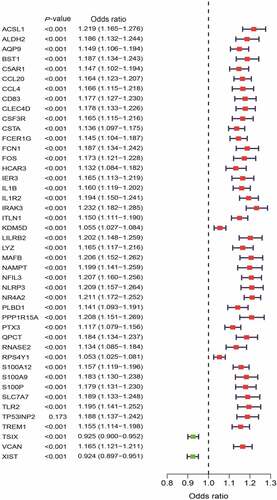
Figure 4. Identification of the three-gene signature for patients with myocardial infarction (MI) in the GSE66360 data set. (a, b) Eight differentially expressed genes (DEGs) were identified by least absolute shrinkage and selection operator (LASSO) regression. (c, d) Line plot of 5-fold cross-validation of the support vector machine recursive feature elimination (SVM-RFE) algorithm for feature selection. (e) Venn diagram of LASSO and SVM-RFE. (f) Three DEGs were identified by using the SignalP 3.0 server. (g)The three-gene signature was identified by multivariable logistic regression
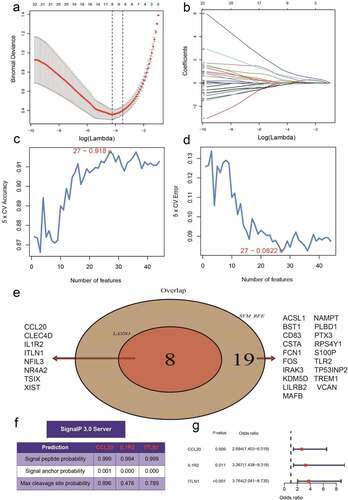
Figure 5. Principal component analysis of the three-gene signature for patients with myocardial infarction (MI) in the GSE66360 data set
3.2. Validation of the three-gene signature in six independent cohorts
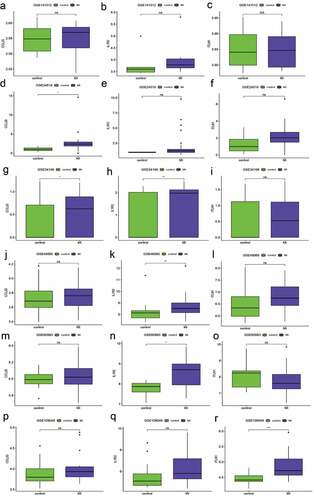
The robustness of the three-gene signature was regarded as a candidate biomarker for predicting diagnosis in patients with MI, while the validation cohort consisted of the remaining data sets (GSE141512, GSE24519, GSE34198, GSE48060, GSE60993, and GSE109048). However, the expression levels of the three hub genes (CCL20, IL1R2, and ITLN1) are shown in . According to the Wilcoxon test, the expression differences in the three genes in six GEO terms were significantly different from those in GSE66360. The AUC value for the validation cohort showed that the three-gene signature had variable predictive power. Four data sets showed good accuracy in predicting MI (AUC = 0.78 GSE48060, AUC = 0.978 in GSE24519, AUC = 0.882 in GSE60993, and AUC = 0.867 in GSE109048), but the remainder of the data sets showed weak predictive power (AUC = 0.639 in GSE141512 and AUC = 0.652 in GSE34198). The sensitivity and specificity for the validation cohort are displayed in and indicate that the ability of the three-gene signature to distinguish patients with MI from controls was the same as that of the AUC. Additionally, the C-indexes for the six data sets were similar to the effects of the AUCs ().
Table 2. Sensitivity, specificity, AUC, and C-index of the classification performance of the three-gene signature in six data sets
Figure 6. The relative expression of three hub genes validated by six Gene Expression Omnibus (GEO) terms
3.3. Functional annotation
Analysis of the three-gene signature by GO categories and KEGG pathways was crucial for our understanding of biological functions. In this study, the top enriched GO terms for biological processes (BP) were as follows: cellular response to interleukin-1, response to interleukin-1, and negative regulation of interleukin-1 secretion; and molecular function (MF): RAGE receptor binding, Toll-like receptor binding, and carbohydrate-binding (). Functional enrichment analysis showed that the top 20 KEGG pathways included the chemokine signaling pathway, IL-17 signaling pathway, and TNF signaling pathway ().
Table 3. GO functional annotation of the three-gene signature
Table 4. KEGG pathway analysis of the three-gene signature
3.4. Meta-analysis for diagnosis
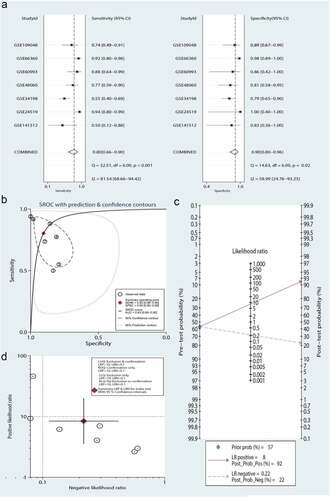
A total of seven data sets were included in the meta-analysis to determine the diagnostic value of the three-gene signature. As shown in , the pooled sensitivity and specificity estimates for the three-gene signature were 0.80 (95% CI: 0.66–0.90) and 0.90 (95% CI: 0.80–0.96), respectively. The moderate informational value of the three-gene signature implied a PLR (8.4), but the NLR (0.22) indicated minimal informational value. ) shows the use of the likelihood ratio scattergram for investigating diagnostic value; when the right lower quadrant was depicted, the three-gene signature was useful for confirming the presence of MI (while positive), but not its exclusion (while negative). The DOR and area under the ROC curve were 39 (95% CI: 9–159) and 0.93 (95% CI: 0.90–0.95), respectively, which indicated that the three-gene signature has good discriminatory ability for MI. ) depicts the use of Fagan’s nomogram for calculating posttest probabilities; the three-gene signature increased the likelihood of MI from 57% to 92%, and the risk decreased to 22% when a negative result was confirmed.
Figure 7. Meta-analysis of the three-gene signature for predicting diagnosis in patients with myocardial infarction (MI). (a) Forest plots of the pooled sensitivity and specificity of the three-gene signature in the diagnosis of MI. (b) Summary receiver operating characteristic (SROC) curve of the three-gene signature. (c) Fagan’s nomogram was used to evaluate the clinical utility of the three-gene signature for the diagnosis of MI. (d) Likelihood ratio scattergram
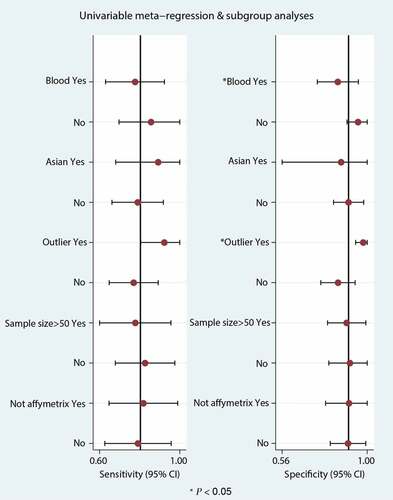
Significant heterogeneity was observed (81.54% sensitivity and 58.99% specificity) among the seven included data sets. Thus, to identify the source of heterogeneity, we analyzed heterogeneity from the perspective of a threshold effect, publication bias, bivariate box plot, and meta-regression. The Spearman correlation analysis (correlation coefficient = −0.714, P = 0.071) revealed no threshold effect on the three-gene signature for distinguishing patients with MI from healthy controls. Deeks’ funnel plot asymmetry test demonstrated no potential publication bias in our data sets (t = −0.30; P = 0.77) ()). The bivariate box plot revealed that the central location included six data sets and one data set as the outlier, suggesting a low degree of indirect heterogeneity ()). Then, meta-regression was performed to analyze patient size, location, source of the tissue, median distribution, and platforms. The major sources of heterogeneity for specificity were the tissue source and the median distribution. However, the potential sources of heterogeneity for sensitivity have not yet been confirmed. The meta-regression results are presented in .
Figure 8. The source of heterogeneity was analyzed from the perspectives of publication bias and a bivariate box plot. (a) Deeks’ funnel plot asymmetry test for identifying publication bias. (b) Bivariate boxplot
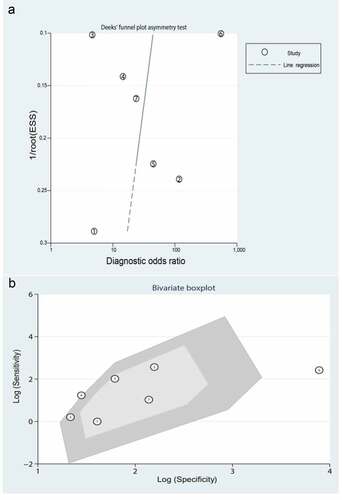
Figure 9. Univariable meta-regression and subgroup analysis in the meta-analysis
4. Discussion
In the present study, we utilized the higher expression of CCL20, IL1R2, and ITLN1 in patients with MI compared with that in healthy controls to construct a model that showed excellent diagnostic performance for patients in the seven data sets. An additional diagnostic meta-analysis demonstrated that the three-gene signature exhibited outstanding performance in predicting the diagnosis of patients with MI. In this study, the area under the ROC curve of the three-gene signature was 0.93, indicating that the three-gene signature can be considered a candidate therapeutic target for patients with MI. Interestingly, the SignalP 3.0 analysis indicated that CCL20, IL1R2, and ITLN1 may act as secretory molecules. Therefore, high CCL20, IL1R2, and ITLN1 expression might be detected in the blood and serve as early diagnostic biomarkers for MI.
Recently, an increasing number of studies have shown that CCL20, IL1R2, and ITLN1 are correlated with MI [Citation9,Citation24–40]. It was also revealed that the stimulation of peripheral blood mononuclear cells by transforming growth factor-β could lead to enhanced CCL20 expression [Citation26]. Additionally, the increased trend in the serum levels of CCL20 in MI patients was not significantly increased compared to that in healthy controls. One potential reason for this result might be the insufficient sample size used to perform the statistical analysis. However, a previous study demonstrated that the serum levels of CCL20 were significantly higher in patients with ischemic heart disease, including acute MI, stable angina, and unstable angina [Citation31]. Moreover, a previous study implied that T cell death-associated gene 8 (TDAG8) negatively regulates the transcription of the chemokine CCL20, subsequently increasing the expression of CCL20 in TDAG8-KO mice and contributing to the survival rate and cardiac function by suppressing CCL20 [Citation29]. It should be noted that CCL20 expression increased after the activation of mitogen-activated protein kinase by stimulating IL-17 signaling. When CCL20 binds to the CCR6 receptor, it plays an essential role in promoting the chemoattraction of leukocytes and mediating the translocation of γδT cells to the inflamed locus, thus aggravating cardiac function [Citation28,Citation35]. Fu et al. demonstrated that CCL20 expression was significantly increased in MI tissues, but miR-19a expression was indeed decreased. It is speculated that miR-19a/CCL20 can be used to alleviate MI [Citation39]. Interestingly, the reduction of cardiovascular events in patients with psoriasis treated with tofacinib and etanercept is closely related to the reduction in CCL20 (known as cardiovascular protein). This further indicates that CCL20 may be a therapeutic target for MI [Citation40].
As a cytokine receptor of the IL-1 receptor family, IL1R2 has been reported as a key mediator of many cytokines involved in immune and inflammatory response induction, including the progression of coronary atherosclerosis. For example, Lian et al. reported that IL1R2 was mediated by miR-383-3p to prevent injury/inflammatory damage in coronary artery endothelial cells by inhibiting the activation of the inflammasome signaling pathway [Citation36]. IL1R2 has two different protein isoforms: its membrane-bound isoform and its soluble form (soluble IL-1 receptor 2), which are significantly associated with left ventricular remodeling in patients with ST-elevation MI [Citation27]. These findings show that IL1R2 plays an important role in MI.
Omentin-1, also referred to as ITLN1, is a novel adipokine involved in glucose metabolism, inflammation, and atherosclerosis [Citation32,Citation41]. Circulating omentin is associated with coronary artery disease [Citation42]. Shibata et al. found that low levels of ITLN1 are related to coronary artery disease (CAD) and that ITLN1 can be considered a novel biomarker for CAD [Citation42]. Serum ITLN1 levels in patients with acute MI are low, and these levels can be used as an independent risk factor to predict the onset of acute MI. Thus, ITLN1 is expected to become an important index for evaluating the occurrence of coronary heart disease [Citation43]. Zhu et al. showed that ITLN1 can inhibit myocardial ischemia-reperfusion injury and negative remodeling associated with injury [Citation25]. Similarly, Kadoglou et al. reported that ITLN1 expression was significantly low in patients with acute MI at admission, but significantly high upon the suppression of inflammation after six months in the hospital. These results imply that ITLN1 may be a novel treatment target for acute MI [Citation33]. It also been reported that ITLN1 is a therapeutic target in diabetic patients with acute MI. The ITLN1 levels in the metformin-treated group were significantly higher than those in the other two groups (non-metformin-treated group and healthy controls). This study suggests that metformin can increase the serum level of ITLN1 and may be a potential drug for preventing acute MI in diabetic patients [Citation44]. Moreover, a study showed that metformin treatment in non-diabetic patients can also produce direct or indirect cardioprotective effects by increasing ITLN1 levels [Citation45]. In contrast, Menzel et al. showed that ITLN1 was not significantly associated with risk of MI after multivariable adjustment [Citation32].
There are several limitations to our study that should be considered. The main limitation was the small sample size of the published data sets. Our findings need to be validated in other data sets and clinical trials to determine whether CCL20, IL1R2, and ITLN1 may act as biomarkers for MI. Moreover, the three-gene signature was based only on in silico methods, and only a fraction of the human genome was included in the analysis. Therefore, the diagnostic genes do not represent all gene candidates that may be associated with MI. Finally, the mechanisms through which the three-gene signature modulates MI progression need to be further investigated. However, despite these drawbacks, this study provides a potentially powerful diagnostic marker for MI.
5. Conclusions
In summary, the three-gene signature comprising CCL20, IL1R2, and ITLN1 was significantly associated with MI diagnosis and could provide potential therapeutic targets and novel therapeutic strategies for MI.
Highlights
1.CCL20, IL1R2, and ITLN1 were selected as hub gene in MI by bioinformatics analysis.
2.CCL20, IL1R2, and ITLN1 were significantly upregulated in MI patients.
3.A three-gene signature (CCL20, IL1R2, and ITLN1) may be a novel candidate biomarker for distinguishing MI from healthy controls.
Data availability
The data supporting the findings of this study are available in the Gene Expression Omnibus (GEO) database (GSE66360, GSE141512, GSE24519, GSE34198, GSE48060, GSE60993, and GSE109048).
Disclosure statement
The authors report no conflict of interest.
Additional information
Funding
References
- Liu K, Zhao D, Wang D. LINC00528 regulates myocardial infarction by targeting the miR-143-3p/COX-2 axis. Bioengineered. 2020;11(1):11–18.
- Wang C, Jing Q. Non-coding RNAs as biomarkers for acute myocardial infarction. Acta Pharmacol Sin. 2018;39(7):1110–1119.
- Liu N, Zheng F, Zheng X. Detection of biomarkers of acute myocardial infarction by high-throughput suspension array technology in serum sample. Bioanalysis. 2018;10(1):47–58.
- Zhao J, Yu H, Yan P, et al. Circulating microRNA-499 as a diagnostic biomarker for acute myocardial infarction: a meta-analysis. Dis Markers. 2019;2019:6121696.
- de Winter RJ, Koster RW, Sturk A, et al. Value of myoglobin, troponin T, and CK-MBmass in ruling out an acute myocardial infarction in the emergency room. Circulation. 1995;92(12):3401–3407.
- Chan D, Ng LL. Biomarkers in acute myocardial infarction. BMC Med. 2010;8:34.
- Christenson RH, Vollmer RT, Ohman EM, et al. Relation of temporal creatine kinase-MB release and outcome after thrombolytic therapy for acute myocardial infarction. TAMI study group. Am J Cardiol. 2000;85(5):543–547.
- Rakowski T, Dziewierz A, Legutko J, et al. Creatine kinase-MB assessed in patients with acute myocardial infarction correlates with cardiac magnetic resonance infarct size at 6-month follow up. Hellenic J Cardiol. 2014;55(1):4–8.
- Chen DQ, Kong XS, Shen XB, et al. Identification of differentially expressed genes and signaling pathways in acute myocardial infarction based on integrated bioinformatics analysis. Cardiovasc Ther. 2019;2019:8490707.
- Cheng Q, Zhang M, Zhang M, et al. Long non-coding RNA LOC285194 regulates vascular smooth muscle cell apoptosis in atherosclerosis. Bioengineered. 2020;11(1):53–60.
- Gobbi G, Carubbi C, Tagliazucchi GM, et al. Sighting acute myocardial infarction through platelet gene expression. Sci Rep. 2019;9(1):19574.
- Park HJ, Noh JH, Eun JW, et al. Assessment and diagnostic relevance of novel serum biomarkers for early decision of ST-elevation myocardial infarction. Oncotarget. 2015;6(15):12970–12983.
- Zdenek Valenta IM, Kolar M, Grunfeldova H, et al. Determinants of excess genetic risk of acute myocardial infarction-a matched case-control study. Eur J Biomed Inform. 2012;8(1):34–43.
- Muse ED, Kramer ER, Wang H, et al. A whole blood molecular signature for acute myocardial infarction. Sci Rep. 2017;7(1):12268.
- Wang Y, Chen L, Ju L, et al. Tumor mutational burden related classifier is predictive of response to PD-L1 blockade in locally advanced and metastatic urothelial carcinoma. Int Immunopharmacol. 2020;87:106818.
- Fang Q, Wang Q, Zhou Z, et al. Consensus analysis via weighted gene co-expression network analysis (WGCNA) reveals genes participating in early phase of acute respiratory distress syndrome (ARDS) induced by sepsis. Bioengineered. 2021;12(1):1161–1172.
- Emanuelsson O, Brunak S, von Heijne G, et al. Locating proteins in the cell using TargetP, SignalP and related tools. Nat Protoc. 2007;2(4):953–971.
- Bendtsen JD, Nielsen H, von Heijne G, et al. Improved prediction of signal peptides: signalP 3.0. J Mol Biol. 2004;340(4):783–795.
- Obuchowski NA, McClish DK. Sample size determination for diagnostic accuracy studies involving binormal ROC curve indices. Stat Med. 1997;16(13):1529–1542.
- Yu G, Wang LG, Han Y, et al. clusterProfiler: an R package for comparing biological themes among gene clusters. OMICS. 2012;16(5):284–287.
- Deeks JJ, Macaskill P, Irwig L. The performance of tests of publication bias and other sample size effects in systematic reviews of diagnostic test accuracy was assessed. J Clin Epidemiol. 2005;58(9):882–893.
- Dwamena BA. Midas: a program for meta-analytical integration of diagnostic accuracy studies in stata. University of Michigan; 2007. Available from: http://sitemaker.umich.edu/metadiagnosis/midas_home
- Zamora J, Abraira V, Muriel A, et al. Meta-DiSc: a software for meta-analysis of test accuracy data. BMC Med Res Methodol. 2006;6:31.
- Zhang R, Ji Z, Qu Y, et al. Clinical value of ARG1 in acute myocardial infarction patients: bioinformatics-based approach. Biomed Pharmacother. 2020;121:109590.
- Zhu Y, Hu C, Du Y, et al. Time-dependent change in omentin-1 level correlated with early improvement of myocardial function in patients with first anterior ST-segment elevation myocardial infarction after primary percutaneous coronary intervention. J Atheroscler Thromb. 2019;26(10):856–867.
- Lin CF, Su CJ, Liu JH, et al. Potential effects of CXCL9 and CCL20 on cardiac fibrosis in patients with myocardial infarction and isoproterenol-treated rats. J Clin Med. 2019;8(5). DOI:10.3390/jcm8050659
- Orrem HL, Shetelig C, Ueland T, et al. Soluble IL-1 receptor 2 is associated with left ventricular remodelling in patients with ST-elevation myocardial infarction. Int J Cardiol. 2018;268:187–192.
- Chang SL, Hsiao YW, Tsai YN, et al. Interleukin-17 enhances cardiac ventricular remodeling via activating MAPK pathway in ischemic heart failure. J Mol Cell Cardiol. 2018;122:69–79.
- Nagasaka A, Mogi C, Ono H, et al. The proton-sensing G protein-coupled receptor T-cell death-associated gene 8 (TDAG8) shows cardioprotective effects against myocardial infarction. Sci Rep. 2017;7(1):7812.
- Stejskal D, Vaclavik J, Smekal A, et al. Omentin-1 levels in patients with premature coronary artery disease, metabolic syndrome and healthy controls. Short communication. Biomed Pap Med Fac Univ Palacky Olomouc Czech Repub. 2016;160(2):219–221.
- Safa A, Rashidinejad HR, Khalili M, et al. Higher circulating levels of chemokines CXCL10, CCL20 and CCL22 in patients with ischemic heart disease. Cytokine. 2016;83:147–157.
- Menzel J, Di Giuseppe R, Biemann R, et al. Omentin-1 and risk of myocardial infarction and stroke: results from the EPIC-Potsdam cohort study. Atherosclerosis. 2016;251:415–421.
- Kadoglou NP, Tahmatzidis DK, Giannakoulas C, et al. Serum levels of novel adipokines, omentin-1 and chemerin, in patients with acute myocardial infarction: KOZANI STUDY. J Cardiovasc Med (Hagerstown). 2015;16(5):341–346.
- Kataoka Y, Shibata R, Ohashi K, et al. Omentin prevents myocardial ischemic injury through AMP-activated protein kinase- and Akt-dependent mechanisms. J Am Coll Cardiol. 2014;63(24):2722–2733.
- Yan X, Shichita T, Katsumata Y, et al. Deleterious effect of the IL-23/IL-17A axis and γδT cells on left ventricular remodeling after myocardial infarction. J Am Heart Assoc. 2012;1(5):e004408.
- Lian Z, Lv FF, Yu J, et al. The anti-inflammatory effect of microRNA-383-3p interacting with IL1R2 against homocysteine-induced endothelial injury in rat coronary arteries. J Cell Biochem. 2018;119(8):6684–6694.
- Yabluchanskiy A, Ma Y, DeLeon-Pennell KY, et al. Myocardial infarction superimposed on aging: MMP-9 deletion promotes M2 macrophage polarization. J Gerontol A Biol Sci Med Sci. 2016;71(4):475–483.
- Mohammad MA, Noc M, Lang I, et al. Proteomics in hypothermia as adjunctive therapy in patients with ST-segment elevation myocardial infarction: a CHILL-MI Substudy. Ther Hypothermia Temp Manag. 2017;7(3):152–161.
- Fu Q, Mo TR, Hu XY, et al. miR-19a mitigates hypoxia/reoxygenation-induced injury by depressing CCL20 and inactivating MAPK pathway in human embryonic cardiomyocytes. Biotechnol Lett. 2021;43(2):393–405.
- Kim J, Tomalin L, Lee J, et al. Reduction of inflammatory and cardiovascular proteins in the blood of patients with psoriasis: differential responses between tofacitinib and etanercept after 4 weeks of treatment. J Invest Dermatol. 2018;138(2):273–281.
- Smékal A, Václavík J, Stejskal D, et al. Plasma levels and leucocyte RNA expression of adipokines in young patients with coronary artery disease, in metabolic syndrome and healthy controls. Cytokine. 2019;122:154017.
- Shibata R, Ouchi N, Kikuchi R, et al. Circulating omentin is associated with coronary artery disease in men. Atherosclerosis. 2011;219(2):811–814.
- Baig M, Alghalayini KW, Gazzaz ZJ, et al. Association of serum omentin-1, chemerin, and leptin with acute myocardial infarction and its risk factors. Pak J Med Sci. 2020;36(6):1183–1188.
- Alkuraishy HM, Al-Gareeb AI. New insights into the role of metformin effects on serum omentin-1 levels in acute myocardial infarction: cross-sectional study. Emerg Med Int. 2015;2015:283021.
- Preiss D, Lloyd SM, Ford I, et al. Metformin for non-diabetic patients with coronary heart disease (the CAMERA study): a randomised controlled trial. Lancet Diabetes Endocrinol. 2014;2(2):116–124.