
ABSTRACT
The aim of this study was to identify hub genes closely related to the pathogenesis and prognosis of thyroid carcinoma (THCA) by integrated bioinformatics analysis. In this study, through differential gene expression analysis, 1916 and 665 differentially expressed genes (DEGs) were obtained from The Cancer Genome Atlas (TCGA) and Gene Expression Omnibus (GEO) database, and 7 and 11 co-expressed modules were identified from the TCGA-THCA and GSE153659 datasets, respectively, by weighted gene co-expression network analysis. We identified 162 overlapping genes between the DEGs and co-expression module genes as candidate hub genes. Gene Ontology (GO) and Kyoto Encyclopedia of Genes and Genomes (KEGG) pathway enrichment analyses of the 162 overlapping DEGs identified significant functions and pathways of THCA, such as thyroid hormone generation and metabolic process. A protein–protein interaction (PPI) analysis detected the top 10 hub genes (QSOX1, WFS1, EVA1A, FSTL3, CHRDL1, FABP4, PRDM16, PPARGC1A, PPARG, COL23A1). Finally, survival analysis, clinical correlation analysis, and protein abundance validation confirmed that 3 of the 10 hub genes were associated with survival prognosis of patients with THCA, and 8 of them were associated with the clinical stages of THCA. In summary, we identified hub genes and key modules that were closely related to THCA, and validated these genes by survival analysis, clinical correlation analysis, and Human Protein Atlas image analysis. Our results provide important information that will help to elucidate the pathogenesis of THCA and identify novel candidate prognostic biomarkers and potential therapeutic targets.
GRAPHICAL ABSTRACT
Introduction
Thyroid carcinoma (THCA) is the most common cancer involving the endocrine system and the most prevalent malignant tumor of the head and neck, accounting for about 1%–2% of systemic malignancies. The incidence rate is predominant in females and has been increasing year by year [Citation1,Citation2]. The etiology of THCA remains unclear and is currently thought to be the synergistic result of multiple carcinogenic factors, such as nutrition, dietary habits, obesity, and radiation exposure [Citation3,Citation4]. Treatments for THCA include surgery, thyroid hormone, and radiation therapy. The comprehensive and systematic therapies mean that most patients with differentiated THCAs have a relatively good prognosis, but patients with distant metastasis or undifferentiated THCAs often have a less favorable prognosis [Citation5,Citation6]. Therefore, it is urgent to identify the hub genes involved in THCA to help develop new therapeutic targets.
The development of next-generation high-throughput sequencing technologies and genomics has generated large amounts of cancer gene expression data and clinical information that have been stored in many public databases [Citation7,Citation8]. This has laid the foundation for further elucidating the molecular mechanisms of cancer and the biological functions of hub genes by bioinformatics methods and experimental validation. Weighted gene co-expression network analysis (WGCNA) is commonly used to identify co-expression gene modules that are highly correlated with clinical phenotypes [Citation9].
In this study, we aimed to identify potential prognostic biomarkers for distinguishing THCA at different clinical stages. Previous studies [Citation10–14] have used transcriptome and microarray data for gene differential expression analysis, Gene Ontology (GO) and Kyoto Encyclopedia of Genes and Genomes (KEGG) pathway functional enrichment analysis, protein–protein interaction (PPI) network analysis, and/or survival analysis. In this study, we added WGCNA, and validated the identified hub genes by clinical correlation analysis and Human Protein Atlas (HPA) image analysis.
Materials and methods
Data acquisition from the TCGA and GEO databases
THCA gene expression data and survival information were obtained from The Cancer Genome Atlas (TCGA) (https://portal.gdc.cancer.gov) and Gene Expression Omnibus (GEO) (https://www.ncbi.nlm.nih.gov/gds) databases. We downloaded TCGA RNA-Seq raw counts and corresponding clinical data from the TCGA database using the R package TCGAbiolinks [Citation15]. A total of 567 samples were collected, including 509 THCA and 58 normal thyroid tissues. We downloaded the GEO high-throughput sequencing GSE153659 dataset using the R package GEOquery [Citation16]. A total of 24 THCA and 7 adjacent normal thyroid tissues were collected.
Data preprocessing and differential expression analysis
Different intergroup comparisons were conducted using the Rstudio software (version 1.3.959, https://rstudio.com/) and Bioconductor R packages (http://www.bioconductor.org/). First, the gene expression matrices of the TCGA-THCA and GSE153659 datasets were normalized separately, and formatted in the RStudio input file format. Then, volcano plots and heatmaps of the differentially expressed genes (DEGs) were drawn using the limma [Citation17] and pheatmap [Citation18] packages in R. Genes with adjusted P-value <0.05 and |logFC (fold change)| >1 were considered to be statistically differentially expressed.
Weighted gene co-expression network analysis (WGCNA)
WGCNA can identify modules of highly correlated genes and hub genes by constructing scale-free co-expression networks [Citation19]. We used the R package WGCNA [Citation20] in RStudio to perform WGCNA for the TCGA-THCA and GSE153659 datasets separately. The filtered and trimmed raw expression data and clinical information were input, then all the genes and samples were clustered by Pearson correlation-based hierarchical clustering. To construct a scale-free gene co-expression network, we set soft threshold power values using the pickSoftThreshold function, and calculated the scale-free fit index and average connectivity of each power. Then, the adjacency matrices were converted into a topological overlap matrix, which was used for gene hierarchical clustering and dynamic shear module recognition, and similar modules were clustered and merged. Finally, the gene list of each module was obtained and gene-module tree and module-trait relationship diagrams were drawn.
Intersection of differential expression analysis and WGCNA
In the module-trait relationship diagrams of the TCGA-THCA and GSE153659 datasets, the top two modules most significantly related to THCA were found. Overlapping genes between DEGs and top two most relevant co-expression module genes (CEMGs) were considered as candidate hub genes of THCA, which were visualized as a Venn diagram using the R package VennDiagram [Citation21].
Functional and pathway enrichment analyses
To explore the biological functions and key pathways closely associated with the candidate hub genes of THCA [Citation22], we used the R packages org.hs.eg.db, clusterProfiler, enrichplot, and ggplot2 [Citation23,Citation24] to perform GO [Citation25] and KEGG [Citation26] enrichment analyses. P-value <0.05 was considered statistically significant.
Construction of PPI network and identification of hub genes
PPI networks can provide interaction information that can help to identify hub genes and key modules involved in the development of THCA. We used the STRING database (http://www.string-db.org/) to construct a PPI network of candidate genes [Citation27]. Genes with a minimum required interaction score ≥0.5 were chosen to build a full network model, which was then visualized in Cytoscape software (http://www.cytoscape.org). We used the Maximal Clique Centrality (MCC) algorithm of the cytoHubba plugin to select the top 10 genes in the network and then visualized them in Cytoscape [Citation28].
Survival analysis and clinical correlation analysis of hub genes
To confirm the reliability of the identified network hub genes and verify their prognostic value, we performed an overall survival (OS) analysis using the Kaplan Meier method [Citation29] in the R packages survival and survminer [Citation30] based on the clinical data from the TCGA-THCA dataset. We used the online survival analysis tool GEPIA2 (http://gepia2.cancer-pku.cn/) to evaluate the disease-free survival (DFS) [Citation31] of the patients with THCA. Then the R package ggpubr [Citation32] was used to analysis the clinical correlation between gene expression and tumor stage. Only the patients for which complete clinical information was available were included in our analysis. The hub genes were classified into two groups based on their expression levels and the median values. Genes with P < 0.05 were regarded as prognosis-related hub genes.
Validation of protein abundance levels of prognosis-related hub genes
The Human Protein Atlas (HPA) (http://www.proteinatlas.org/) is an antibody-based database that provides a large amount of transcriptome and proteomic data on various disease and normal tissues [Citation33]. We used the HPA to validate protein abundance levels of the prognosis-related hub genes by downloading immunohistochemical (IHC)-stained images and analyzing them.
Results
We identified hub genes and key modules that were highly related to the prognosis of THCA by integrated bioinformatics analysis, including differential expression analysis, WGCNA, GO and KEGG enrichment analyses, PPI network analysis, survival analysis, and clinical correlation analysis, and validated protein abundance by examining related HPA images. The goal was to further elucidate the pathogenesis of THCA and find novel prognostic biomarkers and potential therapeutic targets.
Identification of DEGs
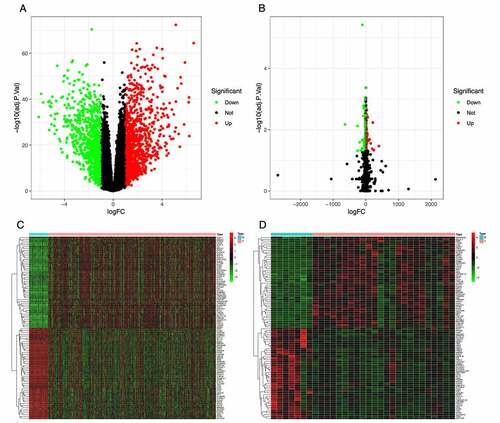
The TCGA-THCA dataset contained the gene expression matrix and clinical data for 567 samples, including 509 THCA and 58 normal thyroid tissues. The GSE153659 dataset contained the expression profiles from 24 TCGA and 7 paired normal tissues. After data preprocessing and gene differential expression analysis, we identified 1916 DEGs from the TCGA-THCA dataset; 910 were down-regulated and 1006 were up-regulated (). We also identified 665 DEGs from the GSE153659 dataset; 471 were down-regulated and 194 were up-regulated (). The top 50 DEGs from each dataset were visualized in heatmaps ().
Figure 1. Identification of differentially expressed genes (DEGs) in the TCGA and GSE153659 datasets of thyroid carcinoma (THCA). The cutoff criteria were |logFC| ≥1.0 and adjusted P < 0.05. (a, b) Volcano plots of DEGs in the TCGA-THCA (a) and GSE153659 (b) datasets. (c, d) Heatmaps of the top 50 DEGs in the TCGA-THCA (c) and GSE153659 (d) datasets. Red, up-regulated DEGs; green, down-regulated DEGs
WGCNA of the whole transcriptome expression matrix
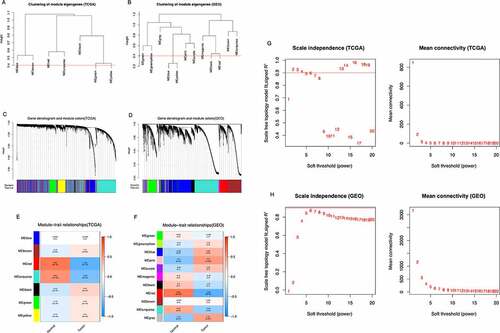
Genes with similar expression patterns tended to have similar biological functions. Therefore, we constructed a weighted gene co-expression network according to the RNA-Seq count data of 14,161 genes in the TCGA-THCA dataset and 58,437 genes in the GSE153659 dataset. We analyzed the soft threshold powers of the network topology with threshold weights from 1 to 20 and determined the scale independence and mean connectivity of the WGCNA. We selected β = 2 and 6 as the optimal soft-thresholding parameters (,). The hierarchical clustering dendrograms of module eigengenes are shown in . We identified 7 modules from the TCGA-THCA dataset () and 11 modules from the GSE153659 dataset (, and plotted module-trait diagrams to assess the relationships between gene modules and clinical characteristics. The two modules with the highest correlation with clinical phenotypes were MEred and MEturquoise in TCGA-THCA and MEred and Mepink in GSE153659 as shown in .
Figure 2. Identification of modules correlated with the clinical phenotype in the TCGA-THCA and GSE153659 datasets of thyroid carcinoma (THCA). (a, b) Hierarchical clustering dendrograms of module eigengenes in the TCGA-THCA (a) and GSE153659 (b) datasets. Modules below the red line indicate correlation >0.6 and will be merged. (c, d) Gene-module tree diagrams in the TCGA-THCA (c) and GSE153659 (d) datasets. Each branch represents one gene, and each of the colors below represent one co-expression module. (e, f) Module-trait relationship diagrams in the TCGA-THCA (e) and GSE153659 (f) datasets. Each row corresponds to a color module and each column corresponds to a clinical trait (tumor or normal). Each cell contains the corresponding correlation and P-value. (g, h) Analysis of the scale independence and mean connectivity for the optimal soft threshold powers (β) 2 in the TCGA-THCA (g) and 6 in the GSE153659 (h), respectively
Intersection of DEGs and CEMGs
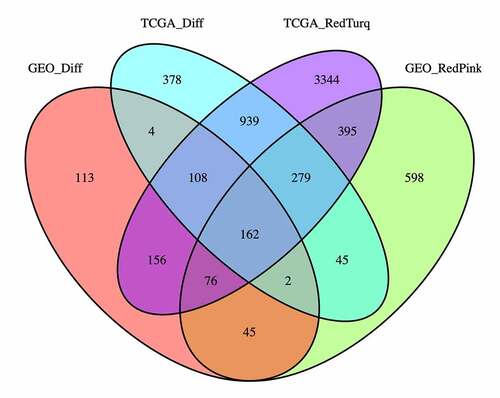
The differential expression analysis and WGCNA identified 1916 DEGs in the TCGA-THCA dataset and 665 DEGs in the GSE153659 dataset, 5459 CEMGs in the MEred and MEturquoise modules of TCGA-THCA, and 1602 CEMGs in the MEred and MEpink modules of GSE153659. A total of 162 overlapping genes were detected between the DEGs and top two most relevant CEMGs. These genes were considered as candidate hub genes of THCA and were used for the subsequent analyses ().
Figure 3. Venn diagrams of the differentially expressed genes (DEGs) and top two most relevant co-expression module genes (CEMGs) of thyroid carcinoma (THCA). The 162 overlapping genes were considered as candidate hub genes of THCA
Enrichment analyses of the 162 overlapping genes
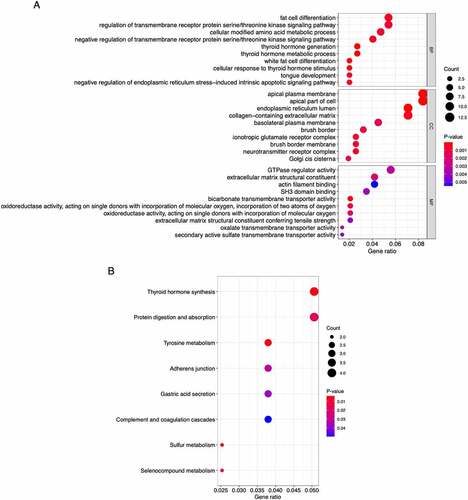
We performed GO functional and KEGG pathway enrichment analyses of the 162 overlapping genes using the R packages listed in the Methods section. The enriched GO terms ()) under the biological process category were mainly thyroid hormone metabolic process, fat cell differentiation, regulation of transmembrane receptor protein serine/threonine kinase signaling pathway, and endoplasmic reticulum stress-induced intrinsic apoptotic signaling pathway. Under the cellular component category, the enriched terms were primarily related to apical plasma membrane, endoplasmic reticulum lumen, and collagen-containing extracellular matrix. Under the molecular function category, the enriched terms were mainly related to oxidoreductase activity, extracellular matrix structural constituent, GTPase regulator activity, and actin filament binding. The KEGG pathway analysis ()) found that the tyrosine metabolism, thyroid hormone synthesis, and protein digestion and absorption pathways were significantly enriched.
Figure 4. Bubble plots of the functional and pathway enrichment analyses the 162 overlapping genes. (a, b) Gene Ontology (GO) (a) and Kyoto Encyclopedia of Genes and Genomes (KEGG) pathway (b) enrichment analyses. The diameter of the circle indicates the number of genes, the color of the circle indicates the P-values, and the bottom transverse coordinate GeneRatio represent the proportion of the total number of genes
Identifying hub genes in the PPI network
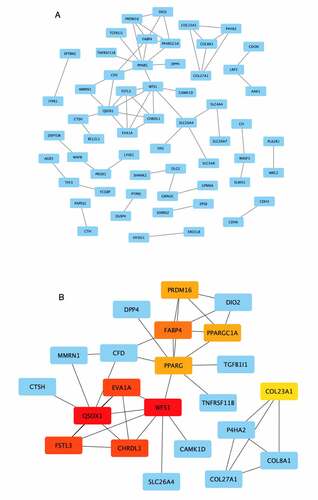
We built the PPI network of the 162 overlapping candidate hub genes using the STRING database ()). The MCC algorithm of the cytoHubba plug-in in Cytoscape was used to identify hub genes from the PPI network ()). The top 10 network hub genes encoded QSOX1 (quiescin sulfhydryl oxidase 1), WFS1 (wolframin ER transmembrane glycoprotein), EVA1A (Eva-1 homolog A, regulator of programmed cell death), FSTL3 (follistatin like 3), CHRDL1 (chordin like 1), FABP4 (fatty acid binding protein 4), PRDM16 (PR/SET domain 16), PPARGC1A (PPARG coactivator 1 alpha), PPARG (peroxisome proliferator activated receptor gamma), and COL23A1 (collagen type XXIII alpha 1 chain).
Figure 5. Visualization of the protein–protein interaction (PPI) network and top 10 hub genes. (a) PPI network of the 162 overlapping genes. Blue nodes represent the genes; edges represent interactions between nodes. (b) Identification of hub genes from the PPI network using the Maximal Clique Centrality (MCC) algorithm. The edges represent protein–protein associations. Red nodes represent genes with high MCC sores; yellow nodes represent genes with low MCC scores
Identification of prognosis-related hub genes and validation of protein abundance levels
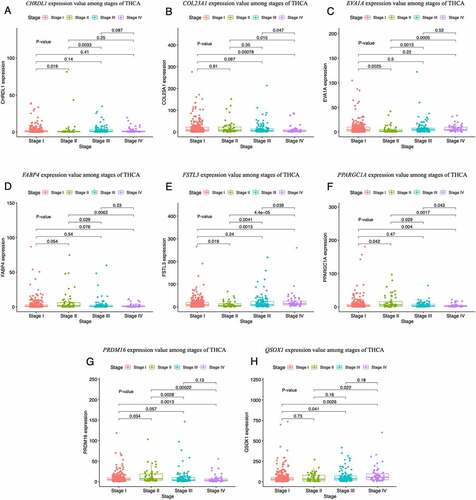
To detect the prognosis-related hub genes among the top 10 network hub genes (QSOX1, WFS1, EVA1A, FSTL3, CHRDL1, FABP4, PRDM16, PPARGC1A, PPARG, COL23A1), we performed OS and DFS analyses using the R packages survival and survminer [Citation30] and the GEPIA2 tool, respectively. We verified the expression levels of the genes in THCA tissues at different stages. The OS analysis showed that low expression of EVA1A was significantly correlation with unfavorable prognosis in patients with THCA (P < 0.05) (). The DFS analysis showed that low expression of CHRDL1 and FABP4 was markedly associated with poor prognosis (P < 0.05) (). Our evaluation of the hub genes using the HPA images indicated that the abundance levels of the EVA1A and CHRDL1 proteins were lower in tumor tissues than they were normal tissues (). Furthermore, the clinical correlation analysis indicated that CHRDL1, COL23A1, EVA1A, FABP4, FSTL3, PPARGC1A, PRDM16, and QSOX1 were strongly associated with the clinical stages of THCA ().
Figure 6. Survival analysis of the top 10 hub genes in patients with thyroid carcinoma (THCA). (a) Overall survival (OS) analysis for EVA1A in THCA using the R package survival. (b, c) Disease-free survival (DFS) analysis for CHRDL1 (b) and FABP4 (c) in THCA using the GEPIA2 tool. The patients were classified into high-level (red) and low-level (green) groups according to the median expression levels of the genes. P < 0.05 was considered to be a statistically significant difference
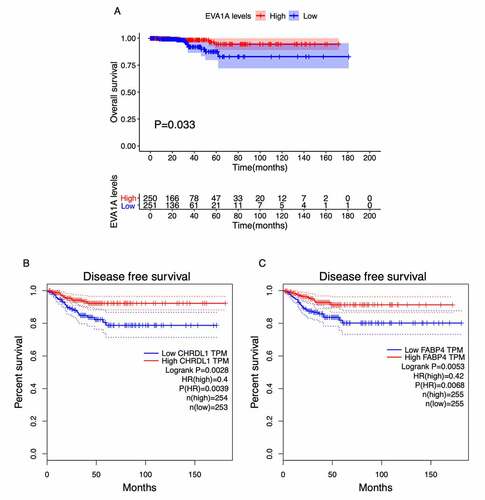
Figure 7. Immunohistochemical images of prognosis-related genes in cancer and normal tissues from the HPA database. (a, b) Abundance levels of EVA1A in (a) thyroid carcinoma (THCA) tissues (Antibody HPA008055; Staining: Not detected; Intensity: Negative; Quantity: None) and (b) normal thyroid tissues (Antibody HPA008055; Staining: Low; Intensity: Week; Quantity: 75%–25%). (c, d) Abundance levels of CHRDL1 in (c) THCA tissues (Antibody HPA000250; Staining: Not detected; Intensity: Negative; Quantity: None) and (d) normal thyroid tissues (Antibody HPA000250; Staining: Low; Intensity: Week; Quantity: 75%–25%)
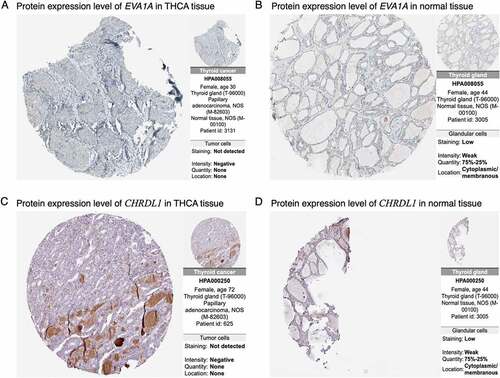
Figure 8. Boxplots of the hub gene expression levels in thyroid carcinoma (THCA) tissues at different clinical stages. (a–h) Expression levels of CHRDL1 (a), COL23A1 (b), EVA1A (c), FABP4 (d), FSTL3 (e), PPARGC1A (f), PRDM16 (g), and QSOX1 (h) at different stages of THCA. P-values represent the differences in gene expression levels between the clinical stages. P < 0.05 was considered to be a statistically significant difference
Discussion
THCA is a malignant tumor that originates from thyroid follicular epithelium or parafollicular epithelial cells, and it is also the most common head and neck cancer [Citation34]. Currently, THCA is mainly targeted using a comprehensive treatment strategy of surgery combined with thyroid hormone therapy and radiotherapy. However, because of the lack of accurate molecular targets, the prognosis is still poor, especially for patients with advanced clinical stage THCA [Citation35]. Therefore, there is an urgent need to find new prognostic biomarkers and therapeutic targets for THCA. In this study, we used integrated bioinformatics methods such as WGCNA and identified 162 overlapping candidate hub genes in the TCGA-THCA and GSE153659 datasets. The biological functions of these genes were enriched mainly in thyroid hormone generation and metabolic process, regulation of serine/threonine kinase signaling pathway, apical plasma membrane, endoplasmic reticulum lumen and extracellular matrix, GTPase regulator activity, SH3 domain binding, and actin filament binding. The enriched pathways were mainly thyroid hormone synthesis, protein digestion and absorption, tyrosine, and sulfur and seleno-compound metabolism. The top 10 hub genes (QSOX1, WFS1, EVA1A, FSTL3, CHRDL1, FABP4, PRDM16, PPARGC1A, PPARG, COL23A1) were identified by analyzing the constructed PPI network. Among them, low expression of EVA1A, CHRDL1, and FABP4 significantly affected the survival prognosis of patients with THCA, and the expression levels of CHRDL1, COL23A1, EVA1A, FABP4, FSTL3, PPARGC1A, PRDM16, and QSOX1 were highly correlated with the clinical stages of THCA. The identified hub genes were confirmed by survival and clinical correlation analysis and by examining related HPA images.
EVA1A (Eva-1 homolog A, regulator of programmed cell death) is a novel lysosomal and endoplasmic reticulum-associated protein involved in autophagy and cell division [Citation36]. Several studies have found that high levels of EVA1A inhibit the growth of tumor cells by activating autophagy and inducing apoptosis [Citation36]. Furthermore, EVA1A is a target of microRNA-125b, which plays a role in the response of liver cancer to chemotherapy by decreasing EVA1A-mediated autophagy [Citation37]. In our study, the down-regulated expression of EVA1A in THCA tissues was closely related to poor survival prognosis. CHRDL1 (chordin like 1) is a secreted glycoprotein with a repetitive cysteine-rich domain that binds to the bone morphogenetic protein (BMP) family of ligands [Citation38]. It has been reported that CHRDL1 expression was dramatically down-regulated in gastric cancer tissues and was linked to poor survival [Citation39]. Cyr-Depauw C, et al [Citation40]. found that CHRDL1 acts as a negative regulator of breast cancer phenotypes by blocking the ability of BMP ligands to induce increased migration and invasion of breast cancer cells. FABP4 (fatty acid binding protein 4) is an intracellular lipid chaperone that is involved not only in lipid transport but also in inflammation and insulin resistance [Citation41]. Differential expression of FABP4 has been reported in obesity-associated breast cancer, colorectal cancer, hepatocellular carcinoma, and FABP4 is closely correlated with tumor invasion and metastasis [Citation42–44]. Together, these results show that WGCNA and other integrated bioinformatics analyses can detect new disease-causing genes and provide rich resources for future experiments.
A recent study found that the KEGG pathways Mineral absorption, Thyroid hormone synthesis, and Protein processing in the endoplasmic reticulum pathways and the GO molecular function terms protein tyrosine kinase activity, enzyme binding, protein binding, and integrin binding were enriched in follicular thyroid carcinoma [Citation45]. Interestingly, emerging evidence has indicated possible molecular links between THCA and other diseases, such as Parkinson’s disease, osteoporosis, chronic kidney disease, chronic heart failure, and Type 1 and Type 2 diabetes [Citation46]. The Thyroid hormone synthesis, Adherens junction, and Thyroid cancer pathways were found to be common between THCA and chronic kidney disease [Citation47]. A study that used a network-based approach [Citation48] identified seven significant pathways, namely, Thyroid hormone synthesis, Rap1 signaling, Pathways in cancer, PI3K-Akt signaling, Proteoglycans in cancer, Bladder cancer, and Cytokine-cytokine receptor interaction, that were highly correlated with 79 hub genes of THCA that were common to other diseases. They included cancer (24 genes), neurological (20 genes), cardiovascular (14 genes), metabolic (13 genes), endocrine (13 genes), and hematological (12 genes) [Citation48]. The results of our functional and pathway enrichment analysis are consistent with those of many other previously reported studies.
The integrated bioinformatics analyses allowed us to identify hub genes and key modules closely associated with the initiation and progression of THCA. The results were validated by the survival analysis, clinical correlation analysis, and protein abundance data. Our results will help to elucidate the pathogenesis of THCA and provide novel candidate biomarkers and potential therapeutic targets for future studies. A limitation of this study is the lack of focus on the different subtypes of THCA. Clearly, the hub genes associated with the pathogenesis and outcome of THCA still need to be tested experimentally.
Conclusion
In this study, we identified three genes (EVA1A, CHRDL1, FABP4) that were associated with survival prognosis of patients with THCA, and eight (CHRDL1, COL23A1, EVA1A, FABP4, FSTL3, PPARGC1A, PRDM16, QSOX1) that were associated with clinical stages. These genes are candidate novel prognostic biomarkers and potential therapeutic targets.
Research highlights
We obtained top 10 hub genes (QSOX1, WFS1, EVA1A, FSTL3, CHRDL1, FABP4, PRDM16, PPARGC1A, PPARG, COL23A1) in thyroid carcinoma
3 of the 10 hub genes were associated with survival prognosis of thyroid carcinoma
8 of the 10 hub genes were associated with clinical stages of thyroid carcinoma
The hub genes may be novel prognostic biomarkers and potential therapeutic targets
Availability of data and materials
The datasets used and/or analyzed during the current study are available from the corresponding author on reasonable request.
Authors’ contributions
HRZ and YWP designed the study. YWP wrote the manuscript. JW collected raw data. YWP, LJW and SH performed statistical and bioinformatics analyses. TW and HRZ supervised the study. All authors read and approved the final version of the manuscript.
Ethics approval and consent to participate
TCGA and GEO belong to public databases. The patients involved in the database have obtained ethics approval. Users can download relevant data for free for research and publish relevant articles. Our study was based on open-source data, so there were no ethical issues and other conflicts of interest.
Disclosure of potential conflicts of interest
The authors declare that they have no competing interests.
Acknowledgements
The authors would like to thank the TCGA and GEO database for providing valuable gene expression matrix and clinical survival data of THCA. We would also like to thank Margaret Biswas, PhD, from Liwen Bianji (Edanz) (http://www.liwenbianji.cn/ac), for English language editing.
References
- Siegel R, Miller K, Fuchs H, et al. Cancer Statistics, 2021. CA Cancer J Clin. 2021;71(1):7–33.
- Davies L, Hoang J. Thyroid cancer in the USA: current trends and outstanding questions. Lancet Diabetes Endocrinol. 2021;9(1):11–12.
- Barrea L, Gallo M, Ruggeri R, et al. Nutritional status and follicular-derived thyroid cancer: an update. Crit Rev Food Sci Nutr. 2021;61(1):25–59.
- Han M, Kim J. Diagnostic X-ray exposure and thyroid cancer risk: systematic review and meta-analysis. Thyroid. 2018;28(2):220–228.
- Yang Q, Ji M, Guan H, et al. Shikonin inhibits thyroid cancer cell growth and invasiveness through targeting major signaling pathways. J Clin Endocrinol Metab. 2013;51(12):E1909–17.
- Luster M, Aktolun C, Amendoeira I, et al. European perspective on 2015 american thyroid association management guidelines for adult patients with thyroid nodules and differentiated thyroid cancer: proceedings of an interactive international symposium. Thyroid. 2019;29(1):7–26.
- Hutter C, Zenklusen J. The cancer genome atlas: creating lasting value beyond its data. Cell. 2018;173(2):283–285.
- Barrett T, Wilhite S, Ledoux P, et al. NCBI GEO: archive for functional genomics data sets--update. Nucleic Acids Res. 2013;41(D1):D991–5.
- Giulietti M, Occhipinti G, Righetti A, et al. Emerging biomarkers in bladder cancer identified by network analysis of transcriptomic data. Front Oncol. 2018;8:450.
- Hu S, Liao Y, Chen L. Identification of key pathways and genes in anaplastic thyroid carcinoma via integrated bioinformatics analysis. Med Sci Monit. 2018;24:6438–6448.
- Xue G, Lin X, Wu J, et al. Identification of key genes of papillary thyroid carcinoma by integrated bioinformatics analysis. Bioscience reports. 2020;40(8):BSR20201555.
- Li X, He J, Zhou M, et al. Identification and validation of core genes involved in the development of papillary thyroid carcinoma via bioinformatics analysis. Int J Genomics. 2019;2019:5894926.
- Zhang S, Wang Q, Han Q, et al. Identification and analysis of genes associated with papillary thyroid carcinoma by bioinformatics methods. Bioscience reports. 2019;39(4):BSR20190083.
- Liu Y, Chen T, Yang Z, et al. Identification of hub genes in papillary thyroid carcinoma: robust rank aggregation and weighted gene co-expression network analysis. J Transl Med. 2020;18(1):170.
- Mounir M, Lucchetta M, Silva T, et al. New functionalities in the TCGAbiolinks package for the study and integration of cancer data from GDC and GTEx. PLoS Comput Biol. 2019;15(3):e1006701.
- Davis S, Meltzer P. GEOquery: a bridge between the Gene Expression Omnibus (GEO) and BioConductor. Bioinformatics. 2007;23(14):1846–1847.
- Ritchie M, Phipson B, Wu D, et al. limma powers differential expression analyses for RNA-sequencing and microarray studies. Nucleic Acids Res. 2015;43(7):e47.
- Hu K. Become competent in generating RNA-seq heat maps in one day for novices without prior R experience. Methods Mol Biol. 2021;2239:269–303.
- Zhang B, Horvath S. A general framework for weighted gene co-expression network analysis. Stat Appl Genet Mol Biol. 2005;4(1). Article17.
- Langfelder P, Horvath S. WGCNA: an R package for weighted correlation network analysis. BMC Bioinformatics. 2008;9(1):559.
- Chen H, Boutros P. VennDiagram: a package for the generation of highly-customizable Venn and Euler diagrams in R. BMC Bioinformatics. 2011;12(1):35.
- Zhang Y, Zeng T, Chen L, et al. Determining protein-protein functional associations by functional rules based on gene ontology and KEGG pathway. Biochim Biophys Acta Proteins Proteom. 2021;1869(6):140621.
- Walter W, Sánchez-Cabo F, Ricote M. GOplot: an R package for visually combining expression data with functional analysis. Bioinformatics. 2015;31(17):2912–2914.
- Yu G, Wang L, Han Y, et al. clusterProfiler: an R package for comparing biological themes among gene clusters. OMICS. 2012;16(5):284–287.
- Lomax J. Get ready to GO! A biologist’s guide to the Gene Ontology. Brief Bioinform. 2005;6(3):298–304.
- Kanehisa M. KEGG: kyoto encyclopedia of genes and genomes. Nucleic Acids Res. 2000;28(1):27–30.
- Szklarczyk D, Franceschini A, Wyder S, et al. STRING v10: protein-protein interaction networks, integrated over the tree of life. Nucleic Acids Res. 2015;43(D1):D447–52.
- Chin C, Chen S, Wu H, et al. cytoHubba: identifying hub objects and sub-networks from complex interactome. BMC Syst Biol. 2014;Suppl 4:S11.
- Kim J. Drawing Guideline for JKMS Manuscript (01) Kaplan-Meier Curve and Survival Analysis. J Korean Med Sci. 2019;34(8):e35.
- Groeneveld C, Chagas V, Jones S, et al. RTNsurvival: an R/Bioconductor package for regulatory network survival analysis. Bioinformatics. 2019;35(21):4488–4489.
- Robinson A, Booth C, Eisenhauer E. Disease-free survival as an end-point in the treatment of solid tumours--perspectives from clinical trials and clinical practice. Eur J Cancer. 2014;1(13):2298–2302.
- Whitehead M, McCanney G, Willison H, et al. MyelinJ: an ImageJ macro for high throughput analysis of myelinating cultures. Bioinformatics. 2019;35(21):4528–4530.
- Thul P, Lindskog C. The human protein atlas: a spatial map of the human proteome. Protein Sci. 2018;27(1):233–244.
- Xing M. Molecular pathogenesis and mechanisms of thyroid cancer. Nat Rev Cancer. 2013;13(3):184–199.
- Vasko V, Saji M. Molecular mechanisms involved in differentiated thyroid cancer invasion and metastasis. Curr Opin Oncol. 2007;19(1):11–17.
- Shen X, Kan S, Liu Z, et al. EVA1A inhibits GBM cell proliferation by inducing autophagy and apoptosis. Exp Cell Res. 2017;352(1):130–138.
- Ren W, Li D, Chen X, et al. MicroRNA-125b reverses oxaliplatin resistance in hepatocellular carcinoma by negatively regulating EVA1A mediated autophagy. Cell Death Dis. 2018;9(5):547.
- Liu T, Li B, Zheng X, et al. Chordin-Like 1 Improves Osteogenesis of Bone Marrow Mesenchymal Stem Cells Through Enhancing BMP4-SMAD Pathway. Front Endocrinol (Lausanne). 2019;10:360.
- Pei Y, Zhang Y, Lei Y, et al. Hypermethylation of the CHRDL1 promoter induces proliferation and metastasis by activating Akt and Erk in gastric cancer. Oncotarget. 2017;8(14):23155–23166.
- Cyr-Depauw C, Northey J, Tabariès S, et al. Chordin-Like 1 Suppresses Bone Morphogenetic Protein 4-Induced Breast Cancer Cell Migration and Invasion. Mol Cell Biol. 2016;36(10):1509–1525.
- Yao F, Jiang D, Guo W, et al. FABP4 inhibitor attenuates inflammation and endoplasmic reticulum stress of islet in leptin receptor knockout rats. Eur Rev Med Pharmacol Sci. 2020;24(24):12808–12820.
- Tian W, Zhang W, Zhang Y, et al. FABP4 promotes invasion and metastasis of colon cancer by regulating fatty acid transport. Cancer Cell Int. 2020;24(1):512.
- Zeng J, Sauter E, Li B. FABP4: a new player in obesity-associated breast cancer. Trends Mol Med. 2020;26(5):437–440.
- Wang S, Yao Y, Wang X, et al. 25-HC promotes hepatocellular carcinoma metastasis through up-regulation of TLR4 dependent FABP4. Am J Cancer Res. 2019;9(10):2140–2155.
- Hossain M, Asa T, Rahman M, et al. Network-based genetic profiling reveals cellular pathway differences between follicular thyroid carcinoma and follicular thyroid adenoma. Int J Environ Res Public Health. 2020;17(4):1373.
- Hossain M, Islam S, Asa TA, et al. Identification of Genetic Links of Thyroid Cancer to the Neurodegenerative and Chronic Diseases Progression: Insights from Systems Biology Approach. Proceedings of International Joint Conference on Computational Intelligence. 2020:263–274.
- Hossain MA, Asa TA, Rahman MR, et al. Network-based approach to identify key candidate genes and pathways shared by thyroid cancer and chronic kidney disease. Inf Med Unlocked. 2019;16:100240.
- Hossain M, Asa TA, Huq F, et al. A network-based approach to identify molecular signatures and comorbidities of thyroid cancer. Proceedings of International Joint Conference on Computational Intelligence. 2020:235–246.