
ABSTRACT
Ovarian cancer (OC) is one of the most common malignancies with high incidence and mortality and the eighth most common cancer-associated mortality in women worldwide. Aberrant expression of the GINS complex subunit 2 (GINS2) gene and miR-502-5p has been associated with cancer progression. This study aims to investigate the specific molecular mechanism of the miR-502-5p-GINS2 axis in OC. GINS2 and miR-502-5p expression in OC tissues and cell lines was measured using RT-qPCR. Next, we investigated the interaction between miR-502-5p and GINS2 using a luciferase assay. The role of the miR-502-5p-GINS2 axis was detected by assessing cell proliferation, migration, and apoptosis levels, such as caspase-3 activity and caspase-3 protein expression, in the OC cell lines CaOV3 and SKOV3, respectively. MiR-502-5p expression was decreased, and GINS2 expression was dramatically elevated in OC tissues and cells. Upregulation of miR-502-5p expression repressed cellular proliferation and migration levels but increased the cellular apoptosis level. GINS2 overexpression enhanced the proliferation and migration levels but hampered OC cell apoptosis. Moreover, miR-502-5p inhibited GINS2 expression and suppressed OC tumorigenesis. miR-502-5p targeting GINS2 suppressed OC progression by inhibiting cell growth and promoting cell apoptosis. Hence, we provide a comprehensive understanding of OC involving both miR-502-5p and GINS2, which might be effective therapeutic targets for OC patients.
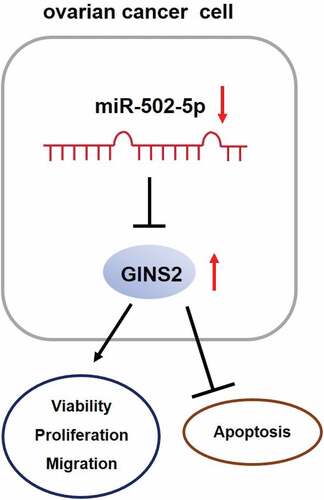
Graphical Abstract
Introduction
Ovarian cancer (OC) is one of the most common malignancies worldwide, with 1.6% incidence and 1.9% mortality, and ranks as the eighth most common cancer-associated mortality in women [Citation1]. Owing to the nonspecific symptoms of OC, the diagnosis and therapeutic strategies remain unsatisfactory [Citation2]. Studies have shown that inherited mutations in genes are linked to the development of OC [Citation3]. Therefore, it is essential to comprehensively investigate the genetic changes and pathogenesis of OC.
MicroRNAs (miRNAs) are small RNAs of 20–24 nucleotides that silence mRNAs either through mRNA degradation or by preventing mRNA translation [Citation4,Citation5]. Evidence has shown that certain miRNAs contribute to cancer cellular biological processes, thus serving as tumor suppressors or oncogenes [Citation6,Citation7]. Moreover, miRNAs have long been shown to regulate the occurrence and development of OC. For instance, miR-552 was upregulated in OC, resulting in the promotion of growth and metastasis of OC cells [Citation8]. MiR-34a-5p reduced the proliferation and tumorigenicity of cisplatin-resistant OC cells in nude mice, blocked the G1 cell cycle, and induced apoptosis [Citation9]. In addition, miR-502-5p has been reported to be associated with different types of cancers, such as gastric, breast, and bladder cancers [Citation10–12]. Upregulation of miR-502-5p expression could prevent cell growth and metastasis by targeting different genes and activating various signaling pathways in these cancers. However, only two studies have suggested that miR-502 expression is decreased in OC patients [Citation13]. miR-502 overexpression can repress interferon alpha-inducible protein 27 (IFI27)-induced tumorigenicity, migration, and drug resistance [Citation13]. Furthermore, the polymorphism of the miR-502 binding site is associated with the carcinogenic mechanism of epithelial OC [Citation14]. Nonetheless, the molecular mechanisms underlying the role of miR-502-5p in OC development remain unknown.
GINS complex subunit 2 (GINS2) serves as an oncogene in cancer genesis by enhancing cell growth and repressing cell apoptosis in various cancers, including thyroid, lung, and pancreatic cancers [Citation15–17]. It has also been associated with the progression of OC by regulating cell growth and apoptosis [Citation18,Citation19]. However, the biological function of the interaction between miR-502-5p and GINS2 in OC requires further study.
To elucidate the mechanism of the occurrence and development of OC, we used GSE119055 data and previous literature to screen out the miRNAs of interest in OC, namely miR-502-5p. GEPIA OC data and TargetScan algorithm screened GINS2 as a target gene candidate for miR-502-5p. Therefore, we sought to elucidate the effects of miR-502-5p and GINS2 on OC. miR-502-5p expression decreased and GINS2 expression increased in OC. Further functional experiments confirmed that the tumor suppressive effect of miR-502-5p on OC was realized through targeted GINS2 inhibition. Our study is the first to reveal the effect and mechanism of miR-502-5p/GINS2 on OC, which may provide a new direction for the treatment of OC involving both genes.
Materials and methods
Tissue samples, cell lines, and cell transfection
Human OC tissue specimens (n = 30) and normal tissues (n = 30) were collected from OC patients in our hospital after obtaining written informed consent and approval from our hospital ethics committee. The patients’ baseline data are presented in . Human OC cell lines (SKOV3, CaOV3, and OVCAR3) and normal ovarian epithelial cells (HOSEpiC) were obtained from ATCC (VA, USA) and maintained in RPMI-1640 medium (Gibco, MA, USA) with 10% fetal bovine serum (FBS; Gibco) at 37°C with 5% CO2. For transfection, miR-502-5p mimic (100 nM) and the inhibitor (75 nM), GINS2-overexpression plasmid (GINS2-OE; 2 μg/mL), and the corresponding negative controls (NC) were obtained from GenePharm (Shanghai, China), transfected into CaOV3 and SKOV3 cells using Lipofectamine 3000 (Invitrogen, CA, USA), and cultured for 48 h at 37°C for other experiments.
Table 1. The baseline characteristics of 30 ovarian cancer patients
RNA isolation and RT-qPCR analysis
Total RNA from OC tissues and cells was extracted using TRIzol reagent (Invitrogen, CA, USA) and transcribed to cDNA using the PrimeScript First Strand cDNA Synthesis Kit (Cat#: #6110A, Takara, Kyoto. Japan). RT-qPCR was performed using SYBR Premix Ex Taq (Cat#: #RR420A Takara). Total miRNA from the OC tissues and cell lines was isolated using the miRNeasy Mini Kit (Cat#: #217,004, QIAGEN, Hilden, Germany) and transcribed to cDNA using miScript II RT Kit (Cat#: #218,161, QIAGEN). RT-qPCR was performed using the miScript SYBR Green PCR Kit (Cat#: #218,075, QIAGEN). The 2-ΔΔCt method was applied to obtain the results of GINS2 expression normalized to GAPDH and miR-502-5p levels normalized to U6. All primer sequences are listed in .
Table 2. Primer sequences
CCK-8 assay
This assay was performed as previously described [Citation20]. CaOV3 and SKOV3 cells (5 × 10³ cells) were seeded into 96-well plates and cultured for 0, 24, 48, and 72 h, and cell viability was measured at the four time points using the CCK-8 kit (Cat#: K1018; APExBIO, TX, USA). Briefly, 10 µL CCK-8 solution was added to the plate and incubated for 2 h at 37°C. Finally, OD450 was measured on a multimode-plate reader (Thermo Fisher, MA, USA).
BrdU assay
The BrdU assay was performed according to the BrdU Cell Proliferation Assay Kit (Cat#: 6813, CST, MA, USA), as previously described [Citation21]. CaOV3 and SKOV3 cells (5 × 10³ cells) were seeded into 96-well plates and cultured overnight. After washing twice, the cells were denatured and labeled with 10 µL of 10X BrdU solution antibody for 2 h. Then, the medium was removed, and the HRP-conjugated secondary antibody solution was added into each well and incubated for 1 h. Finally, OD450 was performed on a multimode-plate reader (Thermo Fisher).
Apoptosis assay
The CaOV3 and SKOV3 cell apoptosis assays were performed using a caspase-3 activity kit (Cat#: 5723, CST), as previously described [Citation22]. The cells were collected, washed twice with PBS, and treated with cell lysis buffer for 10 min. Subsequently, the cell lysate was treated with a loading solution (100 µL/well) at 37°C for 2 h. Finally, OD405 was performed on a multimode-plate reader (Thermo Fisher).
Transwell assay
A 24-well plate chamber (Cat#: #3244, Corning, NY, USA) was used for cell migration measurements according to a previous study [Citation23]. The lower chamber was supplemented with 10% FBS medium, and CaOV3 and SKOV3 cell suspensions (2 × 10⁵ cells) without FBS were added to the upper chamber. After 24 h of culture, the cells that passed through the filter were fixed with 4% paraformaldehyde and stained with 0.1% crystal violet (C0775, Sigma-Aldrich, MO, USA). We then randomly captured five different fields from each well using a light microscope. Three randomly selected fields were observed under a microscope.
Luciferase assay
The pmiRGLO GINS2 3′-UTRs WT vector and pmiRGLO GINS2 3′-UTR MUT vector were provided by GenePharma (Shanghai, China). CaOV3 and SKOV3 cells were treated with pmiRGLO GINS2 3′-UTR WT or MUT vectors and either miR-NC or miR-502-5p using Lipofectamine 3000 for 72 h. Then, the firefly and Renilla luciferase activities were measured using the Luciferase Assay Kit (Cat#: #16,185, Thermo Fisher). Relative luciferase activities were normalized to firefly luciferase, according to a previous study [Citation24].
RNA-pull down analysis
This assay was performed as previously described [Citation20]. Biotin-labeled miR-502-5p (Bio-miR-502-5p) and miR-NC (Bio-NC) were obtained from Thermo Fisher. The CaOV3 and SKOV3 cell lysate suspensions were incubated with streptavidin beads (Cat#: #88,817, Thermo Fisher) conjugated with Bio-miR-502-5p or Bio-NC at 4°C overnight. Subsequently, the eluted solution was purified using the RNeasy Mini Kit (Cat# 74,104, QIAGEN). Finally, GINS2 enrichment was performed using RT-qPCR.
Western blotting analysis
Western blotting was performed as previously described [Citation25]. Equal quantities of protein from CaOV3 and SKOV3 cells were isolated using RIPA buffer (Cat#: #20-188, Sigma-Aldrich), and the total protein concentration was determined using a BCA protein assay kit (Beyotime, Shanghai, China). The samples were loaded (20 μg/lane) on 10% SDS polyacrylamide gels and transferred to PVDF membranes. After blocking and washing the membrane, anti-GINS2 (1:1000, Cat#: ab197123, Abcam, Cambridge, UK), anti-cleaved caspase-3 (1:500, Cat#: ab2302, Abcam), anti-total caspase-3 (1:10,000, Cat#: ab32499, Abcam), and anti-GAPDH (1:2000, Cat#: ab9485, Abcam) were used to incubate the membranes overnight at 4°C. Then, the second antibody Anti-HRP-Rabbit was used for 1 h incubation at 25°C. ECL reagents (Bio-Rad, CA, USA) were used to develop the protein bands. Relative GINS2 protein expression was normalized to that of GAPDH.
Statistical analysis
All data were analyzed using paired Student’s t-tests and one-way analysis of variance with Dunnett’s post hoc test for two groups and multiple groups analysis, respectively, using GraphPad 8.0 software (GraphPad, CA, USA). The results are shown as the mean ± SD from three independent experiments. In addition, Pearson correlation analysis was used to study the relationship between GINS2 and miR-502-5p in OC tissues. Statistical significance was set at P < 0.05.
Results
miR-502-5p might be a significant participant in OC by suppressing GINS2
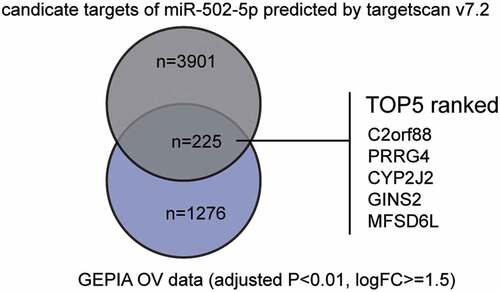
To identify the influencing factors in OC, we first screened out the interesting miRNA (miR-502-5p) and mRNA (GINS2) using bioinformatics analysis. By analyzing GSE119055 data using the GEO2R algorithm (https://www.ncbi.nlm.nih.gov/geo/geo2r/), we identified significantly downregulated miRNAs in OC. By listing them in ascending order, we found that miR-502-5p, the top third most downregulated miRNA, has not been studied in OC but has been studied in other cancers, such as gastric [Citation10,Citation26,Citation27], breast [Citation11], colon [Citation28], and bladder [Citation12] cancers as tumor suppressors. Differentially expressed genes from GEPIA OC data were obtained and intersected with the candidate genes that could be targeted by miR-502-5p, which were predicted by the TargetScan algorithm. In total, 225 genes were identified and ranked according to their context++ score (). Among the five with the lowest context++ scores, GINS2 was once reported to be a cancer driver in OC [Citation19] and was associated with worse prognosis in OC patients [Citation18]. More thorough studies on GINS2 are required.
Figure 1. miR-502-5p might be a significant participant in OC by suppressing GINS2
MiR-502-5p suppressed cell progression in OC
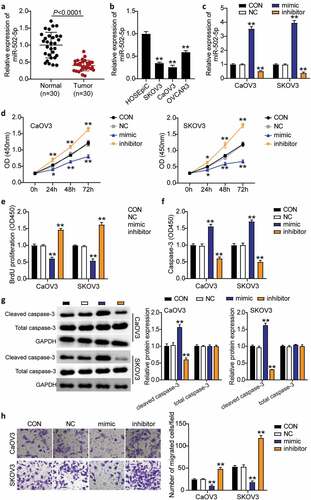
To evaluate the role of miR-502-5p in OC, we detected miR-502-5p expression in OC tissues and cell lines, explored the effects of miR-502-5p on the proliferation, migration, and apoptosis of OC cells in vitro using biological function experiments, and clarified the antitumor effect of miR-502-5p in OC. miR-502-5p expression was downregulated by more than 50% in tumor tissues compared to normal tissues (). OC cell lines (SKOV3, CaOV3, and OVCAR3) showed dramatically decreased miR-502-5p expression compared to normal ovarian epithelial cells (HOSEpiC). We chose the CaOV3 and SKOV3 cell lines for subsequent experiments because they showed the lowest miR-502-5p expression (). Next, we transfected the miR-502-5p inhibitor, mimic, and NC into CaOV3 and SKOV3 cell lines. The results showed that the mimic groups upregulated miR-502-5p expression by approximately 4-fold, while the inhibitor groups showed 50% miR-502-5p expression compared to control cells in both cell types (). The mimic groups showed significantly increased cell viability, but the inhibitor groups showed decreased cell viability compared to control cells in both cell lines (). In addition, the mimic groups reduced cell proliferation by 40%, while the inhibitor groups enhanced cell proliferation by approximately 1.5-fold compared to control cells in both CaOV3 and SKOV3 cells (). Furthermore, the mimic groups enhanced cell apoptosis by approximately 1.5-fold, while the inhibitor groups suppressed cell apoptosis by approximately 50% compared with control cells in both CaOV3 and SKOV3 cells (). Similarly, cleaved caspase-3 protein levels increased in the mimic groups and decreased in the inhibitor groups compared to the control groups (). Moreover, the mimic groups inhibited cell migration levels by 60%, while the inhibitor groups enhanced cell migration by approximately 2-fold compared to control cells in both cell types (). Collectively, these results indicated that miR-502-5p inhibited cell growth and elevated cell apoptosis in OC.
Figure 2. MiR-502-5p inhibited cell proliferation and migration, and promoted cell apoptosis in OC
miR-502-5p targeted GINS2 and inhibited the expression of GINS2
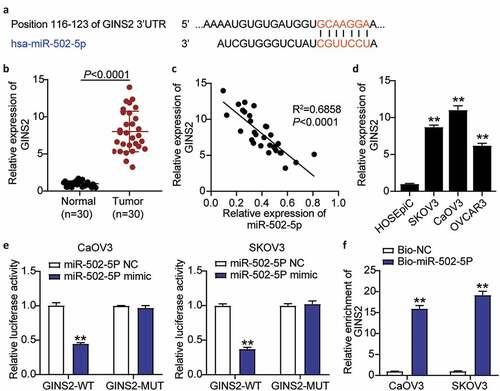
To understand the mechanism of action of miR-502-5p in OC, luciferase and RNA-pull down assays were performed to analyze whether miR-502-5p targeted GINS2 and inhibited GINS2 expression. TargetScan Human 7.2 analysis revealed the binding sequence of GINS2 and miR-502-5p (). GINS2 expression in OC tumor tissues was upregulated by approximately 8-fold compared to that in normal tissues (). Meanwhile, a negative correlation between miR-502-5p expression and GINS2 expression was observed in OC tumor tissues (). In addition, GINS2 expression was dramatically increased in OC cell lines (SKOV3, CaOV3, and OVCAR3) compared to normal ovarian epithelial cells (HOSEpiC) (). Next, we transfected pmiRGLO GINS2 3′-untranslated regions (3′-UTRs) WT vectors or pmiRGLO GINS2 3′-UTR MUT vectors and miR-502-5p-NC or miR-502-5p-mimic into CaOV3 and SKOV3 cell lines. The luciferase activities of both cell lines with wild-type GINS2 3′UTR and miR-502-5p-mimic dramatically decreased by 50%, but no difference was observed in the mutant GINS2 3′UTR groups (). The RNA-pull down assay showed a strong binding effect between GINS2 and miR-502-5p in both CaOV3 and SKOV3 cells (). Taken together, these results revealed that miR-502-5p significantly suppressed GINS2 expression.
Figure 3. MiR-502-5p targeting GINS2 and inhibited the expression of GINS2
miR-502-5p targeting GINS2 hampered the progression of OC
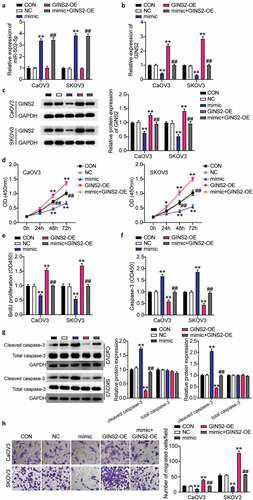
To further investigate the effect of miR-502-5p/GINS2 on the biological function of OC cells, CCK-8, BrdU, caspase-3 activity, and transwell assays were used to detect the changes in proliferation, apoptosis, and migration. It was shown that miR-502-5p targeting GINS2 inhibited the malignant proliferation of OC cells. First, we transfected the GINS2 overexpression plasmid and mimicked CaOV3 and SKOV3 cells. miR-502-5p expression was enhanced by approximately 4-fold in the mimic groups and mimic+ OE groups, while the expression level in the OE-GINS2 groups was the same as that in control cells in both cell lines (). Meanwhile, GINS2 expression in the mimic groups decreased by 80% and that in the OE- GINS2 groups increased approximately 2-fold compared to control cells. The mimic+ OE groups showed the same expression level as the control cells in both CaOV3 and SKOV3 cells (). Western blot analysis revealed approximately 1.3-fold increase in GINS2 protein expression in the OE-GINS2 groups and approximately 60% decrease in GINS2 protein expression in the mimic groups compared to control cells in both CaOV3 and SKOV3 cells. However, the expression in the OE-GINS2 and miR-502-5p-mimic co-transfection group is comparable to that in the control groups (). Next, we found that the OE-GINS2 groups showed significantly higher cell viability than the control cells, while the effect of OE-GINS2 on cell viability diminished in the mimic+ OE groups (). The OE-GINS2 groups showed approximately 1.5-fold increase in cell proliferation compared to control cells, while the effect diminished in the mimic+ OE groups (). Furthermore, the OE-GINS2 groups show a 50% reduction in cell apoptosis compared to control cells, while the effect diminished in the mimic+ OE groups (). Moreover, GINS2 overexpression reduced cleaved caspase-3 protein expression and reversed the effect of increased cleaved caspase-3 expression in miR-502-5p-mimic groups (). Finally, the OE-GINS2 groups show an approximately 2-fold increase in cell migration compared to control cells, while the effect diminished in the mimic+ OE groups (). Hence, the results clarified that miR-502-5p targeting GINS2 hampered the progression of OC.
Figure 4. MiR-502-5p targeting GINS2 repressed the progression of OC
Discussion
In this study, we showed that miR-502-5p expression was clearly reduced, while GINS2 expression was dramatically elevated in OC tissues and cells. In addition, miR-502-5p inhibiting GINS2 functionally suppressed cell growth and enhanced cell apoptosis in OC.
Accumulating evidence suggests that miR-502-5p attenuates cell growth and promotes cell apoptosis in numerous cancers, particularly gastric cancer [Citation10,Citation26,Citation29,Citation30]. One study demonstrated that miR-502-5p repressed gastric cancer development by suppressing PD-L1 expression [Citation10]. In addition, miR-502-5p inhibits cell growth by inhibiting SP1 in gastric cancer cells [Citation26]. miR-502-5p inhibited the expression of CCND1, NOP14, and DNMT3B, the targets of miR-502-5p, by reducing cell migration in bladder cancer [Citation31]. Moreover, miR-502-5p reduces cell growth by downregulating the expression of TRAF2 in breast cancer cells [Citation11]. Notably, one study indicated that miR-502 inhibited EMT and ovarian tumorigenicity and stemness by inhibiting the expression of interferon alpha-inducible protein 27 [Citation13]. In this study, we demonstrated that miR-502-5p expression was significantly reduced in OC tissues and cells. Upregulation of miR-502-5p repressed cell growth, while boosting apoptosis in the OC cells, CaOV3 and SKOV3. Furthermore, miR-502-5p directly inhibited GINS2 expression, which reduced the tumorigenic effect of GINS2 on OC cells.
In recent decades, GINS2 has been involved in the development of various cancers, such as pancreatic, lung, and thyroid cancers [Citation15,Citation17,Citation32]. Zhang et al. demonstrated that GINS2 elevated cell growth and cell cycle progression by activating the MAPK/ERK pathway in pancreatic cancer cells [Citation17]. In addition, downregulation of GINS2 repressed cell growth and enhanced cell apoptosis by inhibiting the p53/GADD45A pathway in non-small cell lung cancer [Citation32]. GINS2 promotes cell proliferation and inhibits cell apoptosis by regulating CITED2 and LOXL2 in thyroid cancer [Citation15]. As mentioned above, GINS2 promotes cell proliferation but suppresses apoptosis of OC cells [Citation19,Citation33]. Yan et al. found that GINS2 is upregulated in OC cells. Furthermore, knockdown of GINS2 dramatically repressed SKOV-3 cell growth and boosted cell cycle arrest and cell apoptosis [Citation19]. In this study, we demonstrated that GINS2 expression was increased in ovarian tissues and cells. GINS2 overexpression significantly facilitated cell growth but suppressed apoptosis in CaOV3 and SKOV3 cells, and this effect was diminished by miR-502-5p.
Previous studies have shown that miRNAs hybridized with complementary sequences in mRNA and silenced genes by destabilizing mRNA or preventing translation of mRNA [Citation34]. Accumulated evidence has also revealed that some miRNAs regulate OC progression by targeting mRNA. For instance, Bi et al. [Citation35] found that miR-125b negatively regulated S100A4 to promote cell apoptosis and reduce cell survival, migration, tumor growth, and lung metastasis. Cai et al. [Citation36] studied the inhibition of proliferation, migration, and invasion of OC cells by miR-330-3p targeting RIPK4. In this study, GINS2 was found to be a potential target of miR-502-5p, and the upregulation of miR-502-5p inhibited the proliferation and migration of ovarian cancer cells through GINS2. This is similar to previous studies on the regulatory mechanism of miRNA-mRNA in OC [Citation35,Citation36]. Therefore, this study proposed a novel mechanism by which miR-502-5p/GINS2 affects OC.
However, there are certain limitations to this study. First, the specific signaling pathways and mouse model confirmation of the miR-502-5p-GINS2 axis in OC need further exploration. Second, although the differential expression of miR-502-5p has been proven using bioinformatics analysis and qRT-PCR in patient tissues, the direct association between OC and miR-502-5p could not be confirmed. In the future, it will be necessary to analyze the correlation between miR-502-5p and OC in terms of clinicopathological changes and patient prognosis.
Conclusion
Overall, this study revealed that miR-502-5p significantly decreased and GINS2 significantly increased in OC, and miR-502-5p hampered OC progression by repressing GINS2 expression, including suppression of viability, proliferation, migration, and elevated apoptosis of cells. Therefore, our study provides a comprehensive understanding of the miR-502-5p-GINS2 axis in OC, which may offer a new direction for the treatment of OC involving both miR-502-5p and GINS2.
Highlights
miR-502-5p was downregulated and GINS2 was upregulated in OC tissues and cells.
miR-502-5p upregulation inhibited the proliferation and migration of OC cells and induced apoptosis.
GINS2 overexpression increased the proliferation and migration of OC cells and inhibited apoptosis.
GINS2 was confirmed to be the target of miR-502-5p.
Ethics approval and informed consent
The present study was approved by the Ethics Committee of Renmin Hospital of Wuhan University (Approval No. WDRY2019-K106). The processing of clinical tissue samples is in strict compliance with the ethical standards of the Declaration of Helsinki. All patients signed written informed consent.
Consent for publication
Consent for publication was obtained from the participants.
Availability of data and material
The datasets used and/or analyzed during the current study are available from the corresponding author on reasonable request.
Disclosure statement
No potential conflict of interest was reported by the author(s).
Additional information
Funding
References
- Bray F, Ferlay J, Soerjomataram I, et al. Global cancer statistics 2018: GLOBOCAN estimates of incidence and mortality worldwide for 36 cancers in 185 countries. CA Cancer J Clin. 2018;68(6):394–424.
- Brown PO, Palmer C. The preclinical natural history of serous ovarian cancer: defining the target for early detection. PLoS Med. 2009;6(7):e1000114.
- Paul A, Paul S. The breast cancer susceptibility genes (BRCA) in breast and ovarian cancers. Front Biosci (Landmark Ed). 2014;19:605–618.
- Bartel DP. MicroRNAs: target recognition and regulatory functions. Cell. 2009;136(2):215–233.
- Pasquinelli AE. MicroRNAs and their targets: recognition, regulation and an emerging reciprocal relationship. Nat Rev Genet. 2012;13(4):271–282.
- Li XT, Wang HZ, Wu ZW, et al. miR-494-3p regulates cellular proliferation, invasion, migration, and apoptosis by PTEN/AKT signaling in human glioblastoma cells. Cell Mol Neurobiol. 2015;35(5):679–687.
- Chae DK, Park J, Cho M, et al. MiR-195 and miR-497 suppress tumorigenesis in lung cancer by inhibiting SMURF2-induced TGF-β receptor I ubiquitination. Mol Oncol. 2019;13(12):2663–2678.
- Zhao W, Han T, Li B, et al. miR-552 promotes ovarian cancer progression by regulating PTEN pathway. J Ovarian Res. 2019;12(1):121.
- Zuo Y, Zheng W, Liu J, et al. MiR-34a-5p/PD-L1 axis regulates cisplatin chemoresistance of ovarian cancer cells. Neoplasma. 2020;67(1):93–101.
- You W, Liu X, Yu Y, et al. miR-502-5p affects gastric cancer progression by targeting PD-L1. Cancer Cell Int. 2020;20:395.
- Sun LL, Wang J, Zhao ZJ, et al. Suppressive role of miR-502-5p in breast cancer via downregulation of TRAF2. Oncol Rep. 2014;31(5):2085–2092.
- Ying Y, Li J, Xie H, et al. CCND1, NOP14 and DNMT3B are involved in miR-502-5p-mediated inhibition of cell migration and proliferation in bladder cancer. Cell Prolif. 2020;53(2):e12751.
- Li S, Xie Y, Zhang W, et al. Interferon alpha-inducible protein 27 promotes epithelial-mesenchymal transition and induces ovarian tumorigenicity and stemness. J Surg Res. 2015;193(1):255–264.
- Wang C, Guo Z, Wu C, et al. A polymorphism at the miR-502 binding site in the 3ʹ untranslated region of the SET8 gene is associated with the risk of epithelial ovarian cancer. Cancer Genet. 2012;205(7–8):373–376.
- Ye Y, Song YN, He SF, et al. GINS2 promotes cell proliferation and inhibits cell apoptosis in thyroid cancer by regulating CITED2 and LOXL2. Cancer Gene Ther. 2019;26(3–4):103–113.
- Liu X, Sun L, Zhang S, et al. GINS2 facilitates epithelial-to-mesenchymal transition in non-small-cell lung cancer through modulating PI3K/Akt and MEK/ERK signaling. J Cell Physiol. 2020;235(11):7747–7756.
- Zhang M, He S, Ma X, et al. GINS2 affects cell viability, cell apoptosis, and cell cycle progression of pancreatic cancer cells via MAPK/ERK pathway. J Cancer. 2020;11(16):4662–4670.
- Li Y, Li L. Prognostic values and prospective pathway signaling of MicroRNA-182 in ovarian cancer: a study based on gene expression omnibus (GEO) and bioinformatics analysis. J Ovarian Res. 2019;12(1):106.
- Yan T, Liang W, Jiang E, et al. GINS2 regulates cell proliferation and apoptosis in human epithelial ovarian cancer. Oncol Lett. 2018;16(2):2591–2598.
- Lu J, Lin J, Zhou Y, et al. MiR-328-3p inhibits lung adenocarcinoma-genesis by downregulation PYCR1. Biochem Biophys Res Commun. 2021;550:99–106.
- Zhuang Z, Xiao Q, Hu H, et al. Down-regulation of microRNA-155 attenuates retinal neovascularization via the PI3K/Akt pathway. Mol Vis. 2015;21:1173–1184.
- Renema P, Kozhukhar N, Pastukh V, et al. Exoenzyme Y induces extracellular active caspase-7 accumulation independent from apoptosis: modulation of transmissible cytotoxicity. Am J Physiol Lung Cell Mol Physiol. 2020;319(2):L380–l90.
- Guo L, Fu J, Sun S, et al. MicroRNA-143-3p inhibits colorectal cancer metastases by targeting ITGA6 and ASAP3. Cancer Sci. 2019;110(2):805–816.
- Song AF, Kang L, Wang YF, et al. MiR-34a-5p inhibits fibroblast‑like synoviocytes proliferation via XBP1. Eur Rev Med Pharmacol Sci. 2020;24(22):11675–11682.
- Song W, Zhang T, Yang N, et al. Inhibition of micro RNA miR-122-5p prevents lipopolysaccharide-induced myocardial injury by inhibiting oxidative stress, inflammation and apoptosis via targeting GIT1. Bioengineered. 2021;12(1):1902–1915.
- Peng X, Wu M, Liu W, et al. miR-502-5p inhibits the proliferation, migration and invasion of gastric cancer cells by targeting SP1. Oncol Lett. 2020;20(3):2757–2762.
- Wang B, Yang H, Shen L, et al. Rs56288038 (C/G) in 3ʹUTR of IRF-1 regulated by MiR-502-5p promotes gastric cancer development. Cell Physiol Biochem. 2016;40(1–2):391–399.
- Zhai H, Song B, Xu X, et al. Inhibition of autophagy and tumor growth in colon cancer by miR-502. Oncogene. 2013;32(12):1570–1579.
- Yin HF, Wang Q, Huang XT, et al. Circ_0032627 accelerates proliferation of gastric cancer cells through regulating miR-502-5p expression. Eur Rev Med Pharmacol Sci. 2020;24(12):6674–6681.
- Zhang J, Hou L, Liang R, et al. CircDLST promotes the tumorigenesis and metastasis of gastric cancer by sponging miR-502-5p and activating the NRAS/MEK1/ERK1/2 signaling. Mol Cancer. 2019;18(1):80.
- Yan T, Ye XX. MicroRNA-328-3p inhibits the tumorigenesis of bladder cancer through targeting ITGA5 and inactivating PI3K/AKT pathway. Eur Rev Med Pharmacol Sci. 2019;23(12):5139–5148.
- Chi F, Wang Z, Li Y, et al. Knockdown of GINS2 inhibits proliferation and promotes apoptosis through the p53/GADD45A pathway in non-small-cell lung cancer. Biosci Rep. 2020;40:4.
- Xie Q, Chen C, Li H, et al. miR-3687 overexpression promotes bladder cancer cell growth by inhibiting the negative effect of FOXP1 on cyclin E2 transcription. Mol Ther. 2019;27(5):1028–1038.
- Cui J, Zhou B, Ross SA, et al. Nutrition, microRNAs, and Human Health. Advances in Nutrition (Bethesda, Md). 2017;8(1):105–112.
- Bi YN, Guan JP, Wang L, et al. Clinical significance of microRNA-125b and its contribution to ovarian carcinogenesis. Bioengineered. 2020;11(1):939–948.
- Cai L, Ye L, Hu X, et al. MicroRNA miR-330-3p suppresses the progression of ovarian cancer by targeting RIPK4. Bioengineered. 2021;12(1):440–449.