
 ?Mathematical formulae have been encoded as MathML and are displayed in this HTML version using MathJax in order to improve their display. Uncheck the box to turn MathJax off. This feature requires Javascript. Click on a formula to zoom.
ABSTRACT
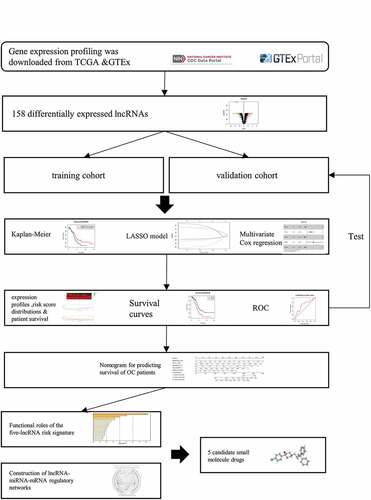
The dysregulation of long non-coding RNAs (lncRNAs) plays a crucial role in ovarian cancer (OC). In this study, we screened out five differentially expressed lncRNAs (AC092718.4, AC138035.1, BMPR1B-DT, RNF157-AS1, and TPT1-AS1) between OC and normal ovarian based on TCGA and GTEx RNA-seq databases by using Kaplan–Meier analysis and univariate Cox, LASSO, and multivariate Cox regression. Then, a risk signature was constructed, with 1, 3, 5-year survival prediction accuracy confirmed by ROC curves, and an online survival calculator for easier clinical use. With lncRNA-microRNA-mRNA regulatory networks established, Gene Ontology (GO) and Kyoto Encyclopedia of Genes and Genomes (KEGG) analyses were performed, suggesting the involvement of a variety of cancer-related functions and pathways. Finally, five candidate small-molecule drugs (thioridazine, trifluoperazine, loperamide, LY294002, and puromycin) were predicted by Connectivity Map. In conclusion, we identified a 5-lncRNA signature of prognostic value with its ceRNA networks, and five candidate drugs against OC.
1. Introduction
Ovarian cancer (OC) represents the seventh most common cancer among women in the world and is the most lethal gynecological malignancy with a 5-year survival of 46% [Citation1]. Current first-line treatment for OC patients involves primary debulking surgery (PDS) for all International Federation of Gynecology and Obstetrics (FIGO) stages, followed by combination chemotherapy, usually carboplatin and paclitaxel in advanced-stage OC [Citation1,Citation2]. Unfortunately, the efficacy of these treatments is limited, and the prognosis of OC patients is still poor, with a 5-year survival of only 20–40% for stage III or IV cancer patients who received surgery and chemotherapy [Citation3]. A majority of patients either undergo relapse or succumb to the disease due to chemotherapy resistance [Citation3,Citation4], which is attributed to a wide range of metabolic or structural properties within tumor cells, such as multidrug resistance proteins, mismatch repair processes, and alterations in the p53 pathway [Citation5]. In addition, about 75% of patients are diagnosed at an advanced stage because of the asymptomatic nature of OC [Citation1]. Thus, we explored novel molecular biomarkers for diagnosis, prognosis, and targeted therapy for OC.
Advances in sequencing technologies have led to the discovery of non-coding RNAs, which are key regulators of physiological activities and pathological processes, particularly in cancer [Citation6]. Long non-coding RNAs (lncRNAs) are widely expressed and can ultimately affect gene expression in diverse biological and physiopathological contexts by functioning as competing endogenous RNAs (ceRNAs) [Citation7]. CeRNAs, also known as miRNA ‘decoy’ or miRNA‘sponges’, are RNA transcripts that compete for the binding to miRNA via base pairing with miRNA recognition/response elements (MREs), resulting in subsequent reduction of the amount of available miRNAs to target messenger RNAs (mRNAs) [Citation8,Citation9]. Since human diseases are driven by complex interactions among a variety of molecular mediators rather than being caused by single molecular defect, ceRNA networks hold the promise of uncovering the causes and revolutionizing the diagnosis and treatments of human diseases [Citation10]. For instance, lncRNA PVT1 plays an important role in human breast cancer by dysregulating the ceRNA-ceRNA network [Citation11]. LncRNA-mediated ceRNA networks are involved in colorectal cancer initiation, progression, and metastasis [Citation12]. Zhao et al. showed that a lncRNA SNHG5/miR-32 axis plays an important role in the proliferation and migration of gastric cancer by targeting KLF4 [Citation13].
Therefore, we hypothesized that some lncRNAs can serve as critical biomarkers as well as therapeutic targets for OC. Hence, in this study, we aimed to develop a prognostic lncRNA signature with predicted candidate drugs for OC. We first identified and validated five differentially expressed lncRNAs (DElncRNA) for the development of a risk signature for OC patient survival. CeRNA regulatory networks were further established, as well as the relevant biological functions and pathways identified and candidate drugs predicted based on the prognostic signature. Finally, an online survival calculator was established to facilitate clinical practitioners.
2. Materials and methods
2.1. Data set extraction and processing
Functional genomic data sets were downloaded from UCSC Xena, the RNA sequencing profiles, clinical information, and survival data from serous OC (dataset ID: TCGA-OV.htseq_fpkm) and data for normal ovarian tissues (dataset ID: dataset ID: gtex_RSEM_gene_fpkm) were extracted from The Cancer Genome Atlas (TCGA) and Genotype-Tissue Expression (GTEx), respectively. The gene symbols were re-annotated using Ensembl (https://uswest.ensembl.org/index.html) to select lncRNAs [Citation14], expressions of which come from 88 normal ovarian samples and 379 OC samples and were presented by log2 (fpkm+1). Then, ‘limma’ package (version 3.42.0) [Citation15] was used to combine the two sets of lncRNAs into one with normalization. In total, 467 samples concerning 14,087 lncRNAs were filtered out, followed by removal of those genes with 0 expression.
2.2. DElncRNA identification
Using ‘stats’ package, version 3.6.2 [Citation16], principal component analysis (PCA) was performed to assess lncRNA expression distribution between OC and normal ovarian tissue. Using R language (limma package, R version 3.6.2), DElncRNAs between OC and normal ovarian tissue were determined according to the criteria set as | log2 (fold-change) | ≥ 2 and false discovery rate (FDR) < 0.05.
2.3. Prognostic lncRNA signature generation
Six OC samples were excluded due to the lack of survival data and clinical information. Running the ‘caret’ package, version 6.0–85 [Citation17], the DElncRNA profile was then randomly divided into a training cohort (n = 188) and a validation cohort (n = 185) according to the criteria that age, FIGO stage, and histological grade between the two groups were similar.
Data was divided into two groups, training cohort, where a survival analysis model was established by running ‘survival’ package (version 3.1–8) [Citation18] and a separate validation cohort for model testing. First, the training cohort was used to perform analysis step by step as follows: 1. Kaplan–Meier (KM) method was used to assess the survival differences between the low and high expression groups of lncRNA. 2. Application of univariate Cox proportional hazards regression models to evaluate the association between DElncRNA expressions and overall survival (OS) where P-value < 0.05 was considered statistically significant. 3. Least absolute shrinkage and selection operator (LASSO) regression was performed to filter out the DElncRNAs according to the best value of lambda, thus eliminating overfitting of the model. 4. Multivariate Cox proportional hazards regression analysis was used to further select lncRNAs by a ‘step’ function, with results visualized as a forest plot. Finally, a prognostic prediction model including five DElncRNAs was constructed based on the regression coefficient-weighted lncRNA expression. We took the prognostic index as the risk score and a risk score formula, which has been well established in the literature [Citation19], was generated as follows:
In the formula, N, Expi, and Coei represent the number of selected lncRNAs, expression of each lnc, and the multivariate Cox regression coefficient, respectively. A nomogram was constructed based on the lncRNA expression for predicting the survival of OC patients. We then extracted each corresponding lncRNA expression in the training cohort and substituted into the model, thereby generating every patient’s risk score, the median of which divided patients into low- and high-risk prognostic groups. Based on this, the receiver operating characteristic (ROC) curve (‘survivalROC’ packages, version 1.0.3) was used to assess the efficacies of the nomogram. Repetition was done in the validation cohort. Using DEnorm package (version 5.0.1), a free online calculator for the final nomogram was established and published in https://www.shinyapps.io/, in order to facilitate clinical use.
2.4. Construction of the lncRNA-miRNA-mRNA regulatory network
MiRNAs that potentially bind to lncRNAs were generated using DIANA tools [Citation20]. Predictions of miRNA-targeting genes were made using three datasets, including miRDB [Citation21], miRTarBase [Citation22], and TargetScan [Citation23]. Pearson analysis was performed to calculate the expression correlation between lncRNAs and miRNA-targeting genes. Target genes with | r | ≥ 0.3 were selected and Cytoscape (version 3.7.2) was used to construct the lncRNA-miRNA-mRNA regulatory networks.
2.5. Functional annotations and signaling pathway enrichment analysis
Gene Oncology (GO) and Kyoto Encyclopedia of Genes and Genomes (KEGG) pathway analysis of the risk signature were performed to analyze the target genes via the Metascape website [Citation24]. GO results and KEGG pathways with FDR < 0.05 were selected and shown in charts.
2.6. Identification of candidate small molecule drugs
Connectivity Map (CMap) (version build 02) is a database exploring connections among small molecules and genes [Citation25]. With its usage, candidate small-molecule drugs OC were predicted based on the rationale of targeting the ceRNA networks. The enrichment scores (ranging from −1 to 1) representing similarity were measured and drugs with negative connectivity were considered as potential therapeutics. To select drugs that are more likely to be effective, we set the enrichment scores < −0.85 and p-value < 0.001 as selection criteria. Tomographs of the candidate drugs were queried in the PubChem database.
2.7. Statistical analysis
All statistical tests were conducted using R programming language. Quantitative data are presented as the mean ± standard deviation. Statistical differences between the two groups were examined using the Wilcoxon test. P-value < 0.05 was considered statistically significant.
3. Results
In this study, we developed a prognostic model by using DElncRNAs to predict the survival of OC. Afterward, we established ceRNA regulatory networks for biological function, pathway exploration in addition to candidate drugs prediction. The results were as follows:
3.1. Identification of five prognostic DElncRNAs
A total of 14,087 lncRNAs were included in this study. To reduce the dimensionality, PCA was performed to increase the interpretability while minimizing the information loss at the same time. As a result, the distribution of the lncRNAs between OC and normal ovarian samples was clearly shown (). To reflect the distinct characteristics of OC and normal ovarian tissue, 158 DElncRNAs between these two datasets were selected for further study (). Each lncRNA with median expression levels in OC and normal ovarian tissues was shown (). OC patients in the TCGA dataset with detailed clinical information (age, clinical stage, histologic grade, survival time, and status) were enrolled and randomly divided into a training cohort (n = 188) and a validation cohort (n = 185) (Table S1). To confirm the prognostic value of these DElncRNAs, we performed a KM analysis in the training cohort and 15 potential prognostic DElncRNAs were screened out (Table S2), followed by the identification of 7 DElncRNAs that were correlated with OC prognosis (Table S3). To select appropriate parameters for constructing a risk signature, LASSO regression was used, six DElncRNAs were identified (AC011603.2, AC092718.4, AC138035.1, BMPR1B-DT, RNF157-AS1, and TPT1-AS1) (, b). Eventually, there were only five DElncRNAs (AC092718.4, AC138035.1, BMPR1B-DT, RNF157-AS1, and TPT1-AS1) left following multivariate Cox regression analysis. BMPR1B-DT, AC092718.4, and RNF157-AS1 were regarded as protective factors (HR < 1), while AC138035.1 and TPT1-AS1 were defined as risk factors (HR > 1) in OC ().
Figure 1. Identification of differentially expressed lncRNAs (DElncRNAs) for constructing the risk signature for OC. (a) Principal components analysis of lncRNAs between OC and normal ovarian tissue. (b) Volcano plot shows the distribution of DElncRNAs. Red and green dots represent the up-regulated and down-regulated DElncRNAs with | log2(fold-change) | ≥ 2, respectively (c) Heatmap exhibits the expression levels of the DElncRNAs. (d) Boxplot shows the detail of DElncRNAs. Red and green boxes indicate the lncRNA expression in OC and in normal ovarian tissue, respectively
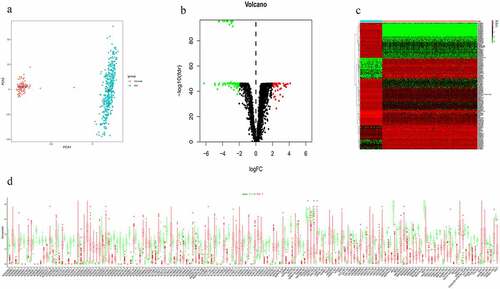
Figure 2. Differentially expressed lncRNA (DElncRNAs) for risk signature construction. (a) Log (Lambda) value of the 7 lncRNAs in the least absolute shrinkage and selection operator (LASSO) regression. (b) The most appropriate log (Lambda) value in the LASSO model. (c) Multivariate Cox regression analysis was performed and 5 lncRNAs (AC092718.4, AC138035.1, BMPR1B-DT, RNF157-AS1, and TPT1-AS1) were selected to construct the risk signature. (d-h) Kaplan–Meier analysis showed overall survival differences between low-risk and high-risk groups in AC092718.4, AC138035.1, BMPR1B-DT, RNF157-AS1, and TPT1-AS1, respectively
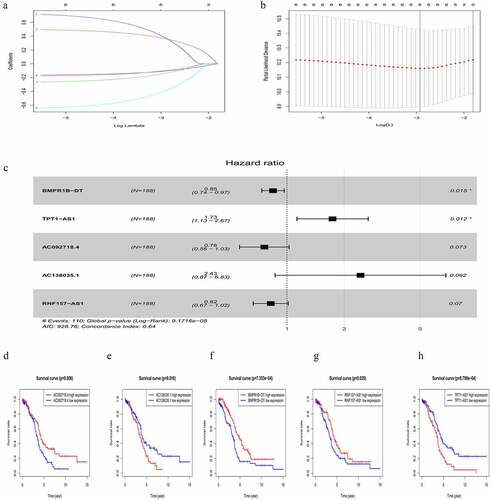
As shown in , higher levels of AC138035.1 or TPT1-AS1 exhibited poorer prognosis compared to those in the lower expression group. On the contrary, patients with higher expression of BMPR1B-DT, AC092718.4, and RNF157-AS1 had relatively favorable prognosis. Based on both univariate and multivariate Cox regression analysis, five DElncRNAs, as prognostic biomarkers, were suggested for further analysis.
3.2. Establishment of an OC prognostic risk signature using the five lncRNAs
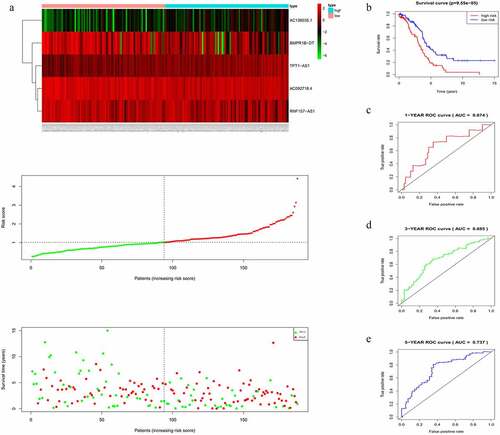
The risk score of each patient in the training cohort, calculated using the formula mentioned in the Materials and Methods 2.3, is as follows: risk score = (−0.2735 × expression level of AC092718.4) + (0.8891 × expression level of AC138035.1) + (−0.1682 × expression level of BMPR1B-DT) + (−0.1957 × expression level of RNF157-AS1) + (0.5509 × expression level of TPT1-AS1). Accordingly, patients were then divided into low – and high-risk groups based on the median risk score. As shown in , more deaths were seen with risk score rising. Interestingly, with the increasing in risk score, the expression levels of BMPR1B-DT, AC092718.4, and RNF157-AS1 were decreased, whereas levels of AC138035.1 and TPT1-AS1 were upregulated. As the KM curve suggested, high-risk group tended to develop poorer prognoses (). The ROC curve used to assess the efficacy of survival prediction in OC patients showed that the areas under curve (AUC) for the 1-, 3-, and 5-year survivals were 0.674, 0.685, and 0.737, respectively (), indicating good predictive efficacy of the risk signature.
Figure 3. Characteristics of the five-lncRNA risk signature in the training cohort. (a) LncRNA expression profiles, risk score distributions and patient survival in the training cohort. (b) Survival curves for high-risk and low-risk groups decided by the risk signature in the training cohort. (c-e) ROC of the five-lncRNA risk signature in predicting the 1-, 3-, and 5-year survival in the training cohort
3.3. Validation of the five-lncRNA risk signature
In accordance with the results in the training cohort, down-regulation of BMPR1B-DT, AC092718.4, and RNF157-AS1, and up-regulation of the other two lncRNAs in the validation cohort corresponded to an increase in number of deaths, as reflected by increased risk scores (). KM curves also showed that the high-risk group had poorer prognoses (). AUCs for 1-, 3-, and 5-year survival were 0.612, 0.558, and 0.564, respectively (), thus confirming the good efficacy for survival prediction.
Figure 4. Evaluating the efficacy of the five-lncRNA risk signature in the validation cohort. (a) LncRNA expression profiles, risk score distributions and patient survival in the validation cohort. (b) Survival curves for high-risk and low-risk groups decided by the risk signature in the validation cohort. (c-e) ROC of the five-lncRNA risk signature in predicting the 1-, 3-, and 5-year survival in the validation cohort

3.4. Construction of a nomogram based on the risk signature
To confirm the prognostic value of the risk signature, univariate and multivariate Cox regression analyses were conducted in the training cohort. It was observed that the risk signature of the five lncRNAs was independently associated with overall survival of OC (Figure S1A, S1B). Considering the potential clinical relevance, the prognostic values of age, histological grade, and FIGO stage were also evaluated. However, among these OC samples, factors such as age, clinical stage, and histologic grade were of no survival-prognostic value since their p-values were larger than 0.05. Thus, a nomogram was constructed using only the five lncRNAs. As the nomogram showed, the 1-, 3-, and 5-year survival incidences could quickly be determined according to the total points, by summing the points in each item (Figure S1C). An online software for the survival nomogram was utilized for easier clinical use by DEnorm package: https://linnuanqq.shinyapps.io/dynnomapp2/?_ga=2.1208497.1499237141.1594603552-159983587.1588641469.
3.5. LncRNA-miRNA-mRNA regulatory networks
LncRNAs can regulate gene expression by functioning as miRNA sponges and rescuing miRNA-targeted genes via ceRNA networks [Citation26]. MiRNAs that could potentially bind to the five lncRNAs were identified and listed in Table S4. The predicted mRNAs that were common in at least two of the databases used (miRDB, miRTarBase, and TargetScan) and those with | r | ≥ 0.3 were selected as potential target genes, listed in Table S5. Finally, lncRNA-miRNA-mRNA regulatory networks were established based on 5 lncRNAs, 531 miRNAs, and 1639 mRNAs. However, due to the huge number of genes in the network, only mRNAs with | r | ≥ 0.4 were visualized by Cytoscape ().
Figure 5. Construction of lncRNA-miRNA-mRNA regulatory networks with functional annotations and signaling pathways. (a) LncRNAs as well as their potential binding miRNAs and target genes with | r | ≥ 0.4 related to the five lncRNAs were used to construct the lncRNA-miRNA-mRNA regulatory networks. However, due to the huge number of genes in the networks, only mRNAs with | r | ≥ 0.4 are visualized here. Blue hexagons represent lncRNAs, which are located at the cores of the networks. Red ellipses and green triangles stand for miRNAs and mRNAs, respectively. Gene oncology (b) and KEGG pathway (c) analyses were performed based on the target genes of the networks via Metascape
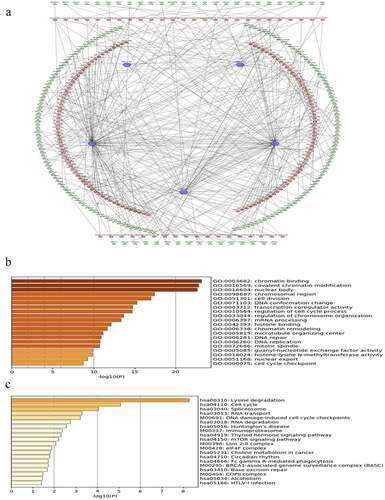
3.6. Functional annotations and signaling pathway enrichments
To further investigate the functions of the prognostic signature, the biological processes and pathways, based on the constructed ceRNA networks, were explored. The signature was closely related to cancer-associated biological processes, such as chromatin binding, covalent chromatin modification, and regulation of cell cycle process (, p-value < 0.05). Similarly, several KEGG pathways including cell cycle, DNA damage-induced cell cycle checkpoints, the mTOR signaling pathway, and the ovarian-specific BRCA1-associated genome surveillance complex (BASC) were identified (, p-value < 0.05). Taken together, these results suggest that the risk signature is correlated with the behavior of OC.
3.7. Five candidate small molecule drugs
A total of 1639 genes from the regulatory networks were analyzed in CMap, and five candidate small molecules with potential therapeutic value were predicted (). Thioridazine, trifluoperazine, loperamide, LY294002, and puromycin were all negatively correlated with the upregulated genes, and their tomographies were shown (Figure S2).
Table 1. The top 10 OC-related small molecules with highly significant correlations in the results of CMap
4. Discussion
The prognosis of OC remains poor, and there are few effective prognostic biomarkers or models for improving the clinical outcomes of OC patients. In the present study, we identify five key lncRNAs (TPT1-AS1, RNF157-AS1, BMPR1B-DT, AC092718.4, and AC138035.1) with a constructed risk signature for predicting survival of OC.
TPT1-AS1 (TPT1 antisense RNA 1) is located on chromosome 13 and has been reported to promote proliferation and metastasis in a variety of cancers [Citation27,Citation28]. Interestingly, our finding of TPT1-AS1 as a potential therapeutic target for OC is corroborated by the study of Wu et al., who recently showed that TPT1-AS1 induces OC tumor growth and metastasis [Citation29]. Limited research on RNF157-AS1 (RNF157 antisense RNA 1) has been published so far, with only a microarray analysis suggesting its up-regulation in OC, followed by quantitative real-time PCR validation [Citation30]. In addition to this previous finding, our results also suggest that RNF157-AS1 is a positive predictor for survival of OC patients. BMPR1B-DT is a divergent transcript of its neighboring protein-coding gene BMPR1B (ALK6). However, the role of BMPR1B-DT has not been elaborated. Transcription of the most divergent lncRNAs makes the adjacent gene locus more accessible or alternatively, inaccessible by competing for mRNA gene promoters [Citation31,Citation32]. Expression of BMPR1B is highest in adult ovaries, and is the major gene identified for reproductive traits including folliculogenesis. While it was reported that OC patients with BMPR1B expression have an unfavorable prognosis [Citation33], our results indicate that the lncRNA BMPR1B-DT predicts longer survival. Taken together, it is conceivable that lncRNA BMPR1B-DT is a competitor for the BMPR1B mRNA promoter. Despite emerging studies on the biological functions of lncRNAs, the role of the remaining two lncRNAs (AC092718.4, AC138035.1) in OC progression is not documented. Here, for the first time, we show that AC092718.4 has an HR < 1, indicating it is a positive predictor for OC. In contrast, a higher expression of AC138035.1 suggests an unfavorable prognosis in OC. Therefore, according to our study, all five lncRNAs can serve as candidate prognostic markers and therapeutic targets of OC, although further studies are warranted.
Emerging evidence suggests that lncRNAs play a vital role in a variety of physiological functions and disease progression, including cancer [Citation12,Citation13]. Importantly, some lncRNAs compete for specific miRNA target sites, thus, regulating gene expression via acting as ceRNAs [Citation7]. In this study, we constructed lncRNA-miRNA-mRNA regulatory networks to show the relationships of the lncRNAs (AC092718.4, AC138035.1, BMPR1B-DT, RNF157-AS1, and TPT1-AS1) along with their binding miRNAs and target genes. To explore the biological functions and signaling pathways of the risk signature, further gene enrichment analysis was performed, with results indicating that the ceRNA networks can play a role in cancer-related biological processes, such as regulation of cell cycle, chromatin binding, modification and remodeling, mTOR signaling pathway, and the ovarian-cancer specific BASC.
Currently, chemotherapeutic drugs including platinum, carboplatin, and paclitaxel are widely used among OC patients, with challenges posed by drug resistance and cancer recurrence. Molecular targets and pathways currently under investigation for drug development in ovarian cancers include, cell cycle inhibitors, mTOR inhibitors, and PI3K inhibitors. A recent study found that cisatracurium can inhibit the progression of OC cells by upregulating lncRNA-p21 activated by p53 inhibiting miR-181b expression, indicating that drugs targeting ceRNA networks are indeed promising in treating OC [Citation34]. In our study, we found five small-molecule drugs with potential therapeutic efficacy based on OC RNA-seq using bioinformatics analysis, thus guiding the direction for future drug exploration. Thioridazine, a potent anti-psychotic and anti-anxiety agent, was specifically demonstrated to act against OC, possibly by targeting the mTOR pathway [Citation35]. Trifluoperazine, is another widely used clinical antipsychotic agent that reportedly regulates cell cycle progression and has been shown to potentiate cisplatin toxicity in ovarian carcinoma cells [Citation36,Citation37]. As a classical antidiarrhea agent, loperamide is being increasingly recognized as a tumor suppressor in several cancer cells, including ovarian cancer, via inducing G2/M-phase cell cycle arrest [Citation38,Citation39]. LY294002, a potent PI3-K inhibitor, has been shown to inhibit tumor growth and ascites formation in OC [Citation40]. Puromycin is a tRNA mimic traditionally viewed as an antibiotic [Citation41]. Unlike the other four small molecules, its efficacy has never been reported in OC. However, puromycin induced apoptosis in breast cancer cells mediated by insulin-like growth factor 1 (IGF-I) [Citation42]. Considering that the involvement of IGF-I in ovarian tumorigenesis has been supported by IGF-I-targeting strategies and ongoing clinical trials [Citation43], a therapeutic potential of puromycin in OC can be anticipated. Nonetheless, further investigation is required in xenograft models and in clinical trials to gain more insight into these five potential therapeutic drugs for clinical application.
Zhou M et al., recently identified 10 prognostic lncRNAs and the associated ceRNA in ovarian cancer using the TCGA database [Citation44]. However, it is not surprising that there is no overlap between the 10 lncRNAs identified by their analyses and the 5 lncRNAs proposed by us, since in the current study, it is the aberrantly expressed lncRNA between OC and normal ovarian tissue that were identified. An important advantage of this study is the use of transcriptome data from the GTEx Project [Citation45], which allows accessibility to a much larger source of ovarian tissue data, while minimizing the measurement bias compared to data extraction from different GEO datasets. In addition to that, we made significant improvements in survival prediction in OC patients. First, LASSO regression was used to identify lncRNA in order to avoid overfitting of the model. Secondly, we constructed lncRNA-miRNA-mRNA regulatory networks and described the underlying functions of the risk signature in OC based on highly correlated genes. Thirdly, we validated the established risk signature in a validation group, thereby testing its accuracy in predicting survival. Nonetheless, we recognize that our study has some limitations. First, the data of ovarian cancer samples with clinicopathological information included are still limited. Additionally, the histologic grade and FIGO stage were of no predictive value for OC survival, probably due to the statistically increased false-negative rate, when samples in some sub-groups were too small to be followed by sub-staging and sub-grading [Citation46]. Nevertheless, our risk score has good performance in predicting the 1-, 3-, and 5-year survival of the validation cohort, indicating that molecular features may be more stable in prognosis. Moreover, some other confounding factors of survival, such as surgical resection and chemotherapy, were not available in the datasets and thus not taken into account. Finally, the validation cohort was based on 185 retrospective cases from TCGA, so we may replicate our study in larger cohorts with comprehensive clinical information to validate the five-lncRNA signature in future studies.
5. Conclusion
Our study complements available genomic-based studies, identifies lncRNA biomarkers, establishes a five-lncRNA signature for survival prediction, and constructs ceRNA networks for exploration of potentially more selective drugs for OC.
Notes on Contributions:
Nuan Lin: conceptualization, methodology, software, data curation, formal analysis, writing-original draft preparation. Jiazhe Lin: methodology, data curation, writing-original draft preparation, visualization. Yoshiaki Tanaka: visualization, writing-review & editing. Pingnan Sun: supervision, funding acquisition, writing-review & editing. Xiaoling Zhou: project administration, funding acquisition, conceptualization, supervision, writing-review & editing. All authors have read and agreed to the published version of the manuscript.
Supplemental Material
Download ()Acknowledgements
This work was supported by the National Natural Science Foundation of China (Grant No. 81870432, 81570567, and 81571994), the Li Ka Shing Shantou University Foundation (Grant No. L11112008). The authors thank UCSC Xena for the availability of the data and Dr. Waqas Iqbal for kindly revising this manuscript.
Disclosure statement
The authors declare that they have no competing interests.
Supplementary material
Supplemental data for this article can be accessed here.
Additional information
Funding
Related Research Data
References
- Lheureux S, Gourley C, Vergote I, et al. Epithelial ovarian cancer. Lancet. 2019;393(10177):1240–1253.
- Gadducci A, Guarneri V, Peccatori FA, et al. Current strategies for the targeted treatment of high-grade serous epithelial ovarian cancer and relevance of BRCA mutational status. J Ovarian Res. 2019;12(1):9.
- Franzese E, Centonze S, Diana A, et al. PARP inhibitors in ovarian cancer. Cancer Treat Rev. 2019;73:1–9.
- Pokhriyal R, Hariprasad R, Kumar L, et al. Chemotherapy resistance in advanced ovarian cancer patients. Biomark Cancer. 2019;11:1179299X19860815.
- Vasey PA. Resistance to chemotherapy in advanced ovarian cancer: mechanisms and current strategies. Br J Cancer. 2003;89(S3):S23–S8.
- Anastasiadou E, Jacob LS, Slack FJ. Non-coding RNA networks in cancer. Nat Rev Cancer. 2017;18(1):5–18.
- Yoon J-H, Abdelmohsen K, Gorospe M Functional interactions among microRNAs and long noncoding RNAs. Seminars in cell & developmental biology. 2014; 34:9–14.
- Poliseno L, Salmena L, Zhang J, et al. A coding-independent function of gene and pseudogene mRNAs regulates tumour biology. Nature. 2010;465(7301):1033–1038.
- Russo F, Fiscon G, Conte F, et al. Interplay between long noncoding RNAs and microRNAs in cancer. Methods Mol Biol. 2018;1819:75–92.
- Conte F, Fiscon G, Licursi V, et al. A paradigm shift in medicine: a comprehensive review of network-based approaches. Biochim Biophys Acta Gene Regul Mech. 2020;1863(6):194416.
- Conte F, Fiscon G, Chiara M, et al. Role of the long non-coding RNA PVT1 in the dysregulation of the ceRNA-ceRNA network in human breast cancer. PLoS One. 2017;12(2):e0171661.
- Wang L, Cho KB, Li Y, et al. Long Noncoding RNA (lncRNA)-mediated competing endogenous RNA networks provide novel potential biomarkers and therapeutic targets for colorectal cancer. Int J Mol Sci. 2019;20(22):5758.
- Zhao L, Han T, Li Y, et al. The lncRNA SNHG5/miR-32 axis regulates gastric cancer cell proliferation and migration by targeting KLF4. The FASEB Journal. 2017;31(3):893–903.
- Wright MW. A short guide to long non-coding RNA gene nomenclature. Hum Genomics. 2014;8(1):7.
- Ritchie ME, Phipson B, Wu D, et al. limma powers differential expression analyses for RNA-sequencing and microarray studies. Nucleic Acids Res. 2015;43(7):e47–e.
- Venables W, Ripley B. Modern applied statistics with S. New York: Springer-Verlag; 2002.
- Kuhn M. Building predictive models in R using the caret package. J Stat Softw. 2008;28(5):1–26.
- Collett D. Modelling survival data in medical research, Third Edition, Bristol, UK: Chapman and Hall/CRC, 2015.
- Lin JZ, Lin N, Zhao WJ. Identification and validation of a six-lncRNA prognostic signature with its ceRNA networks and candidate drugs in lower-grade gliomas. Genomics. 2020;112(5):2990–3002.
- Paraskevopoulou MD, Vlachos IS, Karagkouni D, et al. DIANA-LncBase v2: indexing microRNA targets on non-coding transcripts. Nucleic Acids Res. 2016;44(D1):D231–8.
- Chen Y, Wang X. miRDB: an online database for prediction of functional microRNA targets. Nucleic Acids Res. 2020;48(D1):D127–d31.
- Hsu SD, Lin FM, Wu WY, et al. miRTarBase: a database curates experimentally validated microRNA-target interactions. Nucleic Acids Res. 2011;39(suppl_1):D163–9.
- Agarwal V, Bell GW, Nam JW, et al. Predicting effective microRNA target sites in mammalian mRNAs. Elife. 2015;4. DOI:10.7554/eLife.05005
- Zhou Y, Zhou B, Pache L, et al. Metascape provides a biologist-oriented resource for the analysis of systems-level datasets. Nat Commun. 2019;10(1):1523.
- Lamb J, Crawford ED, Peck D, et al. The Connectivity Map: using gene-expression signatures to connect small molecules, genes, and disease. Science. 2006;313(5795):1929–1935.
- Ling H, Fabbri M, Calin GA. MicroRNAs and other non-coding RNAs as targets for anticancer drug development. Nat Rev Drug Discov. 2013;12(11):847–865.
- Jia L, Song Y. Long noncoding RNA TPT1-AS1 downregulates the microRNA-770-5p expression to inhibit glioma cell autophagy and promote proliferation through STMN1 upregulation. Cancer Sci. 2020;235:3679–3689.
- Zhang Y, Sun J, Qi Y, et al. Long non-coding RNA TPT1-AS1 promotes angiogenesis and metastasis of colorectal cancer through TPT1-AS1/NF90/VEGFA signaling pathway. Aging (Albany NY). 2020;12(7):6191–6205.
- Wu W, Gao H, Li X, et al. LncRNA TPT1-AS1 promotes tumorigenesis and metastasis in epithelial ovarian cancer by inducing TPT1 expression. Cancer Sci. 2019;110(5):1587–1598.
- Wang H, Fu Z, Dai C, et al. LncRNAs expression profiling in normal ovary, benign ovarian cyst and malignant epithelial ovarian cancer. Sci Rep. 2016;6:38983.
- Wu X, Sharp PA. Divergent transcription: a driving force for new gene origination? Cell. 2013;155(5):990–996.
- Gibbons HR, Shaginurova G, Kim LC, et al. Divergent lncRNA GATA3-AS1 Regulates GATA3 Transcription in T-Helper 2 Cells. Front Immunol. 2018;9:2512.
- Basal E, Ayeni T, Zhang Q, et al. Patterns of Mullerian inhibiting substance type II and candidate type I receptors in epithelial ovarian cancer. Curr Mol Med. 2016;16(3):222–231.
- Zhu D, Shi C, Jiang Y, et al. Cisatracurium inhibits the growth and induces apoptosis of ovarian cancer cells by promoting lincRNA-p21. Bioengineered. 2021;12:1505–1516.
- Park MS, Dong SM, Kim B-R, et al. Thioridazine inhibits angiogenesis and tumor growth by targeting the VEGFR-2/PI3K/mTOR pathway in ovarian cancer xenografts. Oncotarget. 2014;5(13):4929–4934.
- Marques LO, Lima MS, Soares BGO Trifluoperazine for schizophrenia. The Cochrane database of systematic reviews. 2004: CD003545.
- Perez RP, Handel LM, Hamilton TC. Potentiation of cisplatin cytotoxicity in human ovarian carcinoma cell lines by trifluoperazine, a calmodulin inhibitor. Gynecol Oncol. 1992;46(1):82–87.
- Regan RC, Gogal RM, Barber JP, et al. Cytotoxic effects of loperamide hydrochloride on canine cancer cells. J Vet Med Sci. 2014;76(12):1563–1568.
- Gong XW, Xu YH, Chen XL, et al. Loperamide, an antidiarrhea drug, has antitumor activity by inducing cell apoptosis. Pharmacol Res. 2012;65(3):372–378.
- Hu L, Zaloudek C, Mills GB, et al. In vivo and in vitro ovarian carcinoma growth inhibition by a phosphatidylinositol 3-kinase inhibitor (LY294002). Clin Cancer Res. 2000;6(3):880–886.
- Giegé R, Frugier M, Rudinger J. tRNA mimics. Curr Opin Struct Biol. 1998;8(3):286–293.
- Söderlund G, Haarhaus M, Chisalita S, et al. Inhibition of puromycin-induced apoptosis in breast cancer cells by IGF-I occurs simultaneously with increased protein synthesis. Neoplasma. 2004;51(1):1–11.
- Beauchamp M-C, Yasmeen A, Knafo A, et al. Targeting insulin and insulin-like growth factor pathways in epithelial ovarian cancer. J Oncol. 2010;2010:257058.
- Zhou M, Wang X, Shi H, et al. Characterization of long non-coding RNA-associated ceRNA network to reveal potential prognostic lncRNA biomarkers in human ovarian cancer. Oncotarget. 2016;7(11):12598–12611.
- The Genotype-Tissue Expression (GTEx) project. Nat Genet. 2013;45(6):580–585.
- Paik ES, Lee J-W, Park J-Y, et al. Prediction of survival outcomes in patients with epithelial ovarian cancer using machine learning methods. J Gynecol Oncol. 2019;30(4):30.