
 ?Mathematical formulae have been encoded as MathML and are displayed in this HTML version using MathJax in order to improve their display. Uncheck the box to turn MathJax off. This feature requires Javascript. Click on a formula to zoom.
ABSTRACT
Gastric cancer (GC) is one of the most common malignancies worldwide. Despite rapid advances in systemic therapy, GC remains the third leading cause of cancer-related deaths. We aimed to identify a novel prognostic signature associated with FAT2 mutations in GC. We analyzed the expression levels of FAT2-mutant and FAT2-wildtype GC samples obtained from The Cancer Genome Atlas (TCGA). The Kaplan–Meier survival curve showed that patients with FAT2 mutations showed better prognosis than those without the mutation. Sixteen long non-coding RNAs (lncRNAs) and 62 messenger RNAs (mRNAs) associated with FAT2 mutations were correlated with the prognosis of GC. We then constructed a 4-mRNA signature and a 5-lncRNA signature for GC. Finally, we identified the most relevant RP11-21 C4.1/SVEP1 gene pair as a prognostic signature of GC that exhibited superior predictive performance in comparison with the 4-mRNA or 5-lncRNA signature by weighted gene correlation network analysis (WGCNA) and Cox proportional hazards regression analysis. In this study, we constructed a prognostic signature of GC by integrative genomics analysis, which also provided insights into the molecular mechanisms linked to FAT2 mutations in GC.
Graphical abstract
KEYWORDS:
Introduction
Gastric cancer (GC) is the fifth-most common malignancy worldwide. Despite the global decline in the incidence and mortality rates of this cancer since the last mid-century, GC remains the third leading cause of cancer-related deaths, with an estimated 783,000 deaths in 2018 [Citation1]. Although surgery is regarded as the principal treatment with curative intent, 40%–60% of those who undergo resection surgery show disease relapse [Citation2]. The prognosis of these patients is poor, with a 5-year survival rate of less than 10% [Citation1]. Various genetic mutations have been found to play vital roles in the development of cancer and are considered potential hallmarks of the disease [Citation3]. Alterations in the expression patterns of these genes can lead to different clinical outcomes. With the advancements in genomics, the clinical classification of cancer has begun to shift from a histology-based to a biomarker-driven process [Citation4]. Thus, the search for prognostic biomarkers is a promising and essential field of study [Citation5].
FAT atypical cadherin 2 (FAT2) is a homolog of the Drosophila fat gene, which is involved in Hippo signaling cascades and tumor suppression [Citation6]. Mutations in FAT2 frequently occur in many types of tumors, such as spinal meningiomas, malignant mesotheliomas, esophageal squamous cell carcinoma, and colorectal cancer [Citation7–10]. FAT2 knockdown inhibits the migration of human squamous carcinoma cells and induction of FAT2 by ΔNp63α promotes tumor invasion, indicating that alterations in FAT2 expression play a role in the development of tumors [Citation11,Citation12]. However, studies on FAT2 in gastric cancer are relatively scarce. Only one study has shown that FAT2 is significantly correlated with lymph node and distant metastases and poor prognosis in GC [Citation13]. However, the effect of FAT2 mutations on survival and the mechanism by which FAT2 mutations affect tumor progression in GC remain unclear and require elucidation.
The present study aimed to explore the correlation between FAT2 mutations and the prognosis of GC, as well as the molecular mechanisms linked to FAT2 mutations in GC by combining genetic mutation, mRNA expression, and lncRNA expression information obtained from TCGA, in order to identify a novel prognostic biomarker for GC based on FAT2 mutations. In comparison with studies evaluating the molecular levels separately, integrative genomics analysis yields a higher information content [Citation14]. We found that FAT2 mutations were associated with a favorable prognosis in GC. Lastly, a transcriptomic gene pair was identified as a prognostic biomarker for GC by analyzing the differentially expressed mRNAs (DEmRNAs) and differentially expressed lncRNAs (DElncRNAs) associated with FAT2 mutations.
Materials and methods
Data sources
The somatic mutation, transcriptome, and corresponding clinical data of stomach adenocarcinoma (STAD) were downloaded from TCGA (https://portal.gdc.cancer.gov). Patients with GC were classified into FAT2-mutant and FAT2-wildtype groups.
Survival analysis
The Kaplan–Meier method was used to generate survival curves for the FAT2-mutant and FAT2-wildtype groups. The differences in survival curves were determined using the log-rank test. Statistical analyses were performed with R. A P-value of <0.05 was regarded as statistically significant.
Differentially expressed gene (DEG) analysis and functional enrichment analysis
The R package ‘edgeR’ was used to identify the DElncRNAs and DEmRNAs between FAT2-mutant and FAT2-wildtype groups with a fold-change analysis and t-test. Genes with an absolute fold change (log2) of >2 and adjusted P-value of <0.05 were considered as DEGs. To explore the biological attributes of these DEGs, we conducted Gene Ontology (GO) analysis and Kyoto Encyclopedia of Genes and Genomes (KEGG) analysis using the R package ‘clusterProfiler.’ Gene-set enrichment analysis (GSEA) was used to identify statistically significant sets of genes based on candidate genes.
Weighted gene co-expression network analysis (WGCNA)
WGCNA was performed with the R package ‘WGCNA’ to create and analyze a co-expression network for DEGs. The STAD samples were clustered using average linkage and Pearson’s correlation coefficients. A power of β equal to 4 was selected as the soft-threshold parameter to construct the co-expression gene network. Then, we calculated a topological overlap matrix (TOM) using the adjacency matrix. TOM dissimilarity was evaluated for module partition analysis. A hierarchical clustering tree of genes was constructed to classify genes with similar expression patterns. Subsequently, we used the Dynamic Tree Cut algorithm to obtain the modules of the network by cutting the branches of the tree. Finally, the most important genes in each selected module were used for further analysis. This step was based on two limiting parameters: gene significance (GS) and module membership (MM).
Construction of lncRNA and mRNA prognostic risk models
The genes in the blue-green module were subjected to univariate Cox proportional hazards regression analysis. Genes associated with prognosis were also identified. Subsequently, we used the least absolute shrinkage and selection operator (LASSO) analysis to filter genes. Cox regression analysis was performed to develop prognostic risk signatures with the screened genes. The risk score of each patient was calculated using the following formula: risk score=. (expression level of gene * regression coefficient). On the basis of the median risk score, patients with GC were divided into high- and low-risk groups, and Kaplan–Meier survival curves were constructed to compare the OS of the two groups. The R package ‘survivalROC’ was applied to assess the predictive potential of the two models by measuring their AUC values.
Identification and analysis of the RP11-21C4.1/SVEP1 gene pair
We explored the correlation between mRNAs and lncRNAs in the prognostic models. The most relevant gene pair was identified using Pearson correlation analysis. The rank sum test was used to compare DElncRNAs and DEmRNAs. The association between RP11-21C4.1/SVEP1 and clinical characteristics was analyzed using logistic regression.
Construction of the TF-mRNA network on the basis of the candidate genes
We used the R package ‘limma’ to identify DEGs between the SVEP1 high-expression and low-expression groups. Then, we used the module ‘UCSC_TFBS’ under the ‘Protein Interactions’ function of DAVID to annotate the DEG list. Finally, the identified TFs were visualized using Cytoscape software.
Results
This study aimed to construct a gene pair prognostic signature in GC associated with FAT2 mutations. We explored the correlation between FAT2 mutations and the prognosis of GC by using the Kaplan–Meier method, and further analyzed the differentially expressed mRNAs and lncRNAs based on the FAT2 mutation status. The prognostic mRNAs and lncRNAs were identified, and an lncRNA/mRNA gene pair prognostic signature was constructed by weighted gene correlation network analysis (WGCNA) and Cox proportional hazards regression analysis. Our study yielded a precise predictor of the prognosis of patients with GC and could provide support for clinical decision-making.
The prognosis of FAT2 mutations in GC
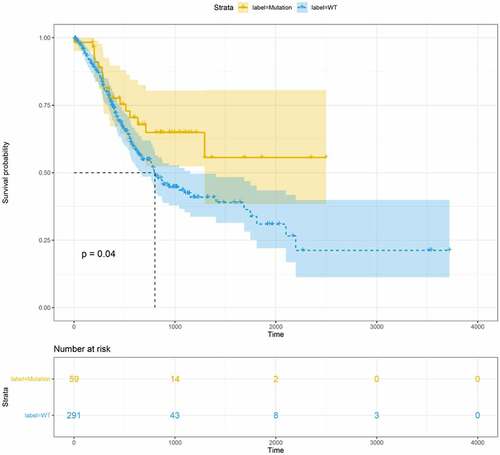
A total of 375 STAD samples obtained from TCGA were divided into the FAT2-mutant (n = 63) and the FAT2-wildtype (n = 312) groups. After excluding the samples without clinical data, 59 FAT2-mutant and 291 FAT2-wildtype samples were subjected to survival analysis. The FAT2-mutant frequency in GC was approximately 16.8%. The FAT2 mutations in patients with GC were mainly missense, truncating, and splice mutations, with missense mutations being the most common. We further validated the FAT2 mutations in another database obtained from cbioportal, which showed a 14% mutant frequency in GC. The KM survival curve was drawn to explore the effect of FAT2 mutations on the prognosis of GC. In comparison with patients without FAT2 mutations, those with FAT2 mutations showed a better prognosis ().
Figure 1. Overall survival of GC patients in the FAT2-mutant and FAT2-wildtype groups
Identification of the DElncRNAs and DEmRNAs between FAT2-mutant and FAT2-wildtype samples of GC
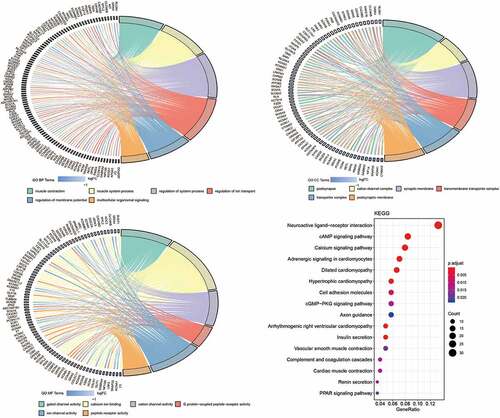
To explore the potential mechanism of FAT2 mutations in GC, we identified the transcriptomic features associated with FAT2 mutations. A total of 365 DElncRNAs were downregulated in FAT2-mutant samples. Meanwhile, 576 DEmRNAs were identified, of which 5 and 571 were upregulated and downregulated, respectively (). Then, we performed GO and KEGG analyses to explore the characteristic biological attributes of these DEmRNAs. Our results showed that the DEmRNAs were mainly enriched in the intracellular material transport and signal transduction-related biological processes and pathways, such as regulation of ion transport, regulation of membrane potential, multicellular organismal signaling, transporter complex, gated channel activity, cAMP signaling pathway, calcium signaling pathway, and cell adhesion molecules (). These findings demonstrated that the identified DEmRNAs played an important role in biological function, and these related processes and pathways might underlie the effects of FAT2 mutations in the development of GC.
Figure 2. Identification of the DElncRNAs and DEmRNAs between the FAT2-mutant and FAT2-wildtype groups. (a) Volcano plot for DElncRNAs. (b) Volcano plot for DEmRNAs. (c) Heatmaps for the DElncRNAs. (d) Heatmaps for the DEmRNAs
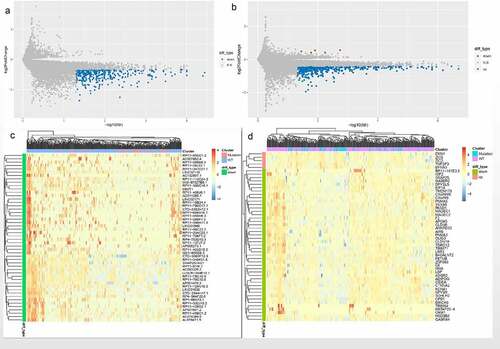
Figure 3. Functional enrichment analysis related to DEmRNAs. (a) Significantly enriched biological processes in the GO analysis. (b) Significantly enriched cell components in the GO analysis. (c) Significantly enriched molecular function in the GO analysis. (d) Significantly enriched pathways in KEGG analysis
Identification of a prognosis-related module based on WGCNA
We constructed a scale-free signed network based on the soft threshold. A total of six nongray modules were generated for further analysis by hierarchical clustering of adjacency-based dissimilarity. The gene dendrograms are shown in Fig. S1A. A topological overlap heatmap was drawn with 400 randomly selected DEGs that showed a high degree of topological overlap of genes per module (Fig. S1B). The heatmap revealed the eigengene adjacency of six co-expression modules (Fig. S1C). To identify the genes associated with certain clinical traits, we analyzed the relevance between modules and the clinical parameters of GC. As shown in Fig. S1D, the blue-green module was significantly associated with histologic grade, number of positive lymph nodes, and pathological T category. Therefore, we focused on the blue-green module as the most relevant to the OS of GC patients.
Construction of lncRNA and mRNA prognostic signatures
To further explore the prognostic value of all genes in the blue-green module, univariate Cox regression analysis of OS was performed. The results indicated that 78 genes encoding 16 lncRNAs and 62 mRNAs were correlated with the prognosis of GC (Fig. S2). These genes were selected for subsequent analyses and construction of prognostic signatures
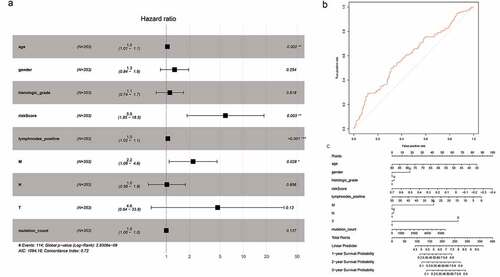
To minimize the risk of overfitting the prognostic signature, we performed LASSO regression analysis with tenfold cross-validation on these 16 lncRNAs. Using multivariate Cox regression analysis, we built a 5-lncRNA prognostic risk signature (Fig. S3A-C). Risk score = e (RP11-248N22.1 * 0.007573 + FGF10-AS1* 0.0005717+ RP11-21C4.1*0.003929 + RP11-963H4.6 * 0.01052 + LINC01697 * 0.02340). The patients were divided into high-risk (n = 176) and low-risk (n = 177) groups on the basis of the median risk score. We subsequently performed univariate Cox regression analysis to identify prognostic factors. Eventually, age, risk score, number of positive lymph nodes, and pathologic M category were shown to be significantly correlated with OS ()). The AUC-ROC of the 5-lncRNA signature was 0.605, with a high predictive value for survival ()). The results of the multivariate Cox regression analysis were visualized by drawing a nomogram ())
Figure 4. Cox proportional hazards regression analysis of lncRNAs. (a) Forest plot of risk factors. (b) The AUC for risk score was calculated according to the ROC curve. (c) Nomogram of OS prediction in GC
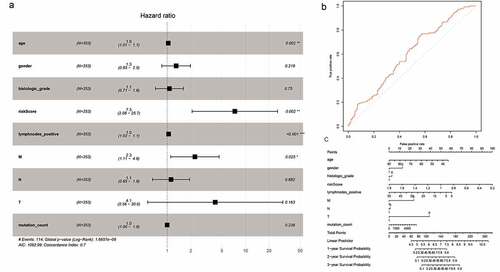
The analysis of 62 mRNAs was performed as described previously. Finally, a 4-mRNA prognostic risk signature was constructed (Fig. S4A-C). Risk score = e (APOD * 0.02833 + STK32A * 0.04637 + SVEP1 * 0.01973 + NPTX1 * 0.005390). On the basis of the median risk score, the patients were divided into high-risk (N = 176) and low-risk (N = 177) groups ()). Univariate Cox regression analysis showed that age, risk score, number of positive lymph nodes, and pathologic M category were significantly correlated with OS ()). The AUC-ROC value of the prognostic signature was 0.599 ()). The results of the multivariate Cox regression analysis were visualized by drawing a nomogram ()).
Figure 5. Cox proportional hazard regression analysis of mRNAs. (a) Forest plot of risk factors. (b) The AUC for the risk score was calculated according to the ROC curve. (c) Nomogram of OS prediction in GC
Identification of the RP11-21C4.1/SVEP1 gene pair as a prognostic biomarker in GC
To better understand the effects of the genes in the prognostic models, we compared the respective risk scores among different clinical traits. As shown in Fig. S5, the risk score of the 5-lncRNA signature was significantly related to histologic grade, gender, and age, while the risk score of the 4-mRNA signature was significantly related to histologic grade, pathologic T category, tumor grade, and age. The results demonstrated that the mRNA and lncRNA prognostic models showed good applications in terms of age and histologic grade. The risk score of the 5-lncRNA signature showed no significant difference in relation to the pathologic T category. However, the two prognostic models showed a high risk score in the group with a high degree of primary tumor invasion, suggesting that these identified genes could be prognostic biomarkers in GC.
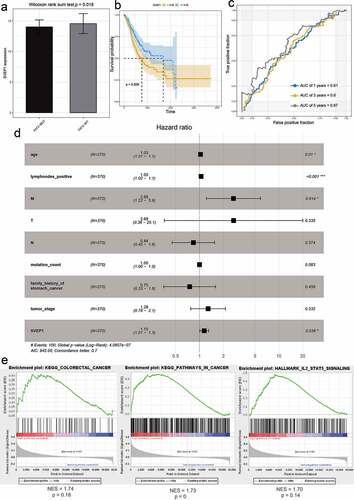
LncRNAs drive many important cancer phenotypes through their interactions with mRNA, and they have been described to play roles in the control of mRNA stability, splicing, and translation [Citation15]. Therefore, we analyzed the correlation between mRNAs and lncRNAs in prognostic models. RP11-21C4.1/SVEP1 was identified as the most relevant gene pair (r = 0.54, P < 0.05) (Fig. S6). We then studied the clinical significance of RP11-21C4.1 and SVEP1 in GC. As expected, RP11-21C4.1 and SVEP1 were coordinately downregulated in FAT2-mutant samples (); )). These results suggest that RP11-21C4.1 may play a role in the control of SVEP1 expression during the development of GC. High expression of RP11-21C4.1 or SVEP1 was associated with a poor OS (); )). The AUC-ROC of RP11-21C4.1 or SVEP1 for OS was 0.67 at 5 years (); )), suggesting that both genes have a good predictive performance for OS. It has been reported that two-gene markers showed more sensitive and specific than single-gene markers, which provided more accurate indicator for the diagnosis of cancers. We further plotted the ROC curves of two-biomarker combinations, which suggested that AUC values were 0.69 at 5 years (Fig. S7). In terms of the prognostic value, two-biomarker combinations are superior than RP11-21C4.1 or SVEP1 gene. In the univariate Cox regression analysis, the hazard ratios (HRs) of RP11-21C4.1 and SVEP1 were 1.04 and 1.15, respectively (); )). This proved that RP11-21C4.1 and SVEP1 were independent prognostic factors for GC. Furthermore, the set of genes associated with cancers, including GC, was enriched in the RP11-21C4.1 and SVEP1 high-expression phenotype (); )).
Figure 6. The effect of RP11-21C4.1 on the prognosis of GC. (a) The expression value of RP11-21C4.1 in FAT2-mutant and FAT2-wildtype GC. (b) Kaplan–Meier curves for the OS of GC patients in the high- and low-RP11-21C4.1 groups. (c) The AUC for RP11-21C4.1 was calculated according to the ROC curve. (d) Multivariable Cox regression analysis. (e) Cancer gene enrichment analysis based on the state of RP11-21C4.1 expression
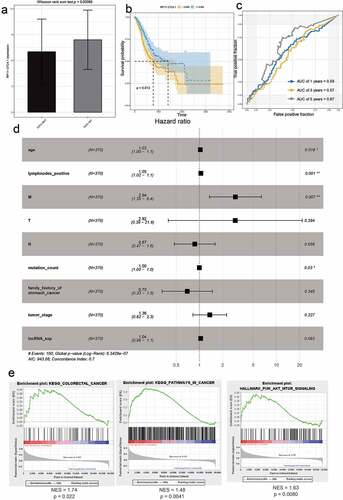
Figure 7. The effect of SVEP1 on the prognosis of GC. (a) The expression value of SVEP1 in FAT2-mutant and FAT2-wildtype GC. (b) Kaplan–Meier curves for the OS of GC patients in the SVEP1 high- and low-expression groups. (c) The AUC for SVEP1 was calculated according to the ROC curve. (d) Multivariable Cox regression analysis. (e) Gene enrichment analysis based on the state of SVEP1 expression
Construction of the TF-mRNA network based on candidate genes
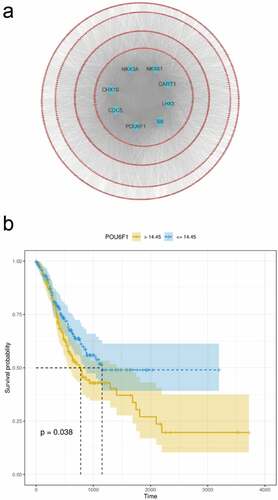
To identify the targets of the RP11-21C4.1/SVEP1 gene pair, we constructed a TF-mRNA network. A total of 1589 DEGs were identified between SVEP1 high-expression and SVEP1 low-expression groups. Finally, TFs (CHX10, CDC5, POU6F1, S8, LHX3, CART1, NKX61, and NKX3A) associated with cancers were significantly enriched in DEGs. These TFs may be potential targets of SVEP1 ()). We also explored the association between the eight TFs and GC prognosis. As shown in ), POU6F1 was linked to GC prognosis.
Figure 8. Construction of the TF-mRNA network. (a) TFs enriched for DEGs between the SVEP1 high- and low-expression groups. (b) The association between POU6F1 and the prognosis of GC
Discussion
Gastric cancer is a disease with marked heterogeneity that can result in poor response to conventional treatments, contributing to a high mortality rate and poor prognosis. Traditional methods are limited and cannot address these barriers. Thus, novel investigations must be conducted to identify new biomarkers with specific prognostic potential that can aid in personalized clinical treatment decision-making [Citation16]. With the development of high-throughput technologies, a landscape of signatures is emerging to fulfil the vision of precision medicine for cancer. In this study, we analyzed DEmRNAs and DElncRNAs associated with FAT2 mutations, and their potential interactions, to identify the RP11-21C4.1/SVEP1 gene pair as a prognostic signature of GC. Notably, the RP11-21C4.1/SVEP1 prognostic signature exhibited superior predictive performance in comparison with a 4-mRNA or 5-lncRNA prognostic signature in GC. Integration of both mRNA and lncRNA into a prognostic model may enhance robustness. The AUC of the P11-21C4.1/SVEP1 signature was 0.67, while the previously published prognostic signature for GC only reached an AUC of 0.63 [Citation17]. Additionally, in comparison with the prognostic signature of five genes built by Yang et al., our prognostic signature with two genes was more economical [Citation17].
Mutations observed in cancer cells have different functional effects; some do not have a noticeable impact, and others can alter key functions such as oncogenic activation and tumor suppression [Citation18]. Millions of somatic mutations in cancer genomes have been identified by genome sequencing. However, the functional effects of most somatic mutations in cancer remain unknown. Identification of driver mutations in cancer and elucidation of their oncogenic mechanisms represents a challenge in implementing precision medicine [Citation19]. FAT2 mutations occur in many cancers, including GC. To date, the effect of these mutations on the prognosis of GC has not been studied. In this study, we found that patients with FAT2 mutations showed better prognosis, suggesting that these mutations play a role in tumor suppression in GC. To better understand the functional effects of FAT2 mutations in GC, we explored the DEmRNAs and DElncRNAs based on the status of FAT2 mutations, and found that these DEGs were mainly enriched in the intracellular material transport and signal transduction-related biological processes and pathways. FAT2 is a member of the cadherin superfamily and acts as a transmembrane receptor for Hippo signaling [Citation6,Citation20], which is consistent with our findings. Dysregulation of the Hippo pathway signaling is frequently observed in GC, contributing to tumor progression [Citation21]. This might be one of the mechanisms by which FAT2 mutations affect the prognosis of GC.
Numerous studies have found some genomic mutations in regions that do not encode proteins but are often transcribed into lncRNAs [Citation22]. The long noncoding transcriptome is often dysregulated in cancers, and some of these dysregulations are associated with malignant transformation [Citation23]. We identified the prognostic DElncRNAs associated with FAT2 mutations and constructed a 5-lncRNA prognostic signature of GC (RP11-248N22.1, FGF10-AS1, RP11-21C4.1, LINC01697, and RP11-248N22.1). One study showed that FGF10-AS1 was associated with the prognosis of triple-negative breast cancer patients, which is consistent with our research [Citation24]. The lncRNA FGF10‐AS1 may play a role in the development of many cancers. In addition, the lncRNA LINC01697 also showed good predictive performance in the diagnosis and prognosis of lung squamous cell carcinoma or oral squamous cell carcinoma [Citation25,Citation26]. The other lncRNAs in this model have not been reported in cancer and require further research.
The presence of an intricate interplay between protein-coding messenger RNAs and non-coding RNAs is becoming increasingly evident. A thorough understanding of this RNA crosstalk will contribute to a deeper understanding of cancer biology [Citation27]. In this study, we further analyzed the DEmRNAs associated with FAT2 mutations and constructed a 4-mRNA prognostic signature of GC (APOD, STK32A, SVEP1, NPTX1). Many studies have demonstrated that APOD expression is correlated with various tumors, such as breast cancer and colorectal cancer, and is significantly associated with GC risk assessment [Citation28–30]. STK32A participates in cellular homeostasis, cell-cycle modulation, and phosphorylation of transcription factors, and can modulate the invasion and metastasis of non-small cell lung cancer [Citation31]. NPTX1 was also found to be aberrantly expressed in multiple cancers and plays a crucial role in promoting metastasis in GC [Citation32]. These studies further confirmed the accuracy of our results.
To better understand RNA crosstalk, we analyzed the correlation between lncRNAs and mRNAs, and identified the most relevant RP11-21C4.1/SVEP1 gene pair. Previous studies have described that a significant proportion of lncRNAs originate from the divergent transcription of nearby protein-coding genes. These divergent lncRNA/mRNA gene pairs exhibit genomic juxtaposition and co-expression in transcription [Citation33]. The evidence described in prior research suggests that divergent lncRNAs can regulate the transcription of nearby genes. The biological function of these lncRNAs may be inferred from the role of their nearby protein-coding genes [Citation34]. Our results showed that RP11-21C4.1 and SVEP1 were coordinately downregulated in FAT2-mutant samples, suggesting that RP11-21C4.1 may act as a divergent lncRNA to regulate the transcription of SVEP1. To date, research on RP11-21C4.1 has not been reported. RP11-21C4.1 is a pseudogene, and there is substantial evidence that pseudogenes play important roles in the pathogenesis of cancer by regulating their parental or unrelated genes [Citation35]. Many studies have shown that pseudogenes associated with RP11 are correlated with the development of many cancers, including GC [Citation36]. The effects of RP11-21C4.1 on GC require further study. SVEP1 is involved in the regulation of intercellular adhesion, and its aberrant expression can induce hepatocellular carcinoma proliferation and metastasis [Citation37]. Further investigation is required to elucidate the regulation of SVEP1 expression in GC.
Conclusion
In this study, we constructed an RP11-21C4.1/SVEP1 gene pair prognostic signature associated with FAT2 mutations by using integrative genomics analysis. Our findings will improve our understanding of the potential biological functions of FAT2 mutations affecting the prognosis of GC.
Data Availability
The data of this study are available in the TCGA (https://portal.gdc.cancer.gov).
Supplemental Material
Download ()Disclosure statement
The authors have declared that no competing interest exists.
Supplementary material
Supplemental data for this article can be accessed here
Additional information
Funding
Related Research Data
References
- Jim MA, Pinheiro PS, Carreira H, et al. Stomach cancer survival in the United States by race and stage (2001-2009): findings from the CONCORD-2 study. Cancer. 2017;123(Suppl 24):4994–5013.
- Salati M, Orsi G, Smyth E, et al. Gastric cancer: translating novels concepts into clinical practice. Cancer Treat Rev. 2019;79:101889.
- Hanahan D, Weinberg RA. Hallmarks of cancer: the next generation. Cell. 2011;144(5):646–674.
- Yang SR, Schultheis AM, Yu H, et al. Precision medicine in non-small cell lung cancer: current applications and future directions. Semin Cancer Biol. 2020. in-print.
- Bailey AM, Mao Y, Zeng J, et al. Implementation of biomarker-driven cancer therapy: existing tools and remaining gaps. Discov Med. 2014;17(92):101–114.
- Katoh M. Function and cancer genomics of FAT family genes (review). Int J Oncol. 2012;41(6):1913–1918.
- Tate G, Kishimoto K, Mitsuya T. A novel mutation of the FAT2 gene in spinal meningioma. Oncol Lett. 2016;12(5):3393–3396.
- Miyanaga A, Masuda M, Tsuta K, et al. Hippo pathway gene mutations in malignant mesothelioma: revealed by RNA and targeted exon sequencing. J Thorac Oncol. 2015;10(5):844–851.
- Gao YB, Chen ZL, Li JG, et al. Genetic landscape of esophageal squamous cell carcinoma. Nat Genet. 2014;46(10):1097–1102.
- Xie T, Cho YB, Wang K, et al. Patterns of somatic alterations between matched primary and metastatic colorectal tumors characterized by whole-genome sequencing. Genomics. 2014;104(4):234–241.
- Matsui S, Utani A, Takahashi K, et al. Knockdown of Fat2 by siRNA inhibits the migration of human squamous carcinoma cells. J Dermatol Sci. 2008;51(3):207–210.
- Dang TT, Westcott JM, Maine EA, et al. ΔNp63α induces the expression of FAT2 and Slug to promote tumor invasion. Oncotarget. 2016;7(19):28592–28611.
- Li L, Fu LQ, Wang HJ, et al. FAT2 is a novel independent prognostic factor for the poor prognosis of gastric carcinoma. Int J Clin Exp Pathol. 2017;10(12):11603–11609.
- Kristensen VN, Lingjærde OC, Russnes HG, et al. Principles and methods of integrative genomic analyses in cancer. Nat Rev Cancer. 2014;14(5):299–313.
- Schmitt AM, Chang HY. Long Noncoding RNAs in Cancer Pathways. Cancer Cell. 2016;29(4):452–463.
- Zhang SY, Zhang SQ, Nagaraju GP, et al. Biomarkers for personalized medicine in GI cancers. Mol Aspects Med. 2015;45:14–27.
- Yang KS, Orcid I, Xu CQ, et al. Identification and validation of the prognostic value of cyclic GMP-AMP. Bioengineered. 2021;12(1):1238–1250.
- Ng PK, Li J, Jeong KJ, et al. Systematic Functional Annotation of Somatic Mutations in Cancer. Cancer Cell. 2018;33(3):450–462.e10.
- Takiar V, Ip CK, Gao M, et al. Neomorphic mutations create therapeutic challenges in cancer. Oncogene. 2017;36(12):1607–1618.
- Cho E, Feng Y, Rauskolb C, et al. Delineation of a Fat tumor suppressor pathway. Nat Genet. 2006;38(10):1142–1150.
- Qiao Y, Li T, Zheng S, et al. The Hippo pathway as a drug target in gastric cancer. Cancer Lett. 2018;420:14–25.
- Huarte M. The emerging role of lncRNAs in cancer. Nat Med. 2015;21(11):1253–1261.
- Gutschner T, Diederichs S. The hallmarks of cancer: a long non-coding RNA point of view. RNA Biol. 2012;9(6):703–719.
- Fan CN, Ma L, Liu N. Comprehensive analysis of novel three-long noncoding RNA signatures as a diagnostic and prognostic biomarkers of human triple-negative breast cancer. J Cell Biochem. 2019;120(3):3185–3196.
- Liu J, Yao Y, Hu Z, et al. Transcriptional profiling of long-intergenic noncoding RNAs in lung squamous cell carcinoma and its value in diagnosis and prognosis. Mol Genet Genomic Med. 2019;7(12):e994.
- Li Y, Cao X, Li H. Identification and Validation of Novel Long Non-coding RNA Biomarkers for Early Diagnosis of Oral Squamous Cell Carcinoma. Front Bioeng Biotechnol. 2020;8:256.
- Tay Y, Rinn J, Pandolfi PP. The multilayered complexity of ceRNA crosstalk and competition. Nature. 2014;505(7483):344–352.
- Bajo-Grañeras R, Crespo-Sanjuan J, García-Centeno RM, et al. Expression and potential role of apolipoprotein D on the death-survival balance of human colorectal cancer cells under oxidative stress conditions. Int J Colorectal Dis. 2013;28(6):751–766.
- Jankovic-Karasoulos T, Bianco-Miotto T, Butler MS, et al. Elevated levels of tumour apolipoprotein D independently predict poor outcome in breast cancer patients. Histopathology. 2020;76(7):976–987.
- Hu C, Zhou Y, Liu C, et al. A novel scoring system for gastric cancer risk assessment based on the expression of three CLIP4 DNA methylation-associated genes. Int J Oncol. 2018;53(2):633–643.
- Ma F, Xie Y, Lei Y, et al. The microRNA-130a-5p/RUNX2/STK32A network modulates tumor invasive and metastatic potential in non-small cell lung cancer. BMC Cancer. 2020;20(1):580.
- Yan H, Zheng C, Li Z, et al. NPTX1 promotes metastasis via integrin/FAK signaling in gastric cancer. Cancer Manag Res. 2019;11:3237–3251.
- Sigova AA, Mullen AC, Molinie B, et al. Divergent transcription of long noncoding RNA/mRNA gene pairs in embryonic stem cells. Proc Natl Acad Sci U S A. 2013;110(8):2876–2881.
- Luo S, Lu JY, Liu L, et al. Divergent lncRNAs Regulate Gene Expression and Lineage Differentiation in Pluripotent Cells. Cell Stem Cell. 2016;18(5):637–652.
- Hu X, Yang L, Mo YY. Role of Pseudogenes in Tumorigenesis. Cancers (Basel). 2018;10(8):256.
- Wang J, Huang F, Shi Y, et al. RP11-323N12.5 promotes the malignancy and immunosuppression of human gastric cancer by increasing YAP1 transcription. Gastric Cancer. 2020;24(1):85–102.
- Chen L, Liu D, Yi X, et al. The novel miR-1269b-regulated protein SVEP1 induces hepatocellular carcinoma proliferation and metastasis likely through the PI3K/Akt pathway. Cell Death Dis. 2020;11(5):320.