1,593
Views
9
CrossRef citations to date
0
Altmetric
Research Paper

Metabolism-related long non-coding RNAs (lncRNAs) as potential biomarkers for predicting risk of recurrence in breast cancer patients

, , & ORCID Icon
Pages 3726-3736 | Received 18 May 2021, Accepted 03 Jul 2021, Published online: 13 Jul 2021

ABSTRACT

Metabolism affects the development, progression, and prognosis of various cancers, including breast cancer (BC). Our aim was to develop a metabolism-related long non-coding RNA (lncRNA) signature to assess the prognosis of BC patients in order to optimize treatment. Metabolism-related genes between breast tumors and normal tissues were screened out, and Pearson correlation analysis was used to investigate metabolism-related lncRNAs. In total, five metabolism-related lncRNAs were enrolled to establish prognostic signatures. Kaplan-Meier plots and the receiver operating characteristic (ROC) curves demonstrated good performance in both training and validation groups. Further analysis demonstrated that the signature was an independent prognostic factor for BC. A nomogram incorporating risk score and tumor stage was then constructed to evaluate the 3 – and 5-year recurrence-free survival (RFS) in patients with BC. In conclusion, this study identified a metabolism-related lncRNA signature that can predict RFS of BC patients and established a prognostic nomogram that helps guide the individualized treatment of patients at different risks.
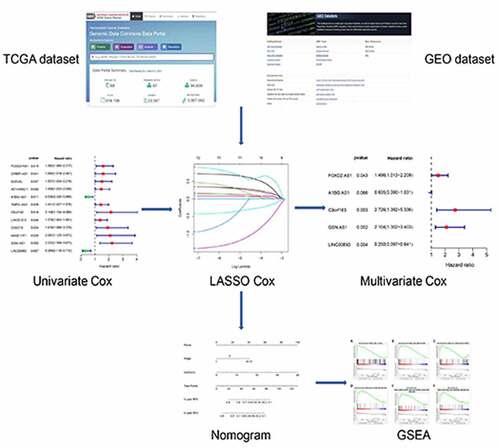
GRAPHICAL ABSTRACT

Introduction

Breast cancer (BC) is the most common malignancy in women and leads to cancer death among females worldwide [Citation1]. It is a heterogeneous disease which is mainly manifested in biological behavior, gene expression profiles, clinical prognosis, and therapeutic response, even at the same tumor stage [Citation2]. Although the overall survival rate of BC patients has greatly improved over the past decades, frequent drug resistance, recurrence, and metastasis are still the leading obstacles to current clinical treatment [Citation3]. However, currently used biomarkers have limited clinical value in predicting prognosis and metastatic recurrence. These features highlight the urgent need for the development and validation of novel prognostic signatures to accurately predict clinical outcomes of BC patients and provide guidance for personalized treatment.

Long non-coding RNAs (lncRNAs) represent a class of new and potent tumor regulator RNAs, with > 200 nucleotides and low protein-coding potential [Citation4]. Emerging evidence has suggested that lncRNAs can directly combine with DNA, RNA, or proteins to regulate gene expression in the form of RNA at various levels, thus resulting in the alteration of physiological and/or pathological processes, including cell cycle, differentiation, proliferation, apoptosis, transcriptional regulation, and carcinogenesis by modulating gene expression at the post-transcriptional level [Citation5,Citation6]. The competing endogenous RNA (ceRNA) hypothesis is based on a large-scale regulatory network system representing the complex cross-talk between coding and non-coding RNAs, and their interactions can be predicted using several tools [Citation7,Citation8]. lncRNAs have been proven to be oncogenic factors or tumor suppressors in the development of BC. For example, lncRNA BCRT1 promotes BC progression by targeting the miR-1303/PTBP3 axis [Citation9]. In contrast, lncRNA FGF14-AS2 has been identified as a tumor suppressor that suppresses BC metastasis by regulating the miR-370-3p/FGF14 axis [Citation10].

Energy metabolism reprogramming, which can promote rapid cell growth and proliferation, is an emerging hallmark of cancer [Citation11]. Several studies have reported that oncogenes and tumor suppressor genes such as PI3K [Citation12], MYC [Citation13], K-Ras [Citation14], BRCA1 [Citation15], and p53 [Citation16] can regulate metabolic pathways at multiple levels in different cellular compartments. For example, rewiring of metabolism induced by oncogenic K-Ras in cancer cells involves both glucose and glutamine utilization and sustains enhanced, unrestricted growth. Combination therapy with the glutaminase inhibitor CB-839 and PI3K/aldolase inhibitor NVP-BKM120 effectively reduce cell growth in tumor xenografts [Citation14]. Metabolic alterations are a feature of both treatment-naive and treatment-resistant BC. Therefore, understanding the mechanisms involved will allow us to identify potential tumor vulnerabilities for new therapeutic approaches. Accumulating evidence has confirmed the existence of crosstalk between lncRNAs and cellular metabolism in several types of cancer. Liu et al. [Citation17] revealed that lncRNA AGPG can regulate PFKFB3-mediated tumor glycolytic reprogramming. Another recent study [Citation18] indicated that lncRNA GLS-AS impairs GLS-mediated metabolism and inhibits malignant progression in pancreatic cancer. However, the actions of lncRNA-mediated metabolism in BC are not fully understood. Given the potential influence of lncRNAs and metabolism on the occurrence and development of BC, we sought to identify novel metabolism-related lncRNAs and construct prognostic signatures that are related to recurrence-free survival (RFS) in BC patients. This risk model will assist in understanding the molecular mechanisms underpinning BC and provide new ideas for metabolism-targeting therapies. First, metabolism-related lncRNAs were identified using Pearson correlation analysis. We established a metabolism-related lncRNA signature and genomic-clinicopathologic nomogram which can accurately evaluate individual prognostic markers in patients with BC. In summary, the current investigation may enable great progress in the exploration of prognostic metabolism-related lncRNAs and shed new insights into the possible mechanisms involved in BC development.

Materials and methods

Data sources and preprocessing

Data from The Cancer Genome Atlas (TCGA) and GTEx of breast cancer were acquired from the UCSC Xena Database (http://xena.ucsc.edu/), including 1,104 tumor samples and 292 normal samples. Samples with incomplete clinical data or a follow-up time of < 30 days were excluded. After the removal of patients lacking recurrence data, only 318 BC patients remained in TCGA cohort. Gene expression and clinical data of 241 BC patient samples from the Gene Expression Omnibus (GEO) database (GSE21653, https://www.ncbi.nlm.nih.gov/geo/) were used as a validation set. Metabolism-related gene sets were obtained from the Kyoto Encyclopedia of Genes and Genomes (KEGG) pathways database, which included 186 gene sets from the GSEA website (http://software.broadinstitute.org/gsea/downloads.jsp#msigdb). According to the criteria described in previously published articles (|Pearson R| > 0.4, p-value < 0.05), Pearson correlation analysis was used to identify metabolism-related lncRNAs [Citation19,Citation20].

Construction and validation of lncRNAs prognostic signature

Univariate Cox proportional hazards regression analysis was performed to screen metabolism-related lncRNAs significantly associated with patient RFS in the training set. A p-value < 0.05 was set as the cutoff criterion. To minimize the risk of over-fitting and to remove highly related genes, LASSO Cox regression was performed using the glmnet and survival package in R software [Citation21]. Multivariate Cox analysis was subsequently used to construct a prognostic signature. Risk scores were obtained based on a linear combination of the expression levels and weighted regression coefficients obtained by multivariate Cox analysis. Risk score = expression of gene1 × β1 + expression of gene2 × β2 +⋯+ expression of genen × βn. where β represents the coefficient value. All samples were grouped into low – and high-risk groups using the Survminer package in R software. Log-rank tests were performed to compare the prognostic outcomes between the two subgroups. Furthermore, receiver operating characteristic (ROC) analysis was applied to evaluate the predictive capability of the above signature using the SurvivalROC R package [Citation22]. Then, we performed principal component analysis (PCA) using the ‘prcomp’ function of the ‘stats’ R package.

Validation of metabolic signature

To validate the homogeneity of the established metabolism-related lncRNA signature, the GSE84437 dataset were used as a validation set. BC samples were assigned to low – and low-risk groups using the formula described above. Survival analysis and log-rank tests were performed to compare RFS between the two risk groups. The predictive ability of the prognostic signature was assessed using the time-dependent ROC curve.

Development and validation of a prognostic nomogram

To quantitatively estimate BC prognosis in clinical practice, a prognostic nomogram that integrated both the metabolism-related lncRNA signature and clinicopathological characteristics was generated based on the multivariate Cox regression model. The predictive ability of the nomogram was evaluated using calibration plots and the ROC curve for 3 – and 5-year RFS.

Gene Set Enrichment Analysis (GSEA)

To explore prognostic biomarkers involved in potential biological processes, GSEA was performed on the metabolism-related prognostic signature in the low – and high-risk groups. The classical gene set in the Molecular Signatures Database (MSigDB), ‘c2.cp.kegg.v7.0.symbols.gmt (curated)’ was considered. FDR < 0.25, and p-values < 0.05 were regarded as reference values.

Statistical analyses

All statistical analyses were performed using R v.4.0.4. Cox proportional hazard regression analysis was used to determine whether the metabolism-related lncRNA signature could be an independent prognostic indicator. Stratification analysis was conducted to further validate the prognostic performance of the metabolism-related lncRNA signature. Statistical significance was set at p < 0.05, unless otherwise noted. The nomogram created by the ‘Survival’ and ‘RMS’ packages of R v/3.6.3 was used to provide a visual risk prediction.

Results

Following in-depth studies of metabolic reprogramming, researchers have gradually realized the importance of fatty acid metabolism in BC. However, understanding of the association between lncRNAs and metabolism in BC is limited. In this study, we developed and validated a novel metabolism-related lncRNA signature and a nomogram integrating the signature and TNM stage for predicting individual survival among BC patients via the integrated analysis of TCGA and GEO datasets. Furthermore, using this signature and TNM staging, a nomogram was constructed to predict the 3 – and 5-year RFS of patients with BC. Hence, our study developed a metabolism-related lncRNA prognostic signature that could facilitate prognostic stratification in patients with BC and provide new ideas for metabolism-targeting therapies.

Identification of metabolism-related lncRNAs in BC

presents a flowchart of the data analysis steps involved in this study. First, we identified 13,361 lncRNAs and 19,318 mRNAs from the TCGA dataset, and obtained 945 metabolism-related genes from the gene set database of KEGG pathways. Pearson correlation analysis was performed on the expression values of these lncRNAs and metabolism-related genes to screen-out highly metabolism-related lncRNAs with |Pearson R| > 0.4, and p-values < 0.05. As a result, 1,887 metabolism-related lncRNAs were identified in the TCGA dataset. Consequently, 241 metabolism-related lncRNAs were selected by taking the intersection of the TCGA and GEO datasets (Supplementary ).

Table 1. Coefficients and multivariable Cox model results in breast cancer

Figure 1. Flow chart illustrating development of the metabolism-related lncRNA signature identified in this study

Figure 1. Flow chart illustrating development of the metabolism-related lncRNA signature identified in this study

Development and validation of lncRNAs prognostic signature

We performed univariate Cox regression, LASSO regression, and multivariate Cox regression analyses of 241 metabolism-related lncRNAs. A total of 12 prognostic genes related to RFS were selected from the metabolism-related lncRNAs using univariate Cox regression analyses (). Next, we conducted LASSO regression analysis, which identified 10 crucial lncRNAs ( and c). Then, multivariate Cox regression analysis was conducted, and five lncRNAs were finally selected to establish a prognostic signature (). Among the five lncRNAs, FOXD2-AS1, C9orf163, and GSN-AS1 were risk prognostic genes with HR > 1, while A1BG-AS1 and LINC00893 were protective genes with HR < 1 (). Then, a 5-lncRNA metabolic signature was built using the adjusted regression coefficients of each gene and associated risk scores. Risk scores (RSs) were calculated using the following formula: RS = (0.40292 × level of FOXD2-AS1) + (1.00278 × level of C9orf163) + (0.74405 × level of GSN-AS1) + (− −0.45489 × level of A1BG-AS1) + (−1.38691 × level of LINC00893). After scoring each patient’s risk through the signature, we divided the BC patients into low – and high-risk groups. The risk score distribution and survival status of the signature in the training set showed that the signature had a significant value for evaluating the prognosis of patients with BC ( and f). PCA analysis indicated discernible dimensions between the low – and high-risk patients (). Kaplan-Meier analysis demonstrated that patients in the high-risk group exhibited significantly poorer RFS than those in the low-risk cohort (). To further assess the model performance, the time-dependent ROC was mapped. The AUC values were approximately 0.735 for the training set ().

Figure 2. Development and evaluation of metabolism-related lncRNA signature related to RFS in TCGA cohort. (a) Forest plot of 12 candidate metabolism-related lncRNAs selected by univariate Cox regression analysis. (b) LASSO coefficient profiles of the 10 candidates. (c) Tenfold cross-validation for tuning parameter selection in the LASSO model. (d) Forest plot of 5 candidate metabolism-related lncRNAs selected by multivariate Cox regression analysis. (e) Patient survival status distribution by RS. (f) Patient survival status distribution of the low-risk group and the high-risk group. (g) PCA plot. (h) Kaplan-Meier method was used to plot the RFS curve for the high RS and low RS groups. (i) ROC curve of 5 lncRNA signatures

Figure 2. Development and evaluation of metabolism-related lncRNA signature related to RFS in TCGA cohort. (a) Forest plot of 12 candidate metabolism-related lncRNAs selected by univariate Cox regression analysis. (b) LASSO coefficient profiles of the 10 candidates. (c) Tenfold cross-validation for tuning parameter selection in the LASSO model. (d) Forest plot of 5 candidate metabolism-related lncRNAs selected by multivariate Cox regression analysis. (e) Patient survival status distribution by RS. (f) Patient survival status distribution of the low-risk group and the high-risk group. (g) PCA plot. (h) Kaplan-Meier method was used to plot the RFS curve for the high RS and low RS groups. (i) ROC curve of 5 lncRNA signatures

Validation of the metabolism-related signature

The GSE21653 dataset was separately used to determine the validity and robustness of the signature in an independent validation cohort (). We calculated the RS of the metabolism-related lncRNA prognostic signature for each patient in the validation set using the same formula. As expected, PCA analysis demonstrated that patients in the different risk groups were distributed in two directions (). Survival analysis indicated that the results of the Kaplan-Meier survival curve analysis were statistically significant (p < 0.05, ). Additionally, the AUC for RFS was 0.695 in the validation cohort, suggesting a favorable performance of the signature ().

Figure 3. Validation of metabolism-related lncRNA signature related to RFS in GEO cohort. (a) Patient survival status distribution by RS. (b) Patient survival status distribution of the low RS and the high RS. (c) PCA plot. (d) Kaplan-Meier method was used to plot the RFS curve for the high RS and low RS groups. (e) ROC curve of 5 lncRNAs signatures

Figure 3. Validation of metabolism-related lncRNA signature related to RFS in GEO cohort. (a) Patient survival status distribution by RS. (b) Patient survival status distribution of the low RS and the high RS. (c) PCA plot. (d) Kaplan-Meier method was used to plot the RFS curve for the high RS and low RS groups. (e) ROC curve of 5 lncRNAs signatures

Correlation between signature and clinicopathological characteristics

All patients were grouped according to their RS values to analyze any association between the metabolism-related signature and clinicopathological characteristics. The results revealed that there were distinct differences in the RSs between patients involving tumor stage, surgery type, and tumor status (p = 0.009, 0.04, < 0.001, respectively; Supplementary ). However, age (p = 0.43) and margin status (p = 0.33) were not significantly correlated with the RS.

Development of a nomogram for prognostic prediction

To determine whether the prognostic significance of the signature is dependent on clinicopathological parameters, univariate and multivariate Cox analyses were performed to analyze the following variables: RS, age, surgery type, margin status, and tumor stage ( and b). As shown in , of the univariate analysis, tumor stage and RS were significantly correlated with RFS of BC patients as well as the results of multivariate analysis (). To evaluate whether the metabolism-related lncRNA prognostic model could serve as a prognostic indicator for RFS in subgroups of patients with different clinical characteristics, we stratified subgroups by age (age ≤ 60 years and age > 60 years), pathological stage (stage I–II and stage III–IV), surgery type (lumpectomy, modified radical mastectomy, and others), and tumor status (tumor-free and tumor-positive). The results indicated that the RFS in low-risk patients based on age (p-value = 0.001 in ≤ 60 and p-value = 0.004 in > 60), pathological stage (p = 0.003 in stage I–II and p-value = 0.005 in stage III–IV), surgery type (p-value = 0.035 in lumpectomy, p-value = 0.041 in modified radical mastectomy, and p-value = 0.002 in other), and tumor status (p-value = 0.020 in tumor-free and p-value = 0.032 in with tumor) was significantly higher than those of high-risk patients (Supplementary ).

Figure 4. Identification of RFs and development of prognostic nomogram. (a) Univariate Cox regression analysis. (b) Multivariate Cox regression analysis. (c) Prognostic nomogram incorporating RFs for predicting the probability of 3 – and 5-year RFS in BC patients. (d) Time-dependent ROC for 3 – and 5-year RFS predictions of the nomogram. (e, f) Calibration curves for predicting 3 – and 5-year RFS. The nomogram-predicted probability of survival is plotted on the x-axis; actual survival is plotted on the y-axis

Figure 4. Identification of RFs and development of prognostic nomogram. (a) Univariate Cox regression analysis. (b) Multivariate Cox regression analysis. (c) Prognostic nomogram incorporating RFs for predicting the probability of 3 – and 5-year RFS in BC patients. (d) Time-dependent ROC for 3 – and 5-year RFS predictions of the nomogram. (e, f) Calibration curves for predicting 3 – and 5-year RFS. The nomogram-predicted probability of survival is plotted on the x-axis; actual survival is plotted on the y-axis

To provide surgeons with a quantitative tool for prognostic prediction in BC patients, we constructed a nomogram that integrated the RS based on the expression levels of five metabolism-related lncRNAs and tumor staging (). With the help of the nomogram, prognosis can be effectively predicted based on the individual characteristics of the patient. The nomogram was validated using ROC and calibration plots. The 3 – and 5-year AUC values of the nomogram for RFS were 0.774 and 0.745, respectively (). In addition, the calibration plots for the 3 – and 5-year RFS showed strong consistency between nomogram predictions and actual observations ( and f).

GSEA

According to the criteria of FDR < 0.25, and p < 0.05, 18 significantly altered pathways were enriched in the high-risk group of the signature, including the P53 signaling pathway, DNA replication, galactose metabolism, fructose and mannose metabolism, amino sugar and nucleotide sugar metabolism, pyrimidine metabolism, and other pathways ().

Figure 5. GSEA analysis of differentially expressed genes in high – and low-risk groups. GSEA implied remarkable enrichment of metabolism-related phenotypes in the high-risk group

Figure 5. GSEA analysis of differentially expressed genes in high – and low-risk groups. GSEA implied remarkable enrichment of metabolism-related phenotypes in the high-risk group

Discussion

Accurate prognostic prediction and individualized clinical treatment strategies are the basis of precision medicine [Citation23]. Most of the established clinical markers for treatment response and prognosis in BC are based on clinical features, and their accuracy and specificity are limited. Traditionally, AJCC TNM staging is mainly based on anatomical information and cannot adequately assess recurrence in patients with BC. Thus, it is of great urgency to explore the molecular mechanisms and to screen specific cancer-related biomarkers for risk evaluation that can be employed to predict the survival of BC patients and promote the development of effective therapies for BC. Following in-depth studies of metabolic reprogramming, researchers have gradually realized the importance of metabolism in BC [Citation24,Citation25]. However, metabolism-associated lncRNAs for predicting personalized survival are lacking. Given the potential influence of lncRNAs and metabolism on the occurrence and development of BC, the identification of novel metabolism-associated biomarkers might provide important prognostic information and novel therapeutic targets.

A recent study based on public databases established a tumor microenvironment-related signature model to predict the prognostic features of BC [Citation26]. However, metabolism-associated lncRNA signatures are lacking. In this study, we constructed and validated a novel metabolism-related lncRNA signature and a prognostic nomogram incorporating RSs and TNM staging for predicting individual survival among BC patients via the integrated analysis of TCGA and GEO datasets. First, we identified metabolism-related lncRNAs using Pearson’s correlation analysis. Univariate, LASSO, and multivariate Cox regression analyses were used to build a metabolism-related prognostic signature, which could be an independent prognostic factor for BC patients. This metabolism-related lncRNA prognostic model could serve as a prognostic indicator for RFS in subgroups of patients with different clinical characteristics. Patients with a low RS had superior RFS than those with a high RS. The predictability of the signature was confirmed by the tdROC curve, PCA analysis, and an independent GEO dataset. The GSEA results revealed that these metabolism-related lncRNAs are involved in many key biological functions related to tumor metabolic pathways. Furthermore, using this signature and TNM stage, we established a nomogram for predicting the 3 – and 5-year RFS of BC patients. The predictive ability of the model was validated by the discrimination and calibration curves. Hence, this study developed a metabolism-related lncRNA prognostic signature that could facilitate prognosis stratification in patients with BC and provide new ideas for metabolism-targeting therapies.

Accumulating evidence shows that lncRNAs also play irreplaceable roles in regulating metabolism in BC through different mechanisms. Ma et al. [Citation27] found that lncRNA FGF13-AS1 can inhibit glycolysis and the ‘stemness’ properties of BC cells. Mechanistically, FGF13-AS1 can reduce the half-life of MYC mRNA by binding to IGF2BPS and disrupting the interaction between IGF2BPS and MYC mRNA. In addition, MYC transcriptionally inhibits FGF13-AS1, forming an FGF13-AS1/IGF2BPs/Myc feedback loop in this signaling pathway. Du et al. [Citation28] revealed that lncRNA MIR210HG can promote the Warburg effect and tumor growth by enhancing HIF-1α translation in triple-negative BC. Li et al. [Citation29] demonstrated that lncRNA SNHG3 actively regulates PKM expression by acting as a miR-330-5p sponge, inhibiting mitochondrial oxidative phosphorylation, increasing glycolytic carboxylation, and enhancing the proliferation of BC cells. Surprisingly, in addition to FGF13-AS1, MIR210HG, and SNHG3 mentioned above, many of these lncRNAs have been shown to play important roles in metabolism [Citation30,Citation31].

Among the 5 lncRNA signatures identified in this study, 4 lncRNAs have been previously reported. A1BG-AS1 and C9orf163 have been shown to be immune-related lncRNAs and are associated with prognosis in patients with BC and pancreatic cancer, respectively, [Citation32,Citation33]. Robust evidence has shown that there is an intimate relationship between immunity and metabolism in cancer [Citation34,Citation35]. We speculate that A1BG-AS1 and C9orf163 may affect immunity in BC by regulating metabolism, although further experiments are required to verify such speculation. In addition, Bai et al. [Citation36] revealed that A1BG-AS1 functions as a tumor suppressor in hepatocellular carcinoma (HCC) and may promote tumorigenesis and progression through ceRNA-related mechanisms in HCC cells. Metabolic pathways such as glycolysis have distinct, essential roles in tumorigenicity and cancer progression [Citation14]. Wang et al. [Citation37] indicated by Pearson’s correlation analysis that FOXD2-AS1 is associated with glycolysis-related lncRNAs. However, the authors did not explore how FOXD2-AS1 affects the development and progression of BC by regulating metabolism. FOXD2-AS1 is also reported to be upregulated in tumor tissues and associated with poor prognosis in BC cases [Citation38,Citation39]. Knockdown of FOXD2-AS1 can inhibit the proliferation, migration, and invasiveness of BC cells and decrease the growth of transplanted tumors in vivo. FOXD2-AS1 promotes malignancy and tumorigenesis through different mechanisms, including the S100 calcium binding protein A1/Hippo signaling pathway and FOXD2-AS1/miR-150-5p/PFN2 axis [Citation38,Citation39]. Similarly, LINC00893 has been demonstrated to be expressed at low levels in thyroid cancer cells, which is consistent with our results. Overexpression of LINC00893 can inhibit the proliferation and migration of thyroid cancer cells by blocking the AKT pathway through PTEN upregulation [Citation40].

Study limitations

Certain limitations of the present study should be considered. First, due to the lack of standardized treatment strategies in the TCGA and GEO databases, the predictive accuracy of the model needs to be further confirmed using prospective multicenter randomized controlled trials. Second, the information from the TCGA database is limited and incomplete, which may reduce predictive accuracy of the model. Furthermore, the prognostic model in this study was constructed using bioinformatics analysis. Therefore, validation using cellular experiments and animal and tissue models warrants further investigation.

Conclusions

We identified a metabolism-related lncRNA signature that might act as an independent prognostic variable in patients with BC. Moreover, we established a prognostic nomogram incorporating the gene signature and tumor staging to predict the RFS of BC patients. This novel model may serve as a reliable and reproducible tool for prognostic prediction in individual BC cases.

Abbreviations

BC, breast cancer; lncRNA, long non-coding RNA; RFS, recurrence-free survival; TCGA, The Cancer Genome Atlas; GEO, Gene Expression Omnibus; KEGG, Kyoto Encyclopedia of Genes and Genomes; GSEA, gene set enrichment analysis; ROC, receiver operating characteristic; PCA, principal component analysis; MSigDB, Molecular Signatures Database; LASSO, least absolute shrinkage and selection operator; TNM, tumor-node-metastasis; HCC, hepatocellular carcinoma.

Availability of data and material

The datasets analyzed in this study were obtained from the TCGA database (http://www.cancer.gov/tcga) and GEO (https://www.ncbi.nlm.nih.gov/geo/query/acc.cgi?acc=GSE21653).

Author contributions

JYM and QL designed the study. JYM, SHL, and JC performed the experiments. JYM, SHL, JC, and QL analyzed the data. All authors contributed to writing the manuscript. All authors contributed to editorial changes involving the manuscript. All authors have read and approved the final manuscript.

Highlights

  1. Crosstalk between lncRNAs and metabolism has been confirmed in several types of cancer.

  2. A novel, robust and reliable metabolism-related lncRNA signature was established for recurrence of breast cancer.

  3. We also developed a prognostic nomogram using a combination of risk scores and clinicopathological variables.

  4. Our nomogram describes a novel quantitative signature for the risk of breast cancer recurrence.

Supplemental material

Supplemental Material

Download ()

Acknowledgements

We thank all the participants who were involved in this study and gratefully acknowledge contributions from TCGA and GEO Network.

Disclosure statement

The authors declare that the research was conducted in the absence of any commercial or financial relationships that could be construed as a potential conflict of interest.

Supplementary material

Supplemental data for this article can be accessed here

Additional information

Funding

The authors have no funding to report.

References

  • Bray F, Ferlay J, Soerjomataram I, et al. Global cancer statistics 2018: GLOBOCAN estimates of incidence and mortality worldwide for 36 cancers in 185 countries. CA Cancer J Clin. 2018;68(6):394–424.
  • Januškevičienė I, Petrikaitė V. Heterogeneity of breast cancer: the importance of interaction between different tumor cell populations. Life Sci. 2019;239:117009.
  • Yousefi H, Maheronnaghsh M, Molaei F, et al. Long noncoding RNAs and exosomal lncRNAs: classification, and mechanisms in breast cancer metastasis and drug resistance. Oncogene. 2020;39(5):953–974.
  • Huarte M. The emerging role of lncRNAs in cancer. Nat Med. 2015;21(11):1253–1261.
  • Sanchez Calle A, Kawamura Y, Yamamoto Y, et al. Emerging roles of long non-coding RNA in cancer. Cancer Sci. 2018;109(7):2093–2100.
  • Russo F, Fiscon G, Conte F, et al. Interplay between long noncoding RNAs and MicroRNAs in cancer. Methods Mol Biol. 2018;1819:75–92.
  • Salmena L, Poliseno L, Tay Y, et al. A ceRNA hypothesis: the rosetta stone of a hidden RNA language? Cell. 2011;146(3):353–358.
  • Fiscon G, Paci P, Iannello G. MONSTER v1.1: a tool to extract and search for RNA non-branching structures. BMC Genomics. 2015;16(S6):S1.
  • Liang Y, Song X, Li Y, et al. LncRNA BCRT1 promotes breast cancer progression by targeting miR-1303/PTBP3 axis. Mol Cancer. 2020;19(1):85.
  • Jin Y, Zhang M, Duan R, et al. Long noncoding RNA FGF14-AS2 inhibits breast cancer metastasis by regulating the miR-370-3p/FGF14 axis. Cell Death Discov. 2020;6(1):103.
  • Pavlova NN, Thompson CB. The emerging hallmarks of cancer metabolism. Cell Metab. 2016;23(1):27–47.
  • Lien EC, Lyssiotis CA, Cantley LC. Metabolic reprogramming by the PI3K-Akt-mTOR pathway in cancer. Recent Results Cancer Res. 2016;207:39–72.
  • Camarda R, Williams J, Goga A. In vivo reprogramming of cancer metabolism by MYC. Front Cell Dev Biol. 2017;5:35.
  • Gaglio D, Bonanomi M, Valtorta S, et al. Disruption of redox homeostasis for combinatorial drug efficacy in K-Ras tumors as revealed by metabolic connectivity profiling. Cancer Metab. 2020;8(1):22.
  • Koobotse M, Holly J, Perks C. Elucidating the novel BRCA1 function as a non-genomic metabolic restraint in ER-positive breast cancer cell lines. Oncotarget. 2018;9(71):33562–33576.
  • Wickramasekera NT, Das GM. Tumor suppressor p53 and estrogen receptors in nuclear-mitochondrial communication. Mitochondrion. 2014;16:26–37.
  • Liu J, Liu ZX, Wu QN, et al. Long noncoding RNA AGPG regulates PFKFB3-mediated tumor glycolytic reprogramming. Nat Commun. 2020;11(1):1507.
  • Deng SJ, Chen HY, Zeng Z, et al. Nutrient stress-dysregulated antisense lncRNA GLS-AS impairs GLS-mediated metabolism and represses pancreatic cancer progression. Cancer Res. 2019;79(7):1398–1412.
  • Hong W, Liang L, Gu Y, et al. Immune-related lncRNA to construct novel signature and predict the immune landscape of human hepatocellular carcinoma. Mol Ther Nucleic Acids. 2020;22:937–947.
  • Zhang Y, Zhang L, Xu Y, et al. Immune-related long noncoding RNA signature for predicting survival and immune checkpoint blockade in hepatocellular carcinoma. J Cell Physiol. 2020;235(12):9304–9316.
  • Simon N, Friedman J, Hastie T, et al. Regularization paths for cox’s proportional hazards model via coordinate descent. J Stat Softw. 2011;39(5):1–13.
  • Hanley JA, McNeil BJ. The meaning and use of the area under a receiver operating characteristic (ROC) curve. Radiology. 1982;143(1):29–36.
  • Arnedos M, Soria JC, Andre F, et al. Personalized treatments of cancer patients: a reality in daily practice, a costly dream or a shared vision of the future from the oncology community? Cancer Treat Rev. 2014;40(10):1192–1198.
  • Gandhi N, Das GM. Metabolic reprogramming in breast cancer and its therapeutic implications. Cells. 2019;2:89.
  • Dias AS, Almeida CR, Helguero LA, et al. Metabolic crosstalk in the breast cancer microenvironment. Eur J Cancer. 1990;2019(121):154–171.
  • Ye Q, Han X, Wu Z. Bioinformatics analysis to screen key prognostic genes in the breast cancer tumor microenvironment. Bioengineered. 2020;11(1):1280–1300.
  • Ma F, Liu X, Zhou S, et al. Long non-coding RNA FGF13-AS1 inhibits glycolysis and stemness properties of breast cancer cells through FGF13-AS1/IGF2BPs/Myc feedback loop. Cancer Lett. 2019;450:63–75.
  • Du Y, Wei N, Ma R, et al. Long noncoding RNA MIR210HG promotes the warburg effect and tumor growth by enhancing HIF-1α translation in triple-negative breast cancer. Front Oncol. 2020;10:580176.
  • Li Y, Zhao Z, Liu W, et al. SNHG3 functions as miRNA sponge to promote breast cancer cells growth through the metabolic reprogramming. Appl Biochem Biotechnol. 2020;191(3):1084–1099.
  • Zhang L, Fu Y, Guo H. c-myc-induced long non-coding RNA small nucleolar rna host gene 7 regulates glycolysis in breast cancer. J Breast Cancer. 2019;22(4):533–547.
  • Xing Z, Zhang Y, Liang K, et al. Expression of long noncoding RNA YIYA promotes glycolysis in breast cancer. Cancer Res. 2018;78(16):4524–4532.
  • Lai J, Chen B, Zhang G, et al. Molecular characterization of breast cancer: a potential novel immune-related lncRNAs signature. J Transl Med. 2020;18(1):416.
  • Zhuang H, Huang S, Zhou Z, et al. A four prognosis-associated lncRNAs (PALnc) based risk score system reflects immune cell infiltration and predicts patient survival in pancreatic cancer. Cancer Cell Int. 2020;20(1):493.
  • Rivadeneira DB, Delgoffe GM. Antitumor T-cell reconditioning: improving metabolic fitness for optimal cancer immunotherapy. Clin Cancer Res off J Am Assoc Cancer Res. 2018;24(11):2473–2481.
  • Shevchenko I, Bazhin AV. Metabolic checkpoints: Novel avenues for immunotherapy of cancer. Front Immunol. 2018;9:1816.
  • Bai J, Yao B, Wang L, et al. lncRNA A1BG-AS1 suppresses proliferation and invasion of hepatocellular carcinoma cells by targeting miR-216a-5p. J Cell Biochem. 2019;120(6):10310–10322.
  • Wang Y, Zhou W, Ma S, et al. Identification of a glycolysis-related LncRNA signature to predict survival in diffuse glioma patients. Front Oncol. 2020;10:597877.
  • Huang P, Xue J. Long non‑coding RNA FOXD2‑AS1 regulates the tumorigenesis and progression of breast cancer via the S100 calcium binding protein A1/Hippo signaling pathway. Int J Mol Med. 2020;46:1477–1489.
  • Jiang M, Qiu N, Xia H, et al. Long non‑coding RNA FOXD2‑AS1/miR‑150‑5p/PFN2 axis regulates breast cancer malignancy and tumorigenesis. Int J Oncol. 2019;54:1043–1052.
  • Li S, Zhang Y, Dong J, et al. LINC00893 inhibits papillary thyroid cancer by suppressing AKT pathway via stabilizing PTEN. Cancer Biomark. 2021;30(3):277–286.