
ABSTRACT
GDP dissociation inhibitor (GDI) regulates the GDP/GTP exchange reaction of most Rab proteins by inhibiting GDP dissociation. This study evaluated the potential prognostic and predictive value of GDI1 in colorectal cancer (CRC). To address the prognostic power of GDI1, we performed individual and pooled survival analyses on six independent CRC microarray gene expression datasets. GDI1-enriched signatures were also analyzed. Kaplan–Meier and Cox proportional analyses were employed for survival analysis. An immunohistochemistry (IHC) analysis was performed to validate the clinical relevance and prognostic significance of the GDI1 protein level in CRC tissue samples. The results revealed that GDI1 mRNA level was significantly linked with the aggressiveness of CRC, which is compatible with gene set enrichment analysis. A meta-analysis and pooled analysis demonstrated that a higher mRNA GDI1 expression was dramatically correlated with a worse survival in a dose-dependent manner in CRC patients. Further IHC analysis validated that the protein expression of GDI1 in both cytoplasm and membrane also significantly impacted the outcome of CRC patients. In CRC patients with stage III, chemotherapy significantly reduced the relative risk of death in low-GDI1 subgroup (hazard ratio (HR) = 0.22; 95% confidence interval (95% CI) 0.09–0.56, p = 0.0003), but not in high-GDI1 subgroup (HR = 0.63; 95% CI 0.35–1.14, p = 0.1137). Therefore, both high mRNA and protein levels of GDI1 were significantly related to poor outcomes in CRC patients. GD11 may serve as a prognostic biomarker for CRC.
Introduction
Colorectal cancer (CRC) has the third highest morbidity and the second highest mortality, accounting for 10% of all annually diagnosed cancers and cancer-related deaths both in the world [Citation1]. Genetic and environmental factors play a significant role in the development of CRC [Citation2–4]. The pathogenesis of CRC, either intrinsic or acquired, is multifactorial and multistep [Citation5,Citation6]. The outcome of CRC is associated with the stage at diagnosis, with a 5-year survival rate of 90% at early diagnosis and less than 10% when distant metastases develop [Citation7]. Therefore, it is critical to develop reliable biomarkers with the sound capability of predicting CRC metastasis. Various biomarkers have been proposed to predict CRC outcomes, such as MMP7 [Citation8], miR21, miR106a, miR135, miR17-92 [Citation9,Citation10] CK19, CK20, or Carcinoembryonic antigen (CEA) [Citation11,Citation12] miR29a and miR92a [Citation13], Cancer antigen 19–9 (CA 19–9) [Citation14–18]. However, few have been used to guide clinical CRC treatment [Citation19].
GDI1, one subtype of GDP dissociation inhibitors, regulates the GDP/GTP exchange reaction of Rab family. Small GTP-binding proteins of the ras superfamily are involved in the vesicular trafficking of molecules between cellular organelles. Studies have shown that Rab protein’s C-terminal region can bind to Rab GDP dissociation inhibitor (Rab GDI) nonspecificly [Citation20]. Meanwhile, Rab protein acts as a molecular switch of vesicle transport, and the key regulator of intracellular vesicle transport [Citation21–24]. It has been reported that Rab protein is closely related to the occurrence and development of some tumors [Citation25–27]. In contrast, Rab GDI2, as the other subtype of GDI, is expressed in all cancers, such as prostate cancer [Citation28], human NSCLC [Citation29] and breast cancer McF-7 cells treated with retinoic acid [Citation30]. Highly hemologic to GDI2, GDI1 gene is located in Xq28, also known as RABGDIA or XAP-4 [Citation31]. Rab GDI1 is mainly expressed in nervous and sensory tissues. Rab GDI reduces the expression of Rab3A, an active protein related to synaptic vesicles, in the brain tissues of schizophrenic patients [Citation32]. Previous studies have shown that GDI1 is associated with intellectual disability [Citation33], hyperexcitability [Citation34,Citation35] and memory formation in the forebrain region of mice [Citation36]. However, the role of GDI1 in tumors has not been reported.
We extracted six CRC datasets from the GEO (Gene Expression Omnibus) and TCGA (The Cancer Genome Atlas). Bioinformatics analysis was conducted on the microarray data of more than 1000 patients with CRC, and 10 related genes were screened out, including GDI1 that was then selected as the research object. Based on previous findings, we hypothesized that GDI1 might play an essential role(s) in tumorigenesis, growth, and chemosensitivity of CRC. This study aims to validate if GDI1 is associated with the aggressiveness and survival of CRC. Our goal is to develop GDI1 as a prognostic biomarker to predict the outcome of CRC patients.
Methods
Gene expression datasets
A total of 6 CRC gene expression datasets containing survival information was downloaded from the Array Express database (www.ebi.ac.uk/arrayexpress), including GSE39582, GSE38832, GSE29623, and GSE28722. Meanwhile, the datasets of TCGA-COAD1 and TCGA-COAD2 were downloaded from The Cancer Genome Atlas (TCGA)(www.cancergenome.nih.gov). These datasets were further used to evaluate the role of GDI1 in CRC prognosis. Detailed information on the gene expression datasets is summarized in Supplementary Table 1.
Gene set enrichment analysis
A gene set enrichment analysis (GSEA) was performed on the CRC microarray dataset, according to the protocol on the Broad Institute Gene Set Enrichment Analysis website (www.broad.mit.edu/gsea) or from related references [Citation37,Citation38]. Briefly, datasets and phenotype label files were created and loaded into GSEA software (v2.0.13). The gene sets were downloaded from the Gene Expression Omnibus GEO (http://www.cancergenome.nih.gov/geo). The phenotype labels were set as high-GDI1 and low-GDI1 in GSE39582 dataset. The number of permutations was set to 1000. A ranked-list metric was generated based on the signal-to-noise ratio calculated with the mean scaled difference according to the standard deviation (SD).
Patients
The Institutional Ethics Committees of Affiliated Huzhou Hospital, Zhejiang, approved the use of CRC patients’ data (No.20190517). Informed consent was given to the patients. In total, 133 CRC cases who had undergone surgical operations were collected. Inclusion criteria [Citation39]: (i) primary CRC; (ii) having pathological diagnosis; (iii) being followed up within 5 years. Exclusion criteria: (i) failing to get consent; (ii) lost to follow-up; and (iii) multiple-cancer patients. The distribution of demographic data is described in . All participants in the ZJU set were Chinese from the eastern part of China (Zhejiang).
Table 1. Demographic distribution of GDI1 in a pooled dataset of colon cancer
Table 2. Uni- and multivariate analysis for GDI1 and survival in CRC datasets
Table 3. Demographic distribution of colorectal cancers from ZJU set
Quantitative immunohistochemistry assays
Immunohistochemistry was done according to methods described previously [Citation40], unstained tissue microarray sections were deparaffinized and hydrated in xylene and graded ethanol solutions, then placed in Ethylene Diamine Tetraacetic Acid (EDTA) antigenic repair buffer (pH9.0) in a microwave oven for antigenic repair. The slides were blocked with 3% H2O2 for 30 min, 3% BSA for 30 min, and then incubated overnight at 4°C with anti-GDI1 primary antibody (1:1000, 66,434-1-ig, Proteintech, USA). The slides were probed with horseradish peroxidase-labeled polymer conjugated with corresponding antibodies for 50 min and DAB chromogenic program was conducted. Each slide was then counterstained with hematoxylin (GT100540, Gene).
We used the Aperio scanner (Aperio XT, LEICA), an automated imaging system, to obtain digital images of the stained sections for subsequent quantitative analyses. To reduce image reader bias, two independent investigators scored each sample in a double-blind manner. A joint review of investigators resolved discrepancies in scoring. Considering the heterogeneity of IHC staining, we displayed representative images of GDI1 expression in the cytoplasm and membrane in ). The subcellular localization (cytoplasm, nucleus, membrane), stain intensity (integrated absorption), or percentage of stained cells (the total area or portion of cells positive) were scored for each image. A rating scale organized scores as such: negative (-), weak positive (+-), positive (+), and strong positive (++) ()).
Based on the IHC staining distribution, we re-stratified cytoplasmic staining with ‘–’ or ‘+-’ as low-GDI1 cytoplasm, cytoplasmic staining ‘+’ or ‘++’ as high- GDI1 cytoplasm. For membrane staining, membranal staining ‘–’or ‘+-’ were regarded as low-GDI1 membrane and membranal staining ‘+’ or ‘++’ as high-GDI1 membrane.
Statistical analyses
All statistical analyses were performed on the SAS statistical software, version 9.2 (SAS Institution Inc., Cary, NC). Student's t-test and one-way ANOVA were used for continuous data. The Pearson and Likelihood Chi-square test was used for categorical data. Kaplan–Meier plot was used to display the proportion of live (overall survival) or cancer-free (disease-free survival and relapse-free survival) patients by the length of follow-up in months. Hazard ratios (HR) with 95% confidence intervals (CI) were calculated using Cox proportional hazards regression analysis to examine the association of GDI1 expression level with patient survival. Two-sided P-values of less than 0.05 were considered statistically significant.
The overall survival (OS) period was calculated as the time from initial surgery to the date when the patient was last seen. Only death from CRC was considered the end of the survival period. Disease-free survival (DFS) is defined as the time from initial surgery to tumor progression or relapse. All datasets were eligible for re-stratified GDI1 and other related genes. To normalize the mRNA expression levels among the above datasets, we re-stratified GDI1 scores into four levels (Q1, Q2, Q3, and Q4) based on the quartile value of each dataset. Values lower than the median were considered as low-GDI1, and values greater than or equal to median as high-GDI1. Cox analysis was performed on datasets using different and combined methods.
Results
To address our hypothesis that GDI1 may play essential roles in the aggressiveness of CRC, we investigated the relationships between mRNA expression of GDI1 and differentiation, proliferation, and invasion of CRC in six gene expression datasets, and the results indicated that GDI1 significantly enhanced the aggressiveness of CRC. Furthermore, outcome analyseis were performed to consistently demonstrated if mRNA expression of that GDI1 impacts was dramatically associated with poor survival of CRC patients. The prognostic meaning of GDI1 protein expression in cytoplasm and membrane was also validated in our collected CRC cohort by using IHC analysis. CRC patients in stage III whose GDI1 expression was low with chemotherapy have a high OS. Based on these findings, GDI1 may act as a potential prognostic biomarker in treating patients with CRC.
GDI1 expression is associated with the clinical features of colorectal cancer
The association between GDI1 expression and clinical features was assessed on downloaded human tissue gene expression datasets. Univariate analysis revealed that the expression of GDI1 was significantly related to age, tumor node metastasis (TNM) stage, and molecular subtype ( and ) (p < 0.05). Meanwhile, a Cox proportional hazard model further validated that age (≥50 yrs), advanced TNM stage, bigger tumor, lymph node involvement, metastasis, poor differentiation, and molecular subtype (C4) as the vital risk factors for poor prognosis (p < 0.05) (). Interestingly, GDI1 was overexpressed in the C4 molecular subtype of CRC, which has the poorest outcome (HR = 1.79, 95% 1.12–2.84, C4 vs C1, p = 0.02) ()). The results suggested that overexpression of GDI1 is associated with poor differentiation and aggressiveness of CRC.
Figure 1. Distribution of the GDI1 mRNA expression and aggressiveness of CRC
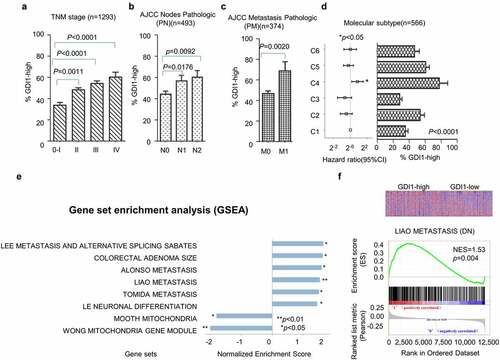
The representative results of the GSE39582 set analysis are shown in ). Six high-GDI1-enriched six gene signatures included Lee metastasis and alternative splicing Sabates, Colorectal adenoma size, Alonso Metastasis, Liao Metastasis, Tomida Metastasis, and Le Neuronal differentiation. Meanwhile, low-GDI1 was enriched in signatures of Mooth Mitochondria and Wong Mitochondria gene module. ) shows the GDI1-enriched LIAO METASTASIS. The normalized enrichment score (NES) was 1.53 (p = 0.004). Furthermore, the protein–protein interaction network of GDI1 was obtained from STRIG.ORG (S. ). These proteins were involved in cancer invasion (members of RAS oncogene family and Ras homolog family members), cell cycle regulation, neoplastic processes and inflammation (PAK2) [Citation41,Citation42], cellular proliferation, polarity, adhesion, and migration (CDC42) [Citation43], proliferation, signaling, secretion, cytoskeletal organization and proliferation (ARHGDIA and ARHGDIB) [Citation44] and others. Most of these proteins were related to cancer cell proliferation and invasion. The mRNA and protein expression levels of GDI1 might be related to the aggressiveness of CRC.
GDI1 is a potential prognostic factor in colorectal cancer.
We first used Cox proportional hazard analysis to estimate the HR of GDI1 in each CRC dataset. A meta-analysis was then employed to assess the overall prognostic value of GDI1 mRNA in these datasets (). It was suggested that high expression of GDI1 mRNA was significantly associated with a high relative risk of death and recurrence in CRC patients.
Figure 2. Survival analysis for GDI1 mRNA expression and outcome of CRC
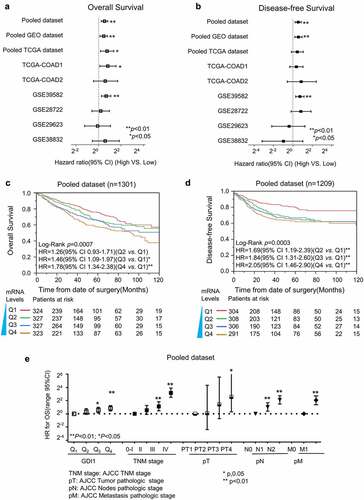
Survival analysis was conducted for each dataset using uni- and multi-covariate Cox proportional hazard analysis, and participants in each dataset were re-categorized into four subgroups (Q1, Q2, Q3, and Q4) according to the expression levels of GDI1. The results are listed in . Q1, the subgroup with the lowest expression, was set as the relative point of reference. Mostly, the HR of GDI1 for OS and PFS increased with its mRNA level. In the groups with higher GDI1 levels (e.g., Q4), the association was more significant in almost all datasets. The overall pooled analysis demonstrated that the HR of higher GDI1 (Q4) was 1.78 [95% confidence interval (CI): 1.34–2.38] for OS and 2.05 (95% CI: 1.46–2.90) for PFS.
) illustrates that the mRNA level of GDI1 is positively related to the OS and DFS of CRC patients. Like TNM stage, GDI1 level increases with the relative risk of death ().
Prognostic significance of GDI1 is validated in CRC human subjects
Immunohistochemistry analysis was performed on formalin fixed paraffin-embedded (FFPE) CRC tissues. We used the well-specificity GDI1 antibody, whose condition was optimized on a colorectal tissue assay. Since GDI1 is a secreted protein, the signals of IHC staining in the membrane and cytoplasm were scored separately. Representative IHC results of GDI1 are shown in .
Figure 3. Immunohistochemistry analysis for the protein expression of GDI1 in the cytoplasm and membrane
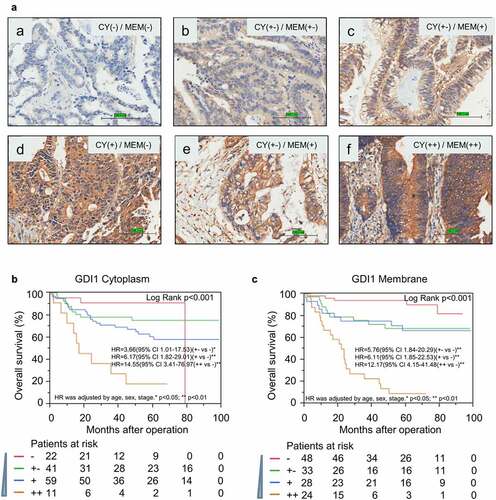
As shown in , the protein level of membrane GDI1 was significantly linked to distant metastasis and Dukes’ stage (p < 0.05). The protein level of cytoplasmic GDI1 was only related to β-Catenin positive expression (p < 0.05). Survival analysis further validated that protein levels of GDI1 in both cytoplasm and membrane were significantly associated with the outcome of CRC in the ZJU set (). A higher expression of GDI1 protein was related to a worse outcome of CRC, which is compatible with findings from GDI1 mRNA analysis.
Overexpression of GDI1 may be related to chemoresistance against CRC
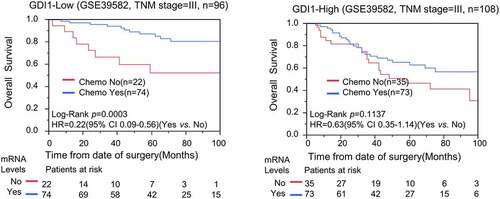
Chemotherapy is generally administered to patients with advanced stages of CRC. Here, we address whether the expression level of GDI1 is associated with the sensitivity of chemotherapy to CRC. To avoid the confounding effects of TNM stage, we only analyzed chemoresistance in patients with stage-III CRC. Kaplan–Meier and Cox analyses demonstrated that chemotherapy prolonged OS significantly in low-GDI1 subgroup (log-rank p = 0.0003; HR = 0.22; 95% CI: 0.09–0.56), but not in the high-GDI1 subgroup (log-rank p = 0.1137) (). Hence, our findings suggest that overexpression of GDI1 may be associated with chemoresistance against CRC.
Figure 4. Stratification analysis for GDI1 expression and chemotheresistance in CRC patients
Discussion
CRC is a common malignant tumor of the digestive system and a leading cause of cancer-related death worldwide [Citation45]. Despite the new treatment efforts, its prognosis is still poor, mainly due to the high rate of distant metastasis [Citation46,Citation47]. Therefore, effective biomarkers are in urgent need to improve the treatments of CRC. In the present study, we for the first time reported the prognostic value of GDI1 for CRC outcomes. We discovered the relationship of GDI1 with clinical factors and outcomes of CRC. The expression of GDI1 was associated with the stage of CRC ( and ). In particular, GDI1 expression was significantly related to CRC metastasis in Cox regression analyses and GSEA ( and ). Kaplan–Meier analysis confirmed that GDI1 expression had a negative impact on the survival of CRC patients (). Furthermore, the prognostic significance of GDI1 was validated using tissue samples. As GDI1 protein expression increased, the relative risk of death increased (). Heterogeneity and localization of GDI1 protein were also taken into consideration. Both cytoplasmic and membranal expressions of GDI1 were significantly related to the poor prognosis of CRC.
Our study is also more innovative and interesting in its subgroup analysis on the association between GDI1 expression and chemoresistance, compared to the simple analysis of the prognostic role of a certain gene [Citation37]. Our preliminary analysis demonstrated that chemotherapy could significantly reduce the risk of death in stage-III CRC patients with low-GDI1, but not in those with GDI1-high (). Potentially, GDI1 might serve as a predictive biomarker for stage III CRC. Meanwhile, it was implied that suppression of GDI1 might enhance the chemosensitivity of CRC.
One limitation of our study is that assays in vitro were not conducted to investigate whether GDI1 inhibition may decrease CRC cells’ proliferative and invasive ability. Due to insufficient CRC patients with stage III, the relationship between GDI1 expression and chemosensitivity could not be validated in a cohort. In addition, the mechanism of GDI1 in CRC progression and chemoresistance should be explored with more animal and clinical studies.
Conclusion
Overexpression of GDI1 is associated with the aggressiveness and poor outcomes of CRC. GDI1 can be used as a biomarker to predict CRC prognosis and design new treatment options.
Abbreviations
95% CI, 95% confidence interval; GSEA, gene set enrichment analysis; OS, overall survival; DFS, disease-free survival; CRC, colorectal cancer; HR, hazard ratio; IHC, immunohistochemistry; TNM, tumor node metastasis; ZJU, Zhejiang University; GDI, GDP dissociation inhibitor.
Author contributions
Xiao Xie wrote the manuscript; Huajiang Lin was in charge of figures and tables preparation; Xiaolei Zhang performed the IHC experiments; Pengtao Song and Xiangyi He scored samples of IHC; Jing Zhong conducted the bioinformatic analysis; Jiemin Shi supervised the project.
Supplemental Material
Download ()Disclosure statement
No potential conflict of interest was reported by the author(s).
Supplementary material
Supplemental data for this article can be accessed here.
Additional information
Funding
Related Research Data
References
- Bray F, Ferlay J, Soerjomataram I, et al. Global cancer statistics 2018: GLOBOCAN estimates of incidence and mortality worldwide for 36 cancers in 185 countries. CA Cancer J Clin. 2018;68(6):394–424.
- Lucas C, Barnich N, Nguyen HTT. Microbiota, Inflammation and colorectal cancer. Int J Mol Sci. 2017;18(6):1310.
- Yang J, Yu J. The association of diet, gut microbiota and colorectal cancer: what we eat may imply what we get. Protein Cell. 2018;9(5):474–487.
- Kerr J, Anderson C, Lippman SM. Physical activity, sedentary behaviour, diet, and cancer: an update and emerging new evidence. Lancet Oncol. 2017;18(8):e457–e471.
- Beaugerie L, Itzkowitz SH, Longo DL. Cancers complicating inflammatory bowel disease. N Engl J Med. 2015;372(15):1441–1452.
- Jia W, Xie G, Jia W. Bile acid-microbiota crosstalk in gastrointestinal inflammation and carcinogenesis. Nat Rev Gastroenterol Hepatol. 2018;15:111–128.
- Coppede F, Lopomo A, Spisni R, et al. Genetic and epigenetic biomarkers for diagnosis, prognosis and treatment of colorectal cancer. World J Gastroenterol. 2014;20(4):943–956. .
- Koga Y, Yasunaga M, Moriya Y, et al. Detection of colorectal cancer cells from feces using quantitative real-time RT-PCR for colorectal cancer diagnosis. Cancer Sci. 2008;99:1977–1983.
- Koga Y, Yasunaga M, Takahashi A, et al. MicroRNA expression profiling of exfoliated colonocytes isolated from feces for colorectal cancer screening. Cancer Prev Res (Phila). 2010;3(11):1435–1442. .
- Link A, Balaguer F, Shen Y, et al. Fecal MicroRNAs as novel biomarkers for colon cancer screening. Cancer Epidemiol Biomarkers Prev. 2010;19(7):1766–1774. .
- Wang JY, Wu CH, Lu CY, et al. Molecular detection of circulating tumor cells in the peripheral blood of patients with colorectal cancer using RT-PCR: significance of the prediction of postoperative metastasis. World J Surg. 2006;30(6):1007–1013. .
- Shen C, Hu L, Xia L, et al. Quantitative real-time RT-PCR detection for survivin, CK20 and CEA in peripheral blood of colorectal cancer patients. Jpn J Clin Oncol. 2008;38(11):770–776. .
- Huang Z, Huang D, Ni S, et al. Plasma microRNAs are promising novel biomarkers for early detection of colorectal cancer. Int J Cancer. 2010;127(1):118–126. .
- Lech G, Słotwiński R, Słodkowski M, et al. Colorectal cancer tumour markers and biomarkers: recent therapeutic advances. World J Gastroenterol. 2016;22(5):1745–1755. .
- Labianca R, Nordlinger B, Beretta GD, et al. Primary colon cancer: ESMO Clinical Practice Guidelines for diagnosis, adjuvant treatment and follow-up. Ann Oncol. 2010;21(Suppl 5):v70–77. .
- Locker GY, Hamilton S, Harris J, et al. ASCO 2006 update of recommendations for the use of tumor markers in gastrointestinal cancer. J Clin Oncol. 2006;24(33):5313–5327. .
- Nicolini A, Ferrari P, Duffy MJ, et al. Intensive risk-adjusted follow-up with the CEA, TPA, CA19.9, and CA72.4 tumor marker panel and abdominal ultrasonography to diagnose operable colorectal cancer recurrences: effect on survival. Arch Surg. 2010;145(12):1177–1183. .
- Carpelan-Holmström M, Louhimo J, Stenman UH, et al. CEA, CA 242, CA 19-9, CA 72-4 and hCGβ in the diagnosis of recurrent colorectal cancer. Tumour Biol. 2004;25(5–6):228–234. .
- Jacob S, Ng W, Asghari R, et al. Chemotherapy in rectal cancer: variation in utilization and development of an evidence-based benchmark rate of optimal chemotherapy utilization. Clin Colorectal Cancer. 2011;10(2):102–107. .
- Muller MP, Goody RS. Molecular control of Rab activity by GEFs, GAPs and GDI. Small GTPases. 2018;9(1–2):5–21.
- Hutagalung AH, Novick PJ. Role of Rab GTPases in membrane traffic and cell physiology. Physiol Rev. 2011;91(1):119–149.
- Lamber EP, Siedenburg AC, Barr FA. Rab regulation by GEFs and GAPs during membrane traffic. Curr Opin Cell Biol. 2019;59:34–39.
- Takai YST, Matozakin T, Matozaki T. Small GTP -binding proteins. Physiol Rev. 2001;81(1):153–208.
- Stenmark H. Rab GTPases as coordinators of vesicle traffic. Nat Rev Mol Cell Biol. 2009;10(8):513–525.
- Wheeler DZR, Root DE. Identification of an Oncogenic RAB protein Science. 2015;350:211–217. Identification of an Oncogenic RAB prorein.
- Ge J, Ge C. Rab14 overexpression regulates gemcitabine sensitivity through regulation of Bcl-2 and mitochondrial function in pancreatic cancer. Virchows Arch. 2019;474(1):59–69.
- Driehuis E, Clevers H. WNT signalling events near the cell membrane and their pharmacological targeting for the treatment of cancer. Br J Pharmacol. 2017;174(24):4547–4563.
- Xu DD, Xu CB, Lam HM, et al. Proteomic analysis reveals that pheophorbide a-mediated photodynamic treatment inhibits prostate cancer growth by hampering GDP-GTP exchange of ras-family proteins. Photodiagnosis Photodyn Ther. 2018;23:35–39.
- Ming Z, Guo C, Jiang M, et al. Bioinformatics analysis of Rab GDP dissociation inhibitor beta and its expression in non-small cell lung cancer. Diagn Pathol. 2014;9(1):201. .
- Kamal AH, Han BS, Choi JS, et al. Proteomic analysis of the effect of retinoic acids on the human breast cancer cell line MCF-7. Mol Biol Rep. 2014;41(5):3499–3507.
- Wan M, Francke U. Evaluation of two X chromosomal candidate genes for Rett syndrome: glutamate dehydrogenase-2 (GLUD2) and rab GDP-dissociation inhibitor (GDI1). Am J Med Genet. 1998;78(2):169–172.
- Orlando R, Borro M, Motolese M, et al. Levels of the Rab GDP dissociation inhibitor (GDI) are altered in the prenatal restrain stress mouse model of schizophrenia and are differentially regulated by the mGlu2/3 receptor agonists, LY379268 and LY354740. Neuropharmacology. 2014;86:133–144.
- Duan Y, Lin S, Xie L, et al. Exome sequencing identifies a novel mutation of the GDI1 gene in a Chinese non-syndromic X-linked intellectual disability family. Genet Mol Biol. 2017;40(3):591–596.
- Ishizaki H, Miyoshi J, Kamiya H, et al. Role of rab GDP dissociation inhibitor alpha in regulating plasticity of hippocampal neurotransmission. Proc Natl Acad Sci U S A. 2000;97(21):11587–11592.
- D’adamo P, Masetti M, Bianchi V, et al. RAB GTPases and RAB-interacting proteins and their role in the control of cognitive functions. Neurosci Biobehav Rev. 2014;46(Pt 2):302–314. .
- Bianchi V, Gambino F, Muzio L, et al. Forebrain deletion of αGDI in adult mice worsens the pre-synaptic deficit at cortico-lateral amygdala synaptic connections. PLoS One. 2012;7(1):e29763. .
- Chen S, Wei Y, Liu H, et al. Analysis of Collagen type X alpha 1 (COL10A1) expression and prognostic significance in gastric cancer based on bioinformatics. Bioengineered. 2021;12(1):127–137.
- Subramanian A, Tamayo P, Mootha VK, et al. Gene set enrichment analysis: a knowledge-based approach for interpreting genome-wide expression profiles. Proc Natl Acad Sci U S A. 2005;102(43):15545–15550.
- Liu X, Zhang H, Lai L, et al. Ribonucleotide reductase small subunit M2 serves as a prognostic biomarker and predicts poor survival of colorectal cancers. Clin Sci (Lond). 2013;124(9):567–578.
- Ma Y, Xin Y, Li R, et al. TFDP3 was expressed in coordination with E2F1 to inhibit E2F1-mediated apoptosis in prostate cancer. Gene. 2014;537(2):253–259.
- Rane CK, Minden A. P21 activated kinases: structure, regulation, and functions. Small GTPases. 2014;5.
- Zhao ZS, Manser E. PAK family kinases: physiological roles and regulation. Cell Logist. 2012;2(2):59–68.
- Cotteret S, Chernoff J. The evolutionary history of effectors downstream of Cdc42 and Rac. Genome Biol. 2002;3(2). Reviews0002.
- Moon SY, Zheng Y. Rho GTPase-activating proteins in cell regulation. Trends Cell Biol. 2003;13(1):13–22.
- Suzuki H, Yamamoto E, Yamano HO, et al. Integrated Analysis of the endoscopic, pathological and molecular characteristics of colorectal tumorigenesis. Digestion. 2019;99(1):33–38. .
- Koliaraki V, Pallangyo CK, Greten FR, et al. Mesenchymal Cells in Colon Cancer. Gastroenterology. 2017;152(5):964–979. .
- Fang L, Lu W, Choi HH, et al. ERK2-Dependent phosphorylation of CSN6 is critical in colorectal cancer development. Cancer Cell. 2015;28(2):183–197.