
ABSTRACT
Gliomas account for the highest cases of primary brain malignancies. Whereas previous studies have demonstrated the roles of CDC28 Protein Kinase Regulatory Subunit 2 (CKS2) in various cancer types, its functions in lower grade gliomas (LGGs) remain elusive. This study aimed to profile the expression and functions of CKS2 in LGG. Multiple online databases such as The Cancer Genome Atlas (TCGA), the Chinese Glioma Genome Atlas (CGGA), Gene Expression Profiling Interactive Analysis 2nd edition (GEPIA2), Tumor Immune Estimation Resource 2nd edition (TIMER2.0) as well as Gene Expression Omnibus (GEO) were used in this study. Immunohistochemistry (IHC) was performed to evaluate CKS2 protein expression. Our data demonstrated upregulation of CKS2 in LGG tissues at both mRNA and protein level, especially in grade III gliomas. Similarly, there was increased expression of CKS2 in isocitrate dehydrogenase 1 (IDH1) wildtype gliomas. In addition, increased DNA copy number and DNA hypomethylation might be associated with the upregulation of the CKS2 in LGG. Using the Kaplan–Meier survival analysis and the Cox regression analysis, CKS2 was shown to be independently associated with poor prognosis of LGG patients. Receiver operating characteristic (ROC) analysis revealed that CKS2 could effectively predict the 1-, 3- and 5-year survival rates of LGG patients. Enrichment analyses revealed that CKS2 was mainly involved in the regulation of the cell cycle in LGG. Taken together, our study demonstrated that CKS2 might be a candidate prognostic biomarker for LGG and could predict the survival rates of LGG patients.
Abbreviations: LGG: lower grade glioma; CKS2: CDC28 protein kinase regulatory subunit 2; TCGA: The Cancer Genome Atlas; CGGA: the Chinese Glioma Genome Atlas; GEO: Gene Expression Omnibus; GEPIA: Gene Expression Profiling Interactive Analysis; TIMER: Tumor Immune Estimation Resource; IHC: immunohistochemistry; qRT-PCR: quantitative real-time polymerase chain reaction; PBS: phosphate buffered saline; DAB: diaminobenzidine tetrachloride; OS: overall survival; CAN: copy number alteration; IDH: Isocitrate dehydrogenase; GSEA: Gene Set Enrichment Analysis; DEG: differentially expressed gene; KEGG: Kyoto encyclopedia of genes and genomes; GO: Gene ontology; BP: biological process; CC: cellular component; MF: molecular function; NES: normalized enrichment score; NOM: nominal; FDR: false discovery rate
Introduction
The 2016 World Health Organization (WHO) Classification of Tumors of the Central Nervous System proposed a new classification method for glioma. The classification combined molecular characteristics and histology, which then categorized grade II and grade III gliomas as well as grade IV glioblastomas (GBMs) as diffuse gliomas [Citation1]. Because of convergence of many features of the grade II and grade III gliomas, they are collectively referred to as lower grade gliomas (LGGs) [Citation2]. Although patients with LGG have better prognostic outcomes compared to those with glioblastomas, they still have chances of progressing to higher grade gliomas [Citation3]. LGGs have highly heterogeneous clinical features. Whereas some LGGs are not active, other could quickly develop into glioblastomas. As a result, their prognostic outcomes are diverse, thus patients with LGG have a wide range of survival periods [Citation4]. Due to the wide prognostic spectrum of the LGG patients, there is need to accurately predict survival outcomes.
CDC28 protein kinase regulatory subunit 2 (CKS2) belongs to the human CKS family, which plays an indispensable role in early embryonic development, somatic cell division as well as meiosis [Citation5,Citation6]. CKS2 has been well investigated in many human cancer types. The previous studies showed that CKS2 mediates the occurrence and development of many malignancies, especially hepatocellular carcinoma and breast cancer [Citation7–11]. Besides, knockdown of the CKS2 gene has been shown to downregulate the expression of Cyclin A and Cyclin B1 [Citation12]. Interestingly, previous researches using quantitative real-time polymerase chain reaction (qRT-PCR) technique showed that CKS2 mRNA was overexpressed in glioblastomas, and might be involved in the pathogenesis of glioblastomas [Citation13,Citation14]. However, immunohistochemistry study to evaluate the CKS2 protein expression in gliomas has not been done so far, and the role of CKS2 in LGG is yet to be defined as well.
We hypothesized that CKS2 was overexpressed in LGG tissues, further leads to the poor prognosis of LGG patients, affecting some pathways in vivo. This study aimed to profile the expression and functions of CKS2 in LGG. Here, we interrogated the expression profile of the CKS2 gene in LGG using both bioinformatics and immunohistochemistry assays. Besides, we assessed the prognostic value as well as the functions of the CKS2 in LGG. Our findings showed that CKS2 might serve as a reliable prognostic biomarker of LGG patients.
Materials and methods
Online data acquisition
The RNA-sequencing profile and corresponding clinical information of the LGG patients in the TCGA (The Cancer Genome Atlas) database was obtained from UCSC Xena browser (http://xena.ucsc.edu/public/) [Citation15], which contained 529 samples of LGG. We matched each sample with its CKS2 expression, and then excluded data that lacked complete survival outcomes. After the screening, a total of 506 patients were classified as TCGA-LGG cohort (Supplementary Table 1) and used for survival and Cox regression analyses. We also used the Chinese Glioma Genome Atlas (CGGA, http://www.cgga.org.cn/index.jsp) database which contained multiple datasets of gliomas, and selected mRNAseq_325 dataset for further analyses [Citation16,Citation17]. The mRNAseq_325 dataset had a total of 182 LGG samples (103 WHO grade II gliomas and 79 WHO grade III gliomas). Similarly, samples with incomplete survival information were excluded and remained 172 patients in the CGGA cohort (Supplementary Table 2). Since there were no adjacent non-tumor brain tissues in the TCGA database, we applied the function ‘Expression DIY’ of GEPIA2 (Gene Expression Profiling Interactive Analysis 2nd edition, http://gepia2.cancer-pku.cn/) to conduct differential expression analysis between tumor samples from the TCGA database and normal samples from GTEx (Genotype-Tissue Expression) database [Citation18]. In addition, we used two GEO (Gene Expression Omnibus, https://www.ncbi.nlm.nih.gov/geo/) datasets; GSE4290 [Citation19] and GSE16011 [Citation20] in the differential expression analysis (, Supplementary Table 3). Besides, data on CKS2 methylation and its copy number alterations in the TCGA database (Supplementary Table 4) was downloaded from cBioPortal web server (https://www.cbioportal.org/study/summary?id=lgg_tcga) [Citation21].
Table 1. Details of the two GEO datasets used in this study
Patient samples
46 LGG samples (24 for grade II, 22 for grade III) and 26 paired non-tumor tissues from patients who were pathologically diagnosed with lower grade gliomas between 2013 and 2019 were obtained from the Second Affiliated Hospital of Zhengzhou University. The samples were subjected to immunohistochemistry (IHC) assays. This study was approved by the Ethics Committees of the Second Affiliated Hospital of Zhengzhou University (number: 2021313).
Immunohistochemistry
The sections were placed in an oven at 56°C for 1 hour to melt the paraffin and prevent the tissues from shedding, prior to dewaxing. The paraffin was removed with xylene and alcohol and then the sections were placed in sodium citrate buffer (pH 6.0) for repair. The sections were repaired in a pressure cooker for 5 minutes, cooled to room temperature, and then rinsed in phosphate buffered saline (PBS) for 3 times. The sections were placed in 3% hydrogen peroxide solution and incubated for 5 minutes at room temperature to inactivate endogenous peroxidase in the tissues. The sections were incubated with anti-CKS2 primary antibody (1:100, Abcam, ab155078, US) at 4°C overnight. Next, the sections were incubated with secondary antibody for 1 hour, and then washed 3 times in PBS, for 5 minutes each. Thereafter, diaminobenzidine tetrachloride (DAB) was added and then rinsed after satisfactory color development. We then stained the sections with hematoxylin and covered them with cover slips. The IHC results were independently evaluated by two experienced pathologists. The semi-quantitative scores were evaluated based on the percentage of positive cells: (1) 0 (<5%); 1 (5%–25%); 2 (26%–50%); 3 (51%–75%), 4 (>75%); and staining intensity: (2) 0 (negative); 1 (weakly positive); 2 (moderately positive); 3 (strongly positive). The two scores were multiplied and then used as the final IHC score [Citation22].
Bioinformatic analysis
Based on the median expression value of CKS2, we divided the TCGA-LGG cohort and CGGA cohort into low and high CKS2 expression groups, respectively. Kaplan–Meier analysis was used to explore the impact of CKS2 expression on the survival of the LGG patients. On the other hand, we conducted Multivariable Cox regression analysis to assess the potential independent prognostic value of CKS2 in LGG. Besides, time-dependent ROC (receiver operating characteristic) curves were generated to evaluate the effectiveness of CKS2 and other classic indicators in predicting 1-, 3-, and 5-year survival rates through R packages ‘survivalROC’ and ‘ggplot2’. In addition, we applied Gene_Mutation module in TIMER2.0 database to compare the differential expression of CKS2 between different IDH1 mutation status [Citation23].
Enrichment analyses
We identified the differentially expressed genes (DEGs) (|log Fold Change (FC)|>1, adjusted p value<0.05) between the high and low CKS2 expression groups as classified by the median expression of the CKS2 gene in the TCGA database, and displayed the DEGs in heatmap. Using the DEGs, we performed Gene ontology (GO) and Kyoto encyclopedia of genes and genomes (KEGG) analysis. The threshold for the GO and KEGG enrichment analysis was p < 0.05 and q < 0.05. The results were generated and visualized in R packages ‘clusterProfiler, org.Hs.eg.db, enrichplot and ggplot2’ [Citation24].
Gene Set Enrichment Analysis (GSEA) was carried out between low and high CKS2 expression groups in the TCGA database in order to evaluated the potential signaling pathways and biological functions related to CKS2 in LGG using GSEA 4.0.3 software (Massachusetts Institute of Technology, Cambridge, MA, USA) [Citation25]. H.all.v7.4.symbols.gmt was selected as the reference gene set in the GSEA. The significantly enriched signaling pathways were screened out based on the calculated nominal (NOM) p-value, false discovery rate (FDR) q-value and normalized enrichment score (NES) in each pathway. We visualized the results through R packages ‘ggplot2, plyr, grid and gridExtra’ [Citation26].
Statistical analysis
Wilcoxon test was used to compare the expression of CKS2 among the two groups. The association between CKS2 expression and multiple clinicopathological parameters were analyzed using Pearson chi-square test. In addition, we performed the log-rank test to evaluate the significance of the difference in survival curves. A P value of less than 0.05 was considered statistically significant. All the analyses were performed in R 4.0.3 software (R Development Core Team, Vienna, Austria), SPSS 22.0 software (IBM Corp., Armonk, NY, USA) and GraphPad Prism 7.0 software (GraphPad Software Inc., La Jolla, CA, USA).
Results
We hypothesized that CKS2 was upregulated in lower grade gliomas, especially in grade III gliomas, further leads to the poor prognosis of patients. Our goal was to profile the expression and functions of CKS2 in lower grade gliomas. Through bioinformatic analysis and immunohistochemistry, our work demonstrated the association between the CKS2 gene overexpression and poor prognosis of patients. Enrichment analyses showed that the upregulation of CKS2 might be involved in the progression of lower grade gliomas through multiple pathways. We showed that CKS2 could be a prognostic biomarker and might be a potential therapeutic target in lower grade gliomas.
The difference in CKS2 expression in lower grade gliomas
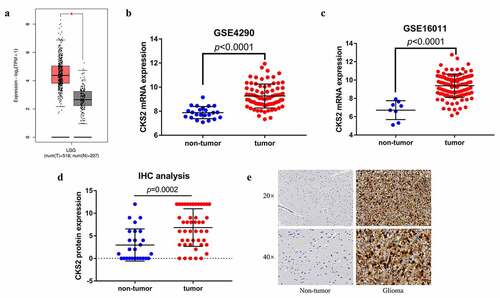
Multiple databases and immunohistochemistry (IHC) were used to determine the expression of CKS2 in lower grade gliomas and normal brain tissues at both mRNA and protein level. Our GEPIA2 data showed that CKS2 mRNA expression was higher in LGG tissues compared to that in normal brain tissues (p < 0.05, . To validate this result, we used two GEO datasets; GSE4290 and GSE16011 for differential analysis, which contained 23 and 8 matched normal brain samples, respectively. CKS2 mRNA was highly expressed in LGG tissues in the two datasets as well (all p < 0.0001) (). In addition, we conducted the IHC analysis and demonstrated that CKS2 protein expression was higher in LGG tissues than in normal brain tissues (p < 0.05, ).
Figure 1. The differential expression of CKS2 in LGG tissues and non-tumor tissues. (a-c) Differential expression of CKS2 mRNA in LGG tissues and normal brain tissues in GEPIA2, GSE4290 and GSE16011 (*P < 0.05). (d) Differential expression of CKS2 protein in LGG tissues and adjacent normal brain tissues. (e) Representative images of the CKS2 protein expression in LGG tissues and adjacent normal brain tissues
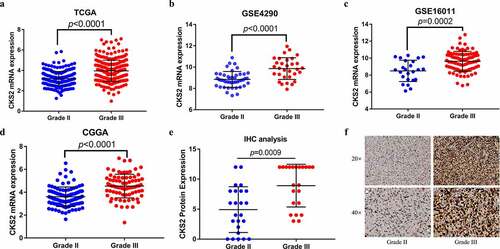
To explore the differential CKS2 expression in grade II and grade III gliomas, we analyzed the TCGA, GSE4290, GSE16011 and CGGA datasets. The data showed significant upregulation of the CKS2 mRNA expression in grade III gliomas compared to grade II gliomas (all p < 0.001, –(d)). In addition, IHC validated the results at the protein level (p = 0.0009, ).
Figure 2. The differential expression of CKS2 in grade II and grade III gliomas. (a-d) Differential expression of CKS2 mRNA in grade II and grade III gliomas in TCGA, GSE4290, GSE16011 and CGGA. (e) Differential expression of CKS2 protein in grade II and grade III gliomas. (d) Representative images of the CKS2 protein expression in grade II and grade III gliomas
CKS2 was upregulated in IDH1 wild-type lower grade gliomas
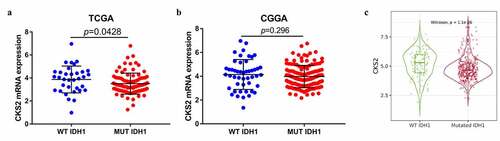
Compared with IDH1-wildtype, IDH1-mutation was more frequently observed in LGG. Whereas IDH1-mutation is a marker for better survival of LGG patients, IDH1-wildtype predicts worse survival [Citation1]. We assessed the correlation between CKS2 expression and IDH1 mutation status. CKS2 was upregulated in IDH1-wildtype group in the TGGA database (p = 0.0428, )). However, unlike in the TCGA database, there was not a significant difference of CKS2 expression between IDH1-wildtype group and IDH1-mutation group in the CGGA database (p = 0.296, )). We then used the Gene_Mutation module in TIMER2.0 database for validation. The TIMER2.0 data showed high expression of CKS2 in the IDH1-wildtype group (p < 0.05, )). Since IDH1-wildtype status predicts worse survival of LGG patients, CKS2 might be playing an oncogenic role in LGG.
Figure 3. The correlation between the CKS2 mRNA expression and IDH1 mutation status in (a) TCGA database, (b) CGGA database and (c) TIMER2.0 database
DNA copy number gain, DNA hypomethylation might be related to CKS2 overexpression in LGG
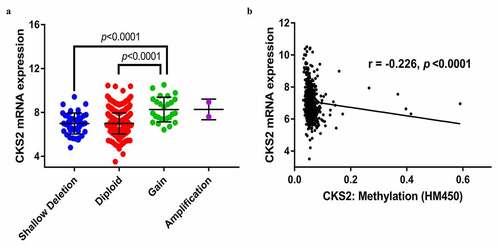
We downloaded complete CKS2 mRNA data, copy number alterations and DNA methylation in the LGG patients in the TCGA database. We then explored the association between the CKS2 mRNA overexpression and its copy number alterations as well as methylation. The data showed that 2 patients had CKS2 copy number amplification while 26 patients had CKS2 copy number gain (low-level amplification). Besides, CKS2 mRNA upregulation was significantly associated with CKS2 copy number gain (p < 0.0001, )). Furthermore, linear regression analysis revealed that the CKS2 mRNA expression was negatively correlated with methylation level of CKS2 DNA (r = −0.226, p < 0.0001, )), indicating that the upregulation of CKS2 might be associated with the low methylation status in the LGG patients. Previous studies showed that DNA hypomethylation might mediate carcinogenesis via transcriptional activation and overexpression of oncogenes and was associated with tumor progression or degree of malignancy [Citation27,Citation28]. This phenomenon might explain the negative correlation between the CKS2 mRNA expression and its DNA methylation.
Figure 4. The association between the CKS2 and copy number alteration (CNA), or methylation in LGG. (a) CKS2 mRNA expression in different CNA groups. (b) Correlation analysis between CKS2 mRNA expression and CKS2 DNA methylation
Performance of CKS2 in predicting the survival of the LGG patients
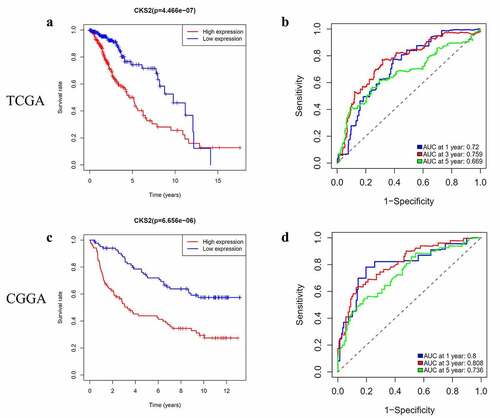
To evaluate the ability of CKS2 in predicting the prognosis of the LGG patients, we carried out survival analysis and ROC analysis. In the TCGA-LGG cohort, the survival analysis showed that patients with high CKS2 expression had shorter survival period compared to those with low CKS2 expression (log-rank p < 0.001, )). We then evaluated the prognostic value of CKS2 using time-dependent ROC curves. In the TCGA-LGG cohort, the 1-year, 3-year, or 5-year survival rate had an AUC of 0.72, 0.759, or 0.669, respectively ()). On the other hand, we conducted the survival analysis in the CGGA cohort and showed that, the results were consistent with the survival analysis in the TCGA-LGG cohort (log-rank p < 0.001, )). Besides, time-dependent ROC curves showed that 1-year, 3-year, or 5-year survival rate had AUC of 0.8, 0.808, or 0.736, respectively in the CGGA cohort ()).
Figure 5. Survival prediction by the CKS2 gene in the TCGA-LGG and CGGA cohorts. (a-b) Kaplan-Meier (KM) survival analysis and time-dependent ROC analysis of CKS2 in LGG based on the TCGA-LGG cohort. (c-d) Kaplan-Meier (KM) survival analysis and time-dependent ROC analysis of CKS2 in LGG based on the CGGA cohort
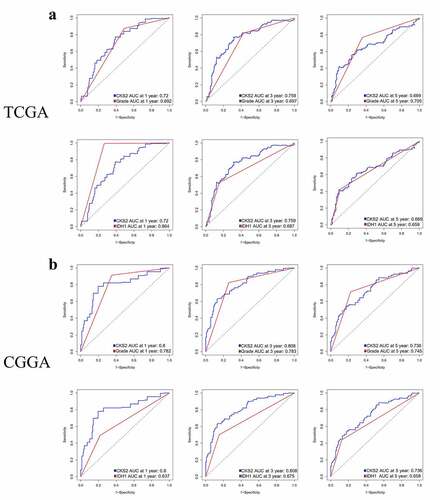
Furthermore, we compared the time-dependent ROC curves between CKS2 and other classic indicators including LGG grade and IDH1 mutation status in the TCGA-LGG cohort and the CGGA cohort, respectively. In the TCGA-LGG cohort, the AUC values for CKS2 in predicting 1-year, 3-year survival rates (0.72, 0.759) exceeded those for LGG grade (0.692, 0.697); the AUC values for CKS2 in predicting 3-year, 5-year survival rates (0.759, 0.669) exceeded those for IDH1 mutation status (0.687. 0.659) ()). In the CGGA cohort, the AUC values for CKS2 in predicting 1-year, 3-year survival rates (0.8, 0.808) exceeded those for LGG grade (0.782, 0.783); the AUC values for CKS2 in predicting 1-year, 3-year, 5-year survival rates (0.8, 0.808, 0.736) all exceeded those for IDH1 mutation status (0.637, 0.675, 0.658) ()).
Figure 6. Time-dependent ROC analysis of CKS2, LGG grade and IDH1 mutation status in (a) the TCGA-LGG cohort and (b) the CGGA cohort
These findings showed that CKS2 was associated with poor outcome in the LGG patients and could accurately predict the survival rates of LGG patients.
CKS2 might serve as an independent prognostic factor for LGG patients
To assess the correlation between CKS2 and the clinicopathological parameters as well as the treatment methods in LGG patients, we performed Chi-square test in both the TCGA-LGG and CGGA cohorts. The data showed that CKS2 overexpression was associated with advanced grade and chemotherapy (p < 0.05, ). Univariate and multivariate Cox regression analyses on overall survival were performed based on the two cohorts. The multivariate Cox regression analysis showed that CKS2 could independently predict poor survival of the LGG patients (HRTCGA = 1.34, p = 0.002; HRCGGA = 1.96, p < 0.001, ).
Table 2. Association between CKS2 expression and the clinical parameters in patients with LGG in TCGA-LGG cohort
Table 3. Association between CKS2 expression and the clinical parameters in patients with LGG in CGGA cohort
Table 4. Univariate analysis and multivariate analysis of the correlation of CKS2 expression with OS among LGG patients in TCGA-LGG cohort and CGGA cohort
Enrichment analyses
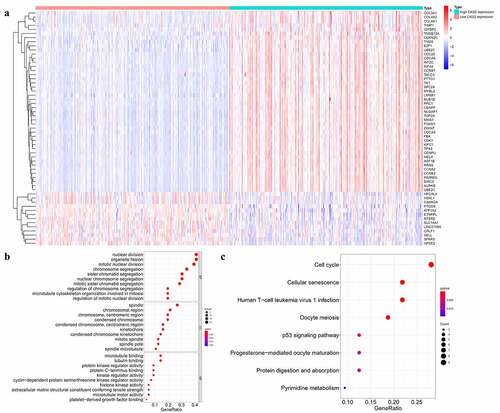
We divided the samples in the TCGA database into the low and high CKS2 expression groups as classified by the median expression of the CKS2 gene, then identified the CKS2-correlated differentially expressed genes (DEGs) between the low and high CKS2 expression groups (|log Fold Change (FC)|>1, adjusted p value<0.05). A total of 44 upregulated genes and 13 downregulated genes were detected in the high CKS2 expression group (p < 0.05, |logFC|>1, ), Supplementary Table 5). The result displayed the significant CKS2-correlated genes which help us explore the potential function of CKS2 by performing the enriched GO terms ()) and KEGG pathways analysis ()). KEGG pathway analysis and biological process (BP) terms revealed that the DEGs were mainly involved in the cell cycle regulation. Additionally, in the aspect of cellular component (CC) terms, the DEGs were enriched in spindle and chromosome. In the aspect of molecular function (MF) terms, the DEGs were involved in microtubule binding and protein kinase activity. These findings demonstrated the potential functions of the CKS2 gene in tumor development by regulating cell cycle and cell division.
Figure 7. Functional enrichment analysis of the differential expressed genes (DEGs) in the TCGA database. (a) Heatmap showing differentially expressed genes in the low and high CKS2 expression groups in LGG. (b-c) GO and KEGG enrichment analysis of the DEGs
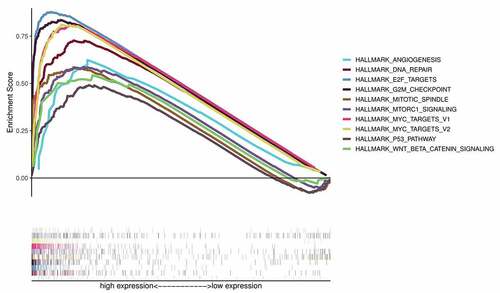
Besides, we carried out Gene Set Enrichment Analysis (GSEA) between the low and high CKS2 expression groups in TCGA database. The GSEA data showed that DNA repair, MYC targets V1, E2F targets, G2M checkpoint, mTORC1 signaling, MYC targets V2, mitotic spindle, p53 and Wnt/β-catenin signaling pathways as well as angiogenesis were enriched in the high CKS2 expression group (, ).
Table 5. Gene sets enriched in the high CKS2 expression group
Figure 8. Gene Set Enrichment Analysis (GSEA) showing the signaling pathways enriched in phenotypes with overexpressed CKS2 in LGG
Discussion
Gliomas account for the highest cases of brain malignant tumors. Despite aggressive treatment, the prognosis of patients remains unsatisfactory [Citation29]. Among the malignant gliomas, there are lower grade gliomas (LGGs) which include grade II and grade III gliomas. Besides molecular characteristics, histopathological grade can also affect the prognosis of the LGG patients, leading to the enormous variability in survival outcomes [Citation30]. It is, therefore, important to identify prognostic biomarkers of LGG.
CKS2 has been shown play essential functions in the cell cycle. Accumulating evidence demonstrates that CKS2 fuels the occurrence and tumor development, as well as metastasis among many human malignant tumors. Chen et al. demonstrated that CKS2 could promote the progression of bladder cancer to muscle-invasive [Citation31]. Besides, Kita et al. found that the overexpression of CKS2 in esophageal squamous cell carcinoma was associated with malignant behaviors and poor prognosis [Citation32]. Moreover, similar observations have been made in other malignant tumors, such as gastric cancer [Citation33], epithelial ovarian cancer [Citation34], colorectal cancer [Citation35] as well as prostate cancer [Citation36], which demonstrated that CKS2 might be an important oncogene. Although previous studies using qRT-PCR technique have indicated that CKS2 mRNA was overexpressed in glioblastomas, however, the CKS2 protein expression in LGG has not been identified so far, and the role of CKS2 in LGG is yet to be defined as well.
In the current study, we aimed to profile the expression of CKS2 gene and uncover its functions in LGG. We evaluated multiple online databases, such as the TCGA, CGGA, GEO, GEPIA2 and TIMER 2.0. The data showed that CKS2 was upregulated in LGG tissues, especially in grade III gliomas. To verify these observations, we performed IHC using the LGG samples and adjacent brain tissues, and the data agreed with the finding from the bioinformatic analysis. On the other hand, IDH1 status is an important molecular feature in LGG, which could affect the clinical outcomes of LGG patients. Here, we also explored the association between CKS2 expression and IDH1 status. Based on TCGA data and TIMER 2.0, we observed that the CKS2 expression was upregulated in IDH1-wildtype group compared with the IDH1-mutant group. IDH1-wildtype is one of the factors associated with poor prognosis of LGG patients, thus CKS2 might be acting as an oncogene. Furthermore, we assessed the potential mechanism of CKS2 upregulation in LGG from the perspective of genetic and epigenetic changes. The data showed existence of a significantly positive correlation between the CKS2 copy number gain and CKS2 upregulation in LGG. Besides, the data demonstrated a significantly negative correlation between the CKS2 mRNA expression and CKS2 methylation level in LGG. DNA hypomethylation is common in cancer and often leads to upregulation of oncogenes. In addition, we found that CKS2 overexpression was associated with advanced grade and chemotherapy in the LGG patients. Through survival and Cox regression analyses, CKS2 overexpression demonstrated remarkable correlation with poor prognosis of LGG patients and could independently lead to the unfavorable overall survival. Besides, CKS2 showed an excellent ability in predicting the 1-year,3-year or 5-year survival rates of LGG patients through time-dependent ROC analysis.
To uncover the underlying biological functions of CKS2 in LGG, we conducted enrichment analyses. We identified differential expressed genes (DEGs) in the low and high CKS2 expression groups in TCGA database. Using the DEGs, we performed Gene ontology (GO) analysis in terms of biological process (BP), cellular component (CC), molecular function (MF) and Kyoto encyclopedia of genes and genomes (KEGG) analysis. The results of GO and KEGG enrichment analysis revealed that CKS2 might be participating in cell division and cell cycle regulation in LGG. Through the GSEA, we screened several signaling pathways that were enriched in the high CKS2 expression group including DNA repair, MYC targets V1, E2F targets, G2M checkpoint, mTORC1 signaling, MYC targets V2, mitotic spindle, p53 and Wnt/β-catenin signaling pathways as well as angiogenesis. It was reported that some pathways including DNA repair, Myc targets V1/2, mitotic spindle, E2F targets and G2M checkpoint were associated with cell cycle, cancer cell proliferation and tumor metastasis [Citation37,Citation38]. The Wnt/β-catenin signaling was reported to participate in cellular proliferation, migration, invasion, and angiogenesis, contributing to glioma progression [Citation39]. The activation of mTORC1 in human gliomas could promote tumor formation and growth [Citation40]. A study showed that angiogenesis was associated with the progression of LGG grade [Citation41]. Besides, alterations in the p53 pathway in LGG could promote the progression to high grade [Citation42]. Taken together, the pathways enriched in high CKS2 expression group indicated that CKS2 was involved in the progression of LGG.
In summary, our study was the first to evaluate the CKS2 protein expression in LGG by immunohistochemistry and explore the functions of CKS2 in LGG. Our work also has some limitations. First, there exist a large difference between the numbers of immunohistochemical samples and the databases’ samples. Therefore, more clinical samples and data need to be collected for further validation, survival analysis using clinical data should also be conducted in detail. On the other hand, we only selected immunohistochemistry for differential expression analysis, further experiments using standard cell lines should be performed as well.
Conclusion
Taken together, our study demonstrated the association between the CKS2 gene overexpression and prognosis of LGG patients. We showed that CKS2 could be a prognostic biomarker and might be a potential therapeutic target in LGG.
Research highlights
(1) CKS2 is upregulated in LGG tissues at both mRNA level and protein level.
(2) CKS2 expression is associated with LGG grade and IDH1 mutation status.
(3) CKS2 is related to the poor prognosis of LGG patients.
(4) CKS2 might act as an independent prognostic factor for LGG patients.
Ethical approval
This study was approved by the Ethic Committees of the Second Affiliated Hospital of Zhengzhou University (number: 2021313). Informed consents had been signed and obtained from all the patients.
Supplemental Material
Download ()Data availability statement
All the data was downloaded from UCSC Xena (http://xena.ucsc.edu/public/), CGGA (http://www.cgga.org.cn/index.jsp), GEO (https://www.ncbi.nlm.nih.gov/geo/) and cBioPortal web server (https://www.cbioportal.org/study/summary?id=lgg_tcga). Besides, all the codes we used are available from the corresponding author for noncommercial purposes.
Disclosure statement
All authors declare that there is no conflict of interests.
Supplementary material
Supplemental data for this article can be accessed here.
Additional information
Funding
Related Research Data
References
- Louis DN, Perry A, Reifenberger G, et al. The 2016 world health organization classification of tumors of the central nervous system: a summary. Acta Neuropathol. 2016;131(6):803–820.
- Xiao Y, Cui G, Ren X, et al. A novel four-gene signature associated with immune checkpoint for predicting prognosis in lower-grade glioma. Front Oncol. 2020;10:605737.
- Liu X, Li Y, Li S, et al. mutation-specific radiomic signature in lower-grade gliomas. Aging (Albany NY). 2019;11(2):673–696.
- Brat DJ, Verhaak RGW, Aldape KD, et al. Comprehensive, integrative genomic analysis of diffuse lower-grade gliomas. N Engl J Med. 2015;372(26):2481–2498.
- Martinsson-Ahlzén H-S, Liberal V, Grünenfelder B, et al. Cyclin-dependent kinase-associated proteins Cks1 and Cks2 are essential during early embryogenesis and for cell cycle progression in somatic cells. Mol Cell Biol. 2008;28(18):5698–5709.
- Spruck CH, De Miguel MP, Smith APL, et al. Requirement of Cks2 for the first metaphase/anaphase transition of mammalian meiosis. Science. 2003;300(5619):647–650.
- Zhang J, Song Q, Liu J, et al. Cyclin-dependent kinase regulatory subunit 2 indicated poor prognosis and facilitated aggressive phenotype of hepatocellular carcinoma. Dis Markers. 2019;2019:8964015.
- Ji X, Xue Y, Wu Y, et al. High-expressed CKS2 is associated with hepatocellular carcinoma cell proliferation through down-regulating PTEN. Pathol Res Pract. 2018;214(3):436–441.
- Shen D-Y, Fang Z-X, You P, et al. Clinical significance and expression of cyclin kinase subunits 1 and 2 in hepatocellular carcinoma. Liver Int. 2010;30(1):119–125.
- Yang K, Gao J, Luo M. Identification of key pathways and hub genes in basal-like breast cancer using bioinformatics analysis. Onco Targets Ther. 2019;12:1319–1331.
- Huang N, Wu Z, Hong H, et al. Overexpression of CKS2 is associated with a poor prognosis and promotes cell proliferation and invasion in breast cancer. Mol Med Rep. 2019;19(6):4761–4769.
- Shen D-Y, Zhan Y-H, Wang Q-M, et al. Oncogenic potential of cyclin kinase subunit-2 in cholangiocarcinoma. Liver Int. 2013;33(1):137–148.
- Scrideli CA, Carlotti CG, Okamoto OK, et al. Gene expression profile analysis of primary glioblastomas and non-neoplastic brain tissue: identification of potential target genes by oligonucleotide microarray and real-time quantitative PCR. J Neurooncol. 2008;88(3):281–291.
- Rickman DS, Bobek MP, Misek DE, et al. Distinctive molecular profiles of high-grade and low-grade gliomas based on oligonucleotide microarray analysis. Cancer Res. 2001;61(18):6885–6891.
- Cline MS, Craft B, Swatloski T, et al. Exploring TCGA pan-cancer data at the UCSC cancer genomics browser. Sci Rep. 2013;3:2652.
- Zhao Z, Meng F, Wang W, et al. Comprehensive RNA-seq transcriptomic profiling in the malignant progression of gliomas. Sci Data. 2017;4:170024.
- Bao Z-S, Chen H-M, Yang M-Y, et al. RNA-seq of 272 gliomas revealed a novel, recurrent PTPRZ1-MET fusion transcript in secondary glioblastomas. Genome Res. 2014;24(11):1765–1773.
- Tang Z, Kang B, Li C, et al. GEPIA2: an enhanced web server for large-scale expression profiling and interactive analysis. Nucleic Acids Res. 2019;47(W1):W556–W60.
- Sun L, Hui A-M, Su Q, et al. Neuronal and glioma-derived stem cell factor induces angiogenesis within the brain. Cancer Cell. 2006;9(4):287–300.
- Gravendeel LAM, Kouwenhoven MCM, Gevaert O, et al. Intrinsic gene expression profiles of gliomas are a better predictor of survival than histology. Cancer Res. 2009;69(23):9065–9072.
- Gao J, Aksoy BA, Dogrusoz U, et al. Integrative analysis of complex cancer genomics and clinical profiles using the cBioPortal. Sci Signal. 2013;6(269):pl1.
- Fromowitz FB, Viola MV, Chao S, et al. ras p21 expression in the progression of breast cancer. Hum Pathol. 1987;18(12):1268–1275.
- Li T, Fu J, Zeng Z, et al. TIMER2.0 for analysis of tumor-infiltrating immune cells. Nucleic Acids Res. 2020;48(W1):W509–W14.
- Yu G, Wang L-G, Han Y, et al. clusterProfiler: an R package for comparing biological themes among gene clusters. OMICS. 2012;16(5):284–287.
- Subramanian A, Tamayo P, Mootha VK, et al. Gene set enrichment analysis: a knowledge-based approach for interpreting genome-wide expression profiles. Proc Natl Acad Sci U S A. 2005;102(43):15545–15550.
- Chen S, Wei Y, Liu H, et al. Analysis of Collagen type X alpha 1 (COL10A1) expression and prognostic significance in gastric cancer based on bioinformatics. Bioengineered. 2021;12(1):127–137.
- Brzeziańska E, Dutkowska A, Antczak A. The significance of epigenetic alterations in lung carcinogenesis. Mol Biol Rep. 2013;40(1):309–325.
- Ehrlich M. DNA hypomethylation in cancer cells. Epigenomics. 2009;1(2):239–259.
- Hu Y, Zhang M, Tian N, et al. The antibiotic clofoctol suppresses glioma stem cell proliferation by activating KLF13. J Clin Invest. 2019;129(8):3072–3085.
- Franceschi E, Tosoni A, Bartolini S, et al. Histopathological grading affects survival in patients with IDH-mutant grade II and grade III diffuse gliomas. Eur J Cancer. 2020;137:10–17.
- Chen R, Feng C, Xu Y. Cyclin-dependent kinase-associated protein Cks2 is associated with bladder cancer progression. J Int Med Res. 2011;39(2):533–540.
- Kita Y, Nishizono Y, Okumura H, et al. Clinical and biological impact of cyclin-dependent kinase subunit 2 in esophageal squamous cell carcinoma. Oncol Rep. 2014;31(5):1986–1992.
- Tanaka F, Matsuzaki S, Mimori K, et al. Clinicopathological and biological significance of CDC28 protein kinase regulatory subunit 2 overexpression in human gastric cancer. Int J Oncol. 2011;39(2):361–372.
- Xu JH, Wang Y, Xu D. CKS2 promotes tumor progression and metastasis and is an independent predictor of poor prognosis in epithelial ovarian cancer. Eur Rev Med Pharmacol Sci. 2019;23(8):3225–3234.
- Jung Y, Lee S, Choi H-S, et al. Clinical validation of colorectal cancer biomarkers identified from bioinformatics analysis of public expression data. Clin Cancer Res. 2011;17(4):700–709.
- Lan Y, Zhang Y, Wang J, et al. Aberrant expression of Cks1 and Cks2 contributes to prostate tumorigenesis by promoting proliferation and inhibiting programmed cell death. Int J Cancer. 2008;123(3):543–551.
- Li H-N, Zheng W-H, Du -Y-Y, et al. ZW10 interacting kinetochore protein may serve as a prognostic biomarker for human breast cancer: an integrated bioinformatics analysis. Oncol Lett. 2020;19(3):2163–2174.
- Gong Y, Liu Y, Wang T, et al. Age-associated proteomic signatures and potential clinically actionable targets of colorectal cancer. Mol Cell Proteomics. 2021;20:100115.
- He L, Zhou H, Zeng Z, et al. Wnt/β-catenin signaling cascade: a promising target for glioma therapy. J Cell Physiol. 2019;234(3):2217–2228.
- Pachow D, Wick W, Gutmann DH, et al. The mTOR signaling pathway as a treatment target for intracranial neoplasms. Neuro Oncol. 2015;17(2):189–199.
- Guo H, Kang H, Tong H, et al. Microvascular characteristics of lower-grade diffuse gliomas: investigating vessel size imaging for differentiating grades and subtypes. Eur Radiol. 2019;29(4):1893–1902.
- Ludwig K, Kornblum HI. Molecular markers in glioma. J Neurooncol. 2017;134(3):505–512.