
ABSTRACT
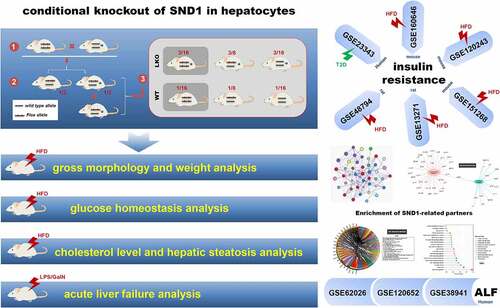
Although our previous research shows an ameliorated high-fat diet (HFD)-induced hepatic steatosis and insulin resistance in global SND1 transgenic mice, the involvement of SND1 loss-of-function in hepatic metabolism remains elusive. Herein, we aim to explore the potential impact of hepatocyte-specific SND1 deletion on insulin-resistant mice. As SND1 is reported to be linked to inflammatory response, the pathobiological feature of acute liver failure (ALF) is also investigated. Hence, we construct the conditional liver knockout (LKO) mice of SND1 for the first time. Under the condition of HFD, the absence of hepatic SND1 affects the weight of white adipose tissue, but not the gross morphology, body weight, cholesterol level, liver weight, and hepatic steatosis of mice. Furthermore, we fail to observe significant differences in either HFD-induced insulin resistance or lipopolysaccharide/D-galactosamine-induced (LPS/D-GaIN) ALF between LKO and wild type (WT) mice in terms of inflammation and tissue damage. Compared with negative controls, there is no differential SND1 expression in various species of sample with insulin resistance or ALF, based on several gene expression omnibus datasets, including GSE23343, GSE160646, GSE120243, GSE48794, GSE13271, GSE151268, GSE62026, GSE120652, and GSE38941. Enrichment result of SND1-binding partners or related genes indicates a sequence of issues related to RNA or lipid metabolism, but not glucose homeostasis or hepatic failure. Overall, hepatic SND1 is insufficient to alter the phenotypes of hepatic insulin resistance and acute liver failure in mice. The SND1 in various organs is likely to cooperate in regulating glucose homeostasis by affecting the expression of lipid metabolism-related RNA transcripts during stress.
Graphical Abstract
1. Introduction
Human SND1, also termed Tudor-SN (Tudor staphylococcal nuclease), contains four staphylococcal nucleases-like (SN1 ~ 4) domains at N-terminus and a Tudor-SN5 domain at C-terminus [Citation1,Citation2]. After a series of assays based on the cellular, animal, and clinical samples, SND1 was reportedly involved in a variety of biological processes, such as gene transcription, splicing of mRNA precursors, cell cycle, DNA damage repair, proliferation, apoptosis, lipogenesis, and tumorigenesis [Citation3–12].
Previously, we observed a reduced accumulation of triglyceride and the improved fatty liver and insulin resistance in the liver tissue of global SND1 transgenic mice under the treatment of a high-fat diet [Citation13]. As an essential organ of the body, the liver tissue is closely linked to the presence of insulin resistance [Citation14]. Hepatocytes are responsible for lipogenesis, cholesterol biosynthesis, and glucose metabolism [Citation15]. Growing evidence supports the functional links between SND1 protein and liver tissue in different species. For example, human SND1 can promote the proliferation of hepatocellular carcinoma cell lines [Citation12,Citation16] and takes part in the occurrence of hepatocellular carcinoma [Citation17,Citation18]. In the primary hepatocytes of rats, SND1 reportedly regulates the secretion of lipoprotein phospholipids [Citation19,Citation20]. Thus, we are interested in investigating the potential role of hepatic SND1 expression in the liver insulin resistance of mice.
Upon external stimuli, the liver organ may suffer from acute liver failure (ALF) [Citation21]. ALF is a severe clinical syndrome that involves sudden and massive liver cell death and liver dysfunction, which may lead to the presence of coagulopathy, encephalopathy, and circulatory dysfunction [Citation22,Citation23]. It was reported that the highly expressed SND1 was associated with a chronic inflammatory state of hepatocellular carcinoma cells [Citation18]. However, the relationship between SND1 expression and ALF with inflammation response remains elusive.
With regard to the SND1 gene-modified animal models, only global SND1 transgenic mice and hepatocyte-specific SND1 transgenic mice (Alb/SND1 mice) [Citation18] were studied previously [Citation13]. In the present study, we constructed the liver SND1 LKO mice using a Cre-loxP system for the first time. We then investigated whether hepatocyte-specific deletion of SND1 in mice affects HFD-induced liver insulin resistance and LPS/D-GalN-induced ALF. Additionally, we performed the SND1 expression pattern analysis using the available gene expression omnibus (GEO) datasets for liver insulin resistance and acute liver failure and the enrichment analysis of SND1 binding or correlated partners.
2. Materials and methods
2.1. SND1 liver conditional knockout mice
We first constructed the SND1 Flox/Flox mice and produced the SND1 Flox/WT-albumin-Cre+ heterozygous mice by crossing the SND1 Flox/Flox mice and the albumin-Cre+ mice with the WT allele of SND1 (WT/WT-albumin-Cre+mice, The Jackson Laboratory, USA). After the second round of mating, SND1 Flox/Flox-albumin-Cre+ homozygous mice were obtained as the SND1 liver conditional knockout (LKO) mice.SND1 Flox/Flox littermates were used as WT controls.
To verify the successful construction of SND1 LKO mice, we extracted the DNA from mouse primary hepatocytes and performed a genotyping polymerase chain reaction assay to detect the presence of SND1 Flox sites and the Cre gene. The primer sequences: SND1 Flox 5ʹ-CAGCACTAAAAGCTTGTCCC-3ʹ (Forward 1, F1), 5ʹ-ACGAGAGTATGGGATGATCT-3ʹ (Forward 2, F2), 5ʹ-GCTAAAGAGTCCCTAGAAAG-3ʹ (Reverse, R); Cre 5ʹ-GAAGCAGAAGCTTAGGAAGATGG-3ʹ (F), 5ʹ-TTGGCCCCTTACCATAACTG-3ʹ (R); Internal control 5ʹ-CAAATGTTGCTTGTCTGGTG-3ʹ (F); 5ʹ-GTCAGTCGAGTGCACAGTTT-3ʹ (R).
The mice were free to eat and drink under the feeding conditions [temperature of 22 ± 2°C, humidity: 40 ~ 70%; light cycle: 12/12 hours (h)]. A total of 10 SND1 LKO male mice were randomly divided into two groups, namely the chow diet (10% kcal from fat, D12450B, Research Diets) (LKO CD) and high-fat diet group (60% kcal from fat, D12492, Research Diets) (LKO HFD). Meanwhile, the chow diet (WT CD) and high-fat diet (WT HFD) groups from the ten litters of WT male mice were included as controls. The body weight of WT or SND1 LKO mice was measured every week. Mice were sacrificed by dislocation at the 24 weeks (w) of chow or high-fat diet. Liver and white adipose tissues were quickly separated and weighed. Each liver tissue was divided into three sections: 1) the first was used for the western blot analysis; 2) the second was for the detection of total liver cholesterol and liver-free cholesterol (Applygen, Beijing); 3) the third was subjected to Hematoxylin & Eosin (H&E) staining (ZSGB-BIO, China). The study protocols and use of animals were approved by the institutional animal care and use committee of Tianjin Medical University.
2.2. Primary hepatocyte extraction
We first anesthetized the mice by intraperitoneally injecting 7% chloral hydrate (25 mg/g). Five minutes later, the peritoneal cavity was opened. The inferior vena cava was perfused with EGTA solution (Sigma Aldrich). When the liver color became lighter, we cut the portal vein and perfused the liver using the solution of protease and collagenase (Sigma Aldrich). At the end of the perfusion, a white texture was visible on the liver. After perfusion, the mice were sacrificed, and the organ was cut and transferred to a 6 cm culture dish. After the addition of pre-warmed protease and collagenase in vitro hydrolyzate, we disrupted the liver tissue by forceps. Then, the broken liver tissue was transferred into a 50 ml centrifuge tube and incubated with the 20 ml pre-warmed protease and collagenase in vitro hydrolyzate and 1% DNase (Solarbio) in a 37°C hybridization chamber for 20 min. The liver tissue was then filtered by the 70 μm pore size Falcon filter (BD Biosciences Discovery Labware, Bedford, MA) and centrifuged 20 ~ 30 × g for 4 ~ 5 min at 4°C. The bottom primary hepatocytes were finally obtained.
2.3. Fasting/refeeding assay
After 4 w of chow or high-fat diet in mice, we performed a fasting/refeeding assay. Briefly, we fasted the mice for 16 h and measured the fasting blood glucose using a blood glucose meter (Accu-Chek Active, Roche). When the chow diet was restored, the blood glucose levels were measured at 0.5 h, 1 h, 2 h, 4 h, and 6 h, respectively. To assess the alteration of blood glucose, the area under the curve (AUC) was calculated as well.
2.4. Glucose and insulin tolerance test
As previously described [Citation13], a glucose tolerance test was performed using the mice of CD (4 w), or HFD (4 w, 8 w, and 12 w). After the fasting treatment for 16 h, the mice were injected intraperitoneally with a glucose solution (1.5 g/kg). Additionally, an insulin tolerance test was performed [Citation13] through the intraperitoneal injection of 0.75 U/kg insulin (solarbio) into the mice at the 16 w of chow or high-fat diet. We measured the blood glucose levels at the time points of 0 min, 15 min, 30 min, 45 min, 60 min, and 90 min, respectively, and calculated the AUC values.
2.5. Acute insulin response assay
As previously reported [Citation13], we performed an acute insulin response assay. Briefly, at 24 w of chow or high-fat diet, WT, and SND1 LKO mice were fasted overnight and anesthetized by intraperitoneal injection of 7% chloral hydrate (25 mg/g). Five minutes (min) later, we opened the abdominal cavity and injected the insulin solution (solarbio) into the portal vein. At the points of 0 and 5 min, tissue proteins in the liver leaves were extracted. The phosphorylation level of Akt protein was measured by a western blotting assay, using anti-Akt (Cell Signaling Technology) and anti-p-Akt (Cell Signaling Technology) antibodies. Then, the band density was digitized using an Image J 2X software (NIMH, Bethesda, MD, USA).
2.6. Western blot analysis
We performed a western blotting assay as previously described [Citation6]. We homogenized the liver, spleen, pancreas, and kidney tissues of WT and LKO mice with a fast cell disrupter (Bullet Blender, Next advance) and isolated the primary hepatocytes. HCC SMMC-7721 cell line was provided by professor Zhi Yao (Tianjin Medical University). The following antibodies were used: anti-GAPDH (Proteintech Group), anti-β-actin (Sigma-Aldrich), anti-Akt (Cell Signaling Technology), and anti-p-Akt (Cell Signaling Technology). Mouse monoclonal anti-SND1 antibody was utilized as described previously [Citation8,Citation11].
2.7. ALF mice model
We established the mice model of ALF by intraperitoneally injecting LPS (5 mg/kg body weight; Sigma-Aldrich) and D-GalN (100 mg/kg body weight; Sigma-Aldrich) into SND1 LKO or WT mice. Normal saline (NS) was used as a control. Serum aminotransferase activities of mice were measured using an aspartate aminotransferase (AST) detection kit (Jiancheng, Nanjing), an alanine aminotransferase (ALT) detection kit (Jiancheng, Nanjing), and a microplate reader (Varioskan Flash, Thermo). We also perform an H&E staining assay in different groups using Hematoxylin and eosin (ZSGB-BIO), according to the manufacturer’s instructions.
2.8. Quantitative real-time polymerase chain reaction (qPCR)
As described previously [Citation12], we isolated the total RNA from the liver tissues of mice using TRIZOL reagent (Invitrogen) and synthesized the cDNA by a revert aid first-strand cDNA synthesis kit (Thermo Fisher Scientific). Then, FastStart universal SYBR Green Master Mix (Roche Diagnostics) was used to perform a polymerase chain reaction assay. The primer sequences: IL-1β [5ʹ-TGGACCTTCCAGGATGAGGACA-3ʹ (F); 5ʹ-GTTCATCTCGGAGCCTGTAGTG-3ʹ (R)]; IL-6 [5ʹ-TACCACTTCACAAGTCGGAGGC-3ʹ (F); 5ʹ-CTGCAAGTGCATCATCGTTGTTC-3ʹ (R)]; TNF-α [5ʹ-GGTGCCTATGTCTCAGCCTCTT-3ʹ (F); 5ʹ-GCCATAGAACTGATGAGAGGGAG-3ʹ (R)].
2.9. GEO dataset analysis
As reported previously [Citation24], we obtained the files of expression matrix, clinical trait, and platform annotation for the datasets of GSE23343, GSE160646, GSE120243, GSE48794, GSE13271, GSE151268, GSE62026, GSE120652, GSE38941, using an R package GeoQuery. Then, the extracted expression matrix of SND1 in the liver or white adipose tissues was matched with the group information, such as control/type-2 diabetes (T2D), CD/HFD, control/ALF, using RStudio software version 1.3.1093. The result of GSE13271 was visualized as a curve plot using a GraphPad Prism software version 7.04. The other data was finally visualized as a bar plot or violin plot using the ggboxplot () or ggviolin () functions within R package ggpubr.
2.10. Enrichment analysis of SND1-related partners
Based on our previously reported datasets of SND1-binding partners [Citation25] or GSE114447 [Citation12], we performed the enrichment analysis of KEGG (Kyoto encyclopedia of genes and genomes) and GO (gene ontology), which includes the molecular function, cellular component, and biological process, using R package clusterProfiler [Citation26,Citation27]. The enrichment results of SND1-binding partners were visualized as a circleplot or classplot using a sangerbox tool (http://www.sangerbox.com/tool). For the GSE114447, we obtained the SND1-related differential genes in HepG2 cell lines using R package LIMMA [P < 0.05, fold change (FC)>1.2] and provided the volcano plot using R package ggplot2. The GO enrichment data was visualized as a cnetplot by the cnetplot () function, while KEGG data was visualized as a network plot by a metascape tool (https://metascape.org/).
2.11. Statistical analysis
Based on the IBM SPSS Statistics 19.0 software, we performed an independent Student’s t-test or one-way analysis of variance (ANOVA), followed by Tukey’s multiple comparison test. For the time-dependent datasets, we performed the two-way ANOVA with Sidak’s multiple comparison test using the GraphPad Prism software. Apart from the GSE13271 dataset, a wilcox.test was performed for other GEO datasets, using the compare_means () function of R package ggpubr. A P value of less than 0.05 was considered statistically significant.
3. Results
In this study, we first generated mice with the hepatocyte-specific deletion of SND1 in the liver, namely SND1 liver conditional knockout model. Then, we performed a series of experiments, such as fasting/refeeding assay, glucose/insulin tolerance test, and acute insulin response assay, to analyze the in vivo role of hepatic SND1 in the HFD-induced insulin resistance. We also investigated whether the hepatocyte-specific deletion of SND1 influences the acute liver failure process by using an LPS/D-GalN-induced mice model of ALF. Further, we analyzed the SND1 expression pattern in various samples of GSE23343, GSE160646, GSE120243, GSE48794, GSE13271, GSE151268, GSE62026, GSE120652, and GSE38941, and the GO and KEGG enrichment analysis of SND1-binding or correlated partners,
3.1. Conditional knockout of SND1 in hepatocytes
To study the impact of hepatocyte-specific SND1 deletion on liver insulin resistance and ALF, we first successfully constructed the liver LKO mice of SND1. As shown in , we first generated the SND1 Flox/Flox mice with the loxP allele flanked at the exon 3 of the SND1 gene and purchased the WT/WT-albumin-Cre+ mice, which contains the wild-type allele and the specific gene sequence for expressing albumin-induced Cre enzyme. By crossing the two strains mentioned above, the SND1 Flox/WT-albumin-Cre+ heterozygous mice were obtained from the offspring with a probability of 1/2. After another round of inbreeding SND1 Flox/WT-albumin-Cre+ heterozygous mice, the SND1 Flox/Flox-albumin-Cre+ homozygous mice (SND1 LKO mice) were obtained with a probability of 3/16. SND1 Flox/Flox littermates were used as WT controls.
Figure 1. Construction of SND1 LKO mice
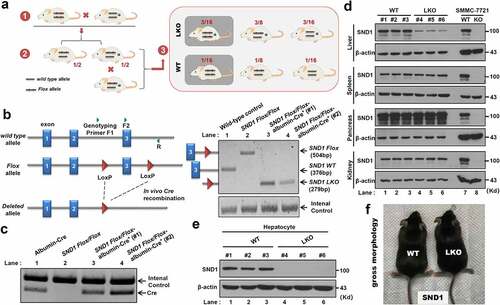
To determine the genotype of SND1 LKO mice required for our experiments, we extracted the DNA from mouse primary hepatocytes and performed the genotyping assay using the mixture of three primers (), F1 within intron 2 of SND1, F2 within exon 3, and R within intron 3) to detect the presence of SND1 LoxP sites. For the WT control mice without LoxP site, SND1 WT band of 376 bp was detectable through a PCR assay with the F2 plus R primers (), lane 1). Due to the presence of the LoxP site within SND1 Flox/Flox mice, the SND1 Flox band of 504 bp was detectable using the primers of F2 plus R (), lane 2). For the SND1 Flox/Flox-albumin-Cre+ homozygous mice (#1 and #2), the albumin-Cre contributed to in vivo Cre recombination between the two LoxP sites and the existence of SND1 LKO band of 279 bp (), lane 3 and 4, primers of F1 plus R). The internal control was detectable in all lanes (.
Besides, we extracted the liver, spleen, pancreas, and kidney tissues from the WT (#1, #2, #3) and SND1 LKO (#4, #5, #6) mice, respectively ()). SMMC-7721 cell lines of WT and SND1 knockout (KO) were used as the controls. A western blotting assay was then performed using an anti-SND1 or anti-β-actin antibody. As shown in ), SND1 protein was utterly deleted in the SMMC-7721 of SND1 KO. However, we only detected a diminished expression level of SND1 protein in the liver tissues of SND1 LKO (#4, #5, #6) mice (), lanes 1–3), compared with that of WT (#1, #2, #3) mice (lanes 4–6). There was no expression difference of SND1 between WT and SND1 LKO mice in the tissues of spleen, pancreas, and kidney ()). Further, we extracted primary hepatocytes from the liver tissue of the mice and observed that SND1 protein was deficient in the primary hepatocytes of SND1 LKO mice ()). The above indicated a workable system of mice with the hepatocyte-specific deletion of SND1 was successfully constructed. We also provided the gross morphology of WT and SND1 LKO mice in ) and did not observe a significant difference.
3.2. Gross morphology and weight analysis
We then investigated the effect of SND1 liver conditional knockout on the weight of mice on a chow diet (CD) or high-fat diet (HFD). For the CD group, we monitored the body weights of WT or SND1 LKO mice weekly and did not detect a significant change (), P > 0.05) between WT and LKO over different time points. After 24 w of CD, we measured the weight of liver tissue and calculated the ratio value of liver/body weight. There were no statistical deviations between the WT and SND1 LKO mice (), P = 0.477 for liver weight, P = 0.718 for the liver weight/body weight). We further measured the weight of white adipose tissue (WAT) and calculated the ratio value of WAT/body weight, respectively, neither of which showed a significant difference as shown in ) (P = 0.516 for WAT weight, P = 0.195 for the WAT/body weight).
Figure 2. Effect of SND1 hepatocyte-specific deletion on weight of mice
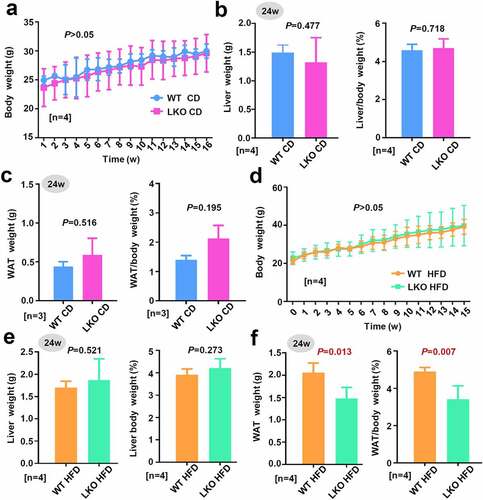
Figure 3. Effect of SND1 hepatocyte-specific deletion on Akt pathway
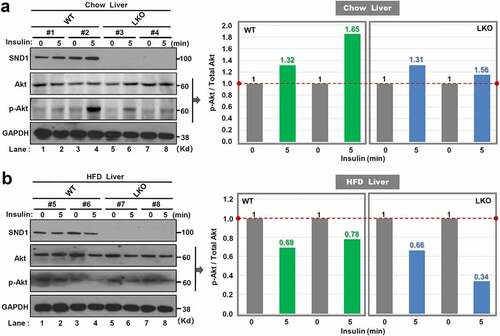
Figure 4. Effect of SND1 hepatocyte-specific deletion on glucose homeostasis of mice
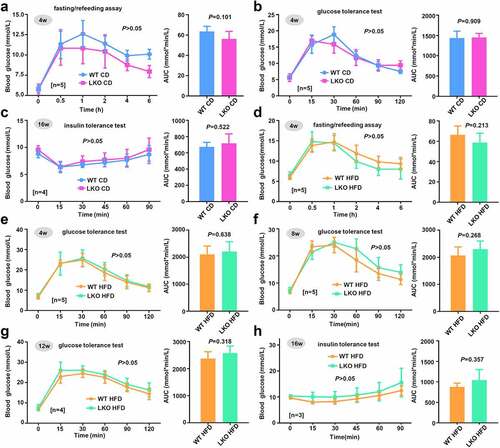
Figure 5. Cholesterol level and hepatic steatosis in WT and LKO mice with a high-fat diet
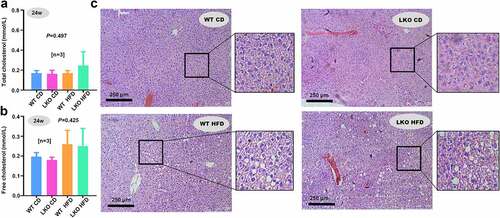
Figure 6. Effect of SND1 hepatocyte-specific deletion on acute liver failure induced by LPS/D-GalN
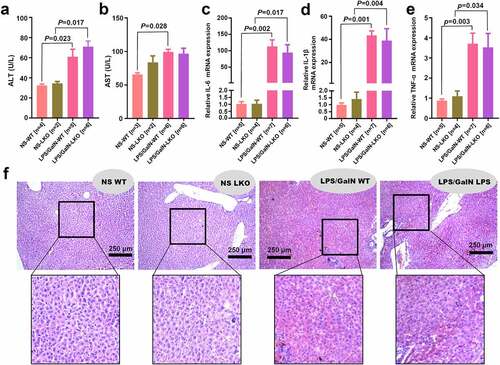
Figure 7. SND1 expression in liver tissues of insulin resistance-related GEO datasets
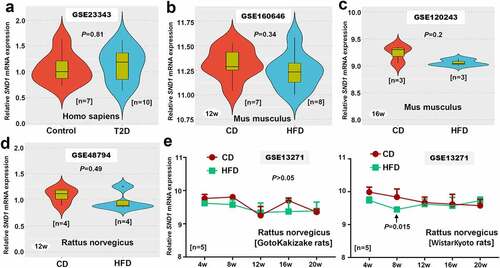
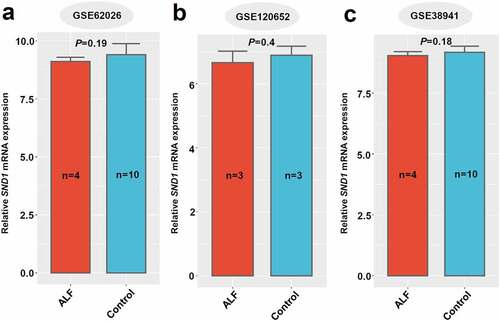
Figure 8. SND1 expression in liver tissues of ALF-related GEO datasets
For the HFD group, we also failed to observe the significant difference in body weight (), P > 0.05; ), P = 0.521) and the ratio value of liver/body weight (), P = 0.273) between WT HFD and LKO HFD mice. Nevertheless, the absence of hepatic SND1 resulted in a decreased WAT weight (), P = 0.013) or the ratio value of WAT/body weight (P = 0.007). These data indicated that SND1 liver conditional deficiency decreased the weight of white adipose tissue in mice under the condition of a high-fat diet, but not the gross morphology, body weight, and liver weight of mice.
3.3. Glucose homeostasis analysis
Considering the links of insulin stimulation to Akt pathway activation [Citation13,Citation28], we performed an acute insulin response assay to analyze the effect of SND1 hepatocyte-specific deletion on phosphorylation modification of Akt protein. After the 24 w of chow or high-fat diet, SND1 WT, and LKO mice were fasted overnight and anesthetized. After the injection of the insulin, the phosphorylation level of Akt protein in the liver tissue was analyzed by western blotting assay at the point of 0 min and 5 min. As shown in ), insulin treatment can increase the phosphorylation level of Akt protein in the liver tissue of WT mice. However, we observed a downward trend of the Akt phosphorylation signal in LKO mice ()). In addition, there was a decreased phosphorylation level of Akt protein in both WT and LKO mice with 24 w of HFD ()), suggesting that high-fat diet results in the occurrence of insulin resistance. Compared with WT mice, we observed a lower level of Akt protein phosphorylation in LKO mice with HFD ()). These results indicate a marginally suppressive effect of SND1 hepatocyte-specific deletion on the activation of Akt pathway during insulin stimulation.
Next, we determined to analyze the glucose homeostasis of WT and SND1 KO mice on a chow or high-fat diet. A fasting/refeeding assay was carried out. After the fasting treatment for 16 h, we restored the chow diet and measured the blood glucose levels of mice on 4 w CD at 0 h, 0.5 h, 1 h, 2 h, 4 h, and 6 h, respectively. As shown in ), there was no statistical difference in blood glucose alteration between WT CD and SND1 LKO CD mice (P > 0.05 for all time points; P = 0.101 for AUC). Then, a glucose tolerance test was performed. After the fasting treatment for 16 h, we injected intraperitoneally 1.5 g/kg glucose solution into the WT or SND1 LKO mice on 4 w CD and measured the blood glucose levels at the time points of 0 min, 15 min, 30 min, 60 min, 90 min, and 120 min, respectively. As shown in ), similar negative results were obtained (P > 0.05 for all time points; P = 0.909 for AUC). Further, we performed an insulin tolerance test at the 16 w of chow in mice. The 0.75 U/kg insulin was injected intraperitoneally into the mice, and the blood glucose levels at the time points of 0 min, 15 min, 30 min, 45 min, 60 min, and 90 min were measured. As shown in ), compared with the WT CD, no increased blood glucose level (P > 0.05) or AUC (P = 0.522) was observed in the SND1 LKO CD. Moreover, we performed a fasting/refeeding assay ()), glucose tolerance test (–g)), and insulin tolerance test ()), respectively, in the WT and SND1 LKO mice on a high-fat diet. Also, we did not observe the statistical difference between the WT and SND1 LKO mice (–h), all P > 0.05). Taken together, SND1 liver conditional deficiency is unable to modulate the glucose homeostasis of mice under the condition of either a chow diet or a high-fat diet.
3.4. Cholesterol level and hepatic steatosis analysis
Previously, we reported that SND1 could regulate the cholesterol metabolism of mice by promoting the activity of sterol regulatory element-binding protein 2 under the condition of HFD [Citation13]. Also, the highly expressed SND1 expression affects the cholesterol distribution and homeostasis of hepatocellular carcinoma cells [Citation29]. To this end, we sought to detect the cholesterol level of both WT and SND1 LKO mice. Unexpectedly, we did not observe the statistical difference of the total cholesterol (), P = 0.497) or free cholesterol (), P = 0.425) level between WT and SND1 LKO mice on either chow or high-fat diet. Furthermore, the H&E staining data of liver sections ()) indicated a significant increase in fat vacuoles of HFD mice compared with that of CD mice. However, we did not observe a significant difference between WT and SND1 LKO mice. This suggested that hepatocyte-specific deletion of SND1 is unlikely to modulate the cholesterol level and hepatic steatosis of mice.
3.5. Hepatic failure analysis
It has been reported that SND1 is related to the inflammation response [Citation18]. We thus sought to investigate the potential effect of SND1 hepatocyte-specific deletion on the LPS/D-GalN-induced acute liver failure of mice. The serum levels of ALT or AST were measured. Compared with the NS control group, we observed an increased level of ALT in both WT (), P = 0.023) and SND1 LKO (P = 0.017) mice under 6 h of LPS/D-GalN stimulation. Nevertheless, there was no statistical difference between WT and SND1 LKO mice ()). Moreover, we observed that LPS/D-GalN stimulation led to an increase AST level in the WT mice (), P = 0.028), but not LKO mice (), P > 0.05). There was also no statistical difference of AST between WT and LKO mice ()).
The quantitative RT-PCR assay was conducted to measure the levels of three inflammatory cytokines, including IL-6, IL-1β, and TNF-α. As shown in ), the LPS/D-GalN treatment could induce an increased level of IL-6 expression in both WT (P = 0.002) and SND1 LKO (P = 0.017) mice. Similar results were obtained for the IL-1β (), P = 0.001 for WT; P = 0.004 for LKO) and TNF-α (), P = 0.003 for WT; P = 0.034 for LKO). Consistently, there was no statistical difference of IL-6, IL-1β, and TNF-α in the presence and absence of hepatic SND1 (–e)). We further performed an H&E staining assay to assess the effect of LPS/D-GalN on the histomorphology of liver tissue and explored the potential influence of hepatocyte-specific deletion of SND1 on the LPS/D-GalN-induced liver damage. As shown in ), LPS/D-GalN treatment led to significant liver damage (e.g., liver tissue hemorrhage and inflammatory cell infiltration) in SND1 LKO mice, compared with the WT mice. Nevertheless, we failed to observe the statistically significant differences regarding the extent of liver damage between WT and SND1 LKO mice. Taken together, the current results suggest that hepatocyte SND1 is unable to contribute to altering hepatic inflammatory tones and tissue damage in acute liver failure of mice.
3.6. Further analysis of external GEO datasets
In addition to the above in vivo animal experiments that showed SND1 loss of function in the liver is incapable of changing the phenotypes in either insulin resistance or acute liver failure of mice, we sought external validation on various species of samples by utilizing the accessible datasets in terms of HFD-induced insulin resistance or ALF from GEO or Array Express database. After database retrieval, we got access to six insulin resistance-related human datasets, including GSE23343, GSE160646, GSE120243, GSE48794, GSE13271, and GSE151268, among which is GSE23343 that contains the expression data of SND1 in the liver tissues of seven T2D patients with insulin resistance and ten negative controls. Thus, we analyzed the expression feature of SND1 and failed to observe the statistical difference (), P = 0.81). For other GEO datasets, the SND1 expression level in the liver or white adipose tissues of HFD-induced mice or rat models was screened out. Still, we observed a similar negative correlation in mouse or rat samples (–e) and Figure S1a-d, P > 0.05), albeit the liver tissues of WistarKyoto rats at 8 w (), P = 0.015) and the white adipose tissues of GotoKakizake rats at 12 w (Figure S1c, P = 0.002).
In addition, we obtained three ALF-related datasets (GSE62026, GSE120652, and GSE38941) that contain the SND1 expression data in the liver tissue of clinical patients with ALF. As shown in , there was no statistical significance between ALF and control, even though we detected a decreased trend in the liver tissues of patients with ALF, compared with controls (all P > 0.05). Overall, the hepatic expression of SND1 in pathological models of insulin resistance and acute liver failure remains stable, indicating a dispensable role of endogenous SND1 in nonmalignant hepatocytes.
3.7. Enrichment analysis of SND1-related partners
Previously, we performed a microarray assay using the HepG2 stable cell lines with the knockdown of SND1 [Citation12], from which the related chip data was accessed in the GEO database with the accession number ‘GSE114447’ [Citation12]. As shown in Figure S2a, a total of 2,180 up-regulated and 1,228 down-regulated mRNA or lncRNA were identified. Our KEGG enrichment data (Figure S2b) showed the association between the SND1-related genes and the pathways of ‘fatty acid metabolism’/‘cholesterol biosynthesis’/‘glycerolipid metabolism’. Further, the ‘phospholipid binding’ issue was enriched in the ‘GO_molecullar function’ analysis (Figure S3). We did not observe the significant enrichment of glucose homeostasis or ALF-related issues. Besides, we performed the GO and KEGG enrichment analyses of SND1-binding partner [Citation25] and identified a series of RNA metabolism-related issues, but not the pathways related to glucose homeostasis or hepatic failure (Figure S4-S7). Given the close links or multicellular synergism between glucose and lipid metabolism [Citation30], SND1 in different organs is likely to cooperate in regulating glucose homeostasis by altering the expression of a set of lipid metabolism-related RNA transcripts under specific stress conditions.
4. Discussion
Although we have previously implicated gain of function of SND1 in improving insulin resistance in the global SND1 transgenic mice in an HFD-induced mouse model [Citation13], the loss of function of SND1 in the liver in regulating pathophysiologic function is unclear. In this study, we successfully constructed SND1 liver-specific knockout mice for the first time and investigated the potential role of endogenous SND1 in an HFD-induced liver insulin resistance model and acute liver failure model. We failed to observe the significant difference in phenotypes from either liver insulin resistance or acute liver failure between WT and SND1 LKO mice, even though there is somewhat an improved effect of SND1 on the activation of the Akt pathway upon insulin stimulation in the liver from HFD-mice. Based on the GEO datasets, there was no differential SND1 expression between normal and pathologic samples, suggesting a dispensable role of endogenous SND1 in nonmalignant hepatocytes. This is in accordance with our previous study in which we have shown that the improved cholesterol homeostasis in HFD-fed transgenic mice is attributable to the less repressive impact on the cholesterol pathway caused by HFD instead of an inductive influence [Citation13]. The hepatic and global insulin sensitivity derived from HFD-transgenic mice is likely to dominate cholesterol homeostasis rather than endogenously hepatic SND1 itself, which also rendered us speculate the dispensable role of SND1 from normal hepatocytes in regulating cholesterols. Therefore, it appears that the synergistic action of SND1 in multiple organs contributes to the alteration of the metabolic phenotype.
In this study, we observed the decreased weight of white adipose tissue in the SND1 liver conditional knockout mice under the condition of a high-fat diet, but not the gross morphology, body weight, and liver weight. Although the hepatocyte-specific deletion of SND1 does not remarkably influence liver insulin resistance, it is clearly warranted to analyze further the potential effects of SND1 in adipose or muscle tissues. Some studies hint at the possible link between cholesterol metabolism and SND1 expression. Based on the global SND1 transgenic mice, we previously identified the promotive role of SND1 in cholesterol homeostasis, solely under the treatment of a high-fat diet but not the chow diet [Citation13]. In line with our previous data, this study shows no alteration of cholesterols when SND1 is deficient in hepatocytes. Intriguingly, some reflections on malignant hepatic cells have shown the opposite. In hepatocellular carcinoma, the up-regulation of SND1 expression can influence the cellular cholesterol distribution and homeostasis [Citation29]. The overexpression of SND1 protein in hepatoma cells contributes to the accumulation of cholesteryl esters, leading to more cholesterol esterification via fatty acid and the limitation of triglyceride synthesis [Citation31]. This phenomenon was not observed here in the SND1 liver-specific knockout mice. How to explain this? We believe that metabolic reprogramming is essential for maintaining the growth and proliferation of cancer cell [Citation32], which may partly explain the difference between hepatoma cells and mice normal hepatocytes.
LPS from gram-negative bacteria is implicated in the pathogenesis of ALF [Citation33]. LPS interacts with CD14 and Toll-like receptor 4 to activate inflammatory signals and induce the secretion of pro-inflammatory cytokines, which stimulates the infiltration of inflammatory cells into the liver [Citation34–36]. SND1 is reported to be associated with activation of NF-κB that involves a chronic inflammatory state leading to HCC [Citation18,Citation37–39]. Here, we aimed at further investigating whether the hepatocyte-specific deletion of SND1 in mice affects the presence of acute liver failure induced by LPS/D-GalN. Our results did not show the remarkable difference for the LPS/D-GalN-induced secretion of the pro-inflammatory cytokines (IL-1β, IL-6, and TNF-α) and acute liver failure histomorphology between WT and SND1 LKO mice. Upon stimulation by LPS, the liver resident macrophages, named Kupffer cells, mainly initiate the inflammatory response by secreting pro-inflammatory cytokines, such as IL-1β, IL-6, and TNF-α [Citation40,Citation41]. Although hepatocyte-specific deletion of SND1 does not remarkably influence the presence of acute liver failure, it is still worth a study to further analyze the potential effects of SND1 in the global deletion mice.
Our findings demonstrate a dispensable role of hepatic endogenously SND1 in insulin resistance and acute liver failure. However, no more than 10 mice with SND1 knocked out were finally enrolled for our analyses due to our limited experimental condition. The variation across the mice weakens the effectiveness of statistical analyses to some extent. Thus, we try to remove the possible effect of a single outlier and comprehensively assess the influence of hepatocyte-specific SND1 deletion in the glucose homeostasis through a set of assays, such as fasting/refeeding assay, glucose and insulin tolerance, and acute insulin response. Additionally, we analyzed the potential correlations of SND1 expression with insulin resistance and acute liver failure in the species of humans, mice, and rats, based on a set of GEO datasets. The potential pathway enrichment analyses of SND1 interacting or related partners were performed as well, respectively. The negative but reliable conclusions were considered in this work. However, the synergistic mechanism of multiple organs regarding the role of SND1 in insulin sensitivity and inflammatory response still merits further experiments.
5. Conclusion
In summary, we, for the first time, successfully established a mouse model of SND1 LKO, which serves as a valuable tool for further investigating the role of hepatic SND1. Our in vivo experimental results suggest a dispensable role of endogenously hepatic SND1 in the HFD-induced insulin resistance or LPS/D-GalN-induced acute liver failure in mice. The SND1 synergistic action from multiple organs may contribute to the liver insulin sensitivity or inflammatory response during stress.
Highlight
The first successful construction of liver SND1 conditional knockout mice.
Hepatocyte-specific SND1 deletion cannot affect HFD-induced liver insulin resistance.
There is no difference in LPS/D-GalN-induced ALF between LKO and WT mice.
SND1-binding partners or related genes are related to RNA or lipid metabolism.
SND1 of multiple organs may synergistically regulate insulin sensitivity.
Supplemental Material
Download ()Disclosure statement
No potential conflict of interest was reported by the author(s).
Availability of data and materials
The datasets used and/or analyzed during the current study are available from the corresponding author on reasonable request. The authors gratefully acknowledge the contributions of datasets within GEO database, including GSE23343, GSE160646, GSE120243, GSE48794, GSE13271, GSE151268, GSE62026, GSE120652, GSE38941.
Supplementary material
Supplemental data for this article can be accessed here.
Additional information
Funding
Related Research Data
References
- Gutierrez-Beltran E, Denisenko TV, Zhivotovsky B, et al. Tudor staphylococcal nuclease: biochemistry and functions. Cell Death Differ. 2016;23(11):1739–1748.
- Shaw N, Zhao M, Cheng C, et al. The multifunctional human p100 protein ‘hooks’ methylated ligands. Nat Struct Mol Biol. 2007;14(8):779–784.
- Duan Z, Zhao X, Fu X, et al. Tudor-SN, a novel coactivator of peroxisome proliferator-activated receptor gamma protein, is essential for adipogenesis. J Biol Chem. 2014;289(12):8364–8374.
- Gao X, Fu X, Song J, et al. Poly(A)(+) mRNA-binding protein Tudor-SN regulates stress granules aggregation dynamics. FEBS J. 2015;282(5):874–890.
- Gao X, Zhao X, Zhu Y, et al. Tudor staphylococcal nuclease (Tudor-SN) participates in small ribonucleoprotein (snRNP) assembly via interacting with symmetrically dimethylated Sm proteins. J Biol Chem. 2012;287(22):18130–18141.
- Su C, Zhang C, Tecle A, et al. Tudor staphylococcal nuclease (Tudor-SN), a novel regulator facilitating G1/S phase transition, acting as a co-activator of E2F-1 in cell cycle regulation. J Biol Chem. 2015;290(11):7208–7220.
- Yu L, Liu X, Cui K, et al. SND1 acts downstream of TGFbeta1 and upstream of Smurf1 to promote breast cancer metastasis. Cancer Res. 2015;75(7):1275–1286.
- Su C, Gao X, Yang W, et al. Phosphorylation of Tudor-SN, a novel substrate of JNK, is involved in the efficient recruitment of Tudor-SN into stress granules. Biochim Biophys Acta Mol Cell Res. 2017;1864(3):562–571.
- Fu X, Zhang C, Meng H, et al. Oncoprotein Tudor-SN is a key determinant providing survival advantage under DNA damaging stress. Cell Death Differ. 2018;25(9):1625–1637.
- Yang J, Valineva T, Hong J, et al. Transcriptional co-activator protein p100 interacts with snRNP proteins and facilitates the assembly of the spliceosome. Nucleic Acids Res. 2007;35(13):4485–4494.
- Gao X, Ge L, Shao J, et al. Tudor-SN interacts with and co-localizes with G3BP in stress granules under stress conditions. FEBS Lett. 2010;584(16):3525–3532.
- Cui X, Zhao C, Yao X, et al. SND1 acts as an anti-apoptotic factor via regulating the expression of lncRNA UCA1 in hepatocellular carcinoma. RNA Biol. 2018;15(10):1364–1375.
- Wang X, Xin L, Duan Z, et al. Global Tudor-SN transgenic mice are protected from obesity-induced hepatic steatosis and insulin resistance. FASEB J. 2019;33(3):3731–3745.
- Haeusler RA, McGraw TE, Accili D. Biochemical and cellular properties of insulin receptor signalling. Nat Rev Mol Cell Biol. 2018;19(1):31–44.
- Lebeaupin C, Vallee D, Hazari Y, et al. Endoplasmic reticulum stress signalling and the pathogenesis of non-alcoholic fatty liver disease. J Hepatol. 2018;69(4):927–947.
- Yin J, Ding J, Huang L, et al. SND1 affects proliferation of hepatocellular carcinoma cell line SMMC-7721 by regulating IGFBP3 expression. Anat Rec (Hoboken). 2013;296(10):1568–1575.
- Yoo BK, Santhekadur PK, Gredler R, et al. Increased RNA-induced silencing complex (RISC) activity contributes to hepatocellular carcinoma. Hepatology. 2011;53(5):1538–1548.
- Jariwala N, Rajasekaran D, Mendoza RG, et al. Oncogenic role of SND1 in development and progression of hepatocellular carcinoma. Cancer Res. 2017;77(12):3306–3316.
- Palacios L, Ochoa B, Gomez-Lechon MJ, et al. Overexpression of SND p102, a rat homologue of p100 coactivator, promotes the secretion of lipoprotein phospholipids in primary hepatocytes. Biochim Biophys Acta. 2006;1761(7):698–708.
- Garcia-Arcos I, Rueda Y, Gonzalez-Kother P, et al. Association of SND1 protein to low density lipid droplets in liver steatosis. J Physiol Biochem. 2010;66(1):73–83.
- Bernal W, Wendon J. Acute liver failure. N Engl J Med. 2013;369(26):2525–2534.
- Wang T, Wang Z, Yang P, et al. PER1 prevents excessive innate immune response during endotoxin-induced liver injury through regulation of macrophage recruitment in mice. Cell Death Dis. 2016;7(4):e2176.
- Thawley V. Acute Liver Injury and Failure. Vet Clin North Am Small Anim Pract. 2017;47(3):617–630.
- Gao X, Zhao C, Zhang N, et al. Genetic expression and mutational profile analysis in different pathologic stages of hepatocellular carcinoma patients. BMC Cancer. 2021;21(1):786.
- Cui X, Zhang X, Liu M, et al. A pan-cancer analysis of the oncogenic role of staphylococcal nuclease domain-containing protein 1 (SND1) in human tumors. Genomics. 2020;112(6):3958–3967.
- Yu G, Wang LG, Han Y, et al. clusterProfiler: an R package for comparing biological themes among gene clusters. Omics. 2012;16(5):284–287.
- Yang Y, Long X, Li G, et al. Prediction of clinical prognosis in cutaneous melanoma using an immune-related gene pair signature. Bioengineered. 2021;12(1):1803–1812.
- Mackenzie RW, Elliott BT. Akt/PKB activation and insulin signaling: a novel insulin signaling pathway in the treatment of type 2 diabetes. Diabetes Metab Syndr Obes. 2014;7:55–64.
- Navarro-Imaz H, Rueda Y, Fresnedo O. SND1 overexpression deregulates cholesterol homeostasis in hepatocellular carcinoma. Biochim Biophys Acta. 2016;1861(9 Pt A):988–996.
- Chen L, Chen XW, Huang X, et al. Regulation of glucose and lipid metabolism in health and disease. Sci China Life Sci. 2019;62(11):1420–1458.
- Navarro-Imaz H, Chico Y, Rueda Y, et al. Channeling of newly synthesized fatty acids to cholesterol esterification limits triglyceride synthesis in SND1-overexpressing hepatoma cells. Biochim Biophys Acta Mol Cell Biol Lipids. 2019;1864(2):137–146.
- Santos CR, Schulze A. Lipid metabolism in cancer. FEBS J. 2012;279(15):2610–2623.
- Jirillo E, Caccavo D, Magrone T, et al. The role of the liver in the response to LPS: experimental and clinical findings. J Endotoxin Res. 2002;8(5):319–327.
- Wu Z, Han M, Chen T, et al. Acute liver failure: mechanisms of immune-mediated liver injury. Liver Int. 2010;30(6):782–794.
- Claria J, Arroyo V, Moreau R. The acute-on-chronic liver failure syndrome, or when the innate immune system goes astray. J Immunol. 2016;197(10):3755–3761.
- Kitazawa T, Tsujimoto T, Kawaratani H, et al. Therapeutic approach to regulate innate immune response by Toll-like receptor 4 antagonist E5564 in rats with D-galactosamine-induced acute severe liver injury. J Gastroenterol Hepatol. 2009;24(6):1089–1094.
- Arretxe E, Armengol S, Mula S, et al. Profiling of promoter occupancy by the SND1 transcriptional coactivator identifies downstream glycerolipid metabolic genes involved in TNFalpha response in human hepatoma cells. Nucleic Acids Res. 2015;43(22):10673–10688.
- Santhekadur PK, Das SK, Gredler R, et al. Multifunction protein staphylococcal nuclease domain containing 1 (SND1) promotes tumor angiogenesis in human hepatocellular carcinoma through novel pathway that involves nuclear factor kappaB and miR-221. J Biol Chem. 2012;287(17):13952–13958.
- Armengol S, Arretxe E, Rodriguez L, et al. NF-kappaB, Sp1 and NF-Y as transcriptional regulators of human SND1 gene. Biochimie. 2013;95(4):735–742.
- Mencin A, Kluwe J, Schwabe RF. Toll-like receptors as targets in chronic liver diseases. Gut. 2009;58(5):704–720.
- Heymann F, Tacke F. Immunology in the liver–from homeostasis to disease. Nat Rev Gastroenterol Hepatol. 2016;13(2):88–110.