
ABSTRACT
Cells of the tumor microenvironment exert a vital influence on sarcoma prognosis. This study aimed to analyze and identify differentially expressed genes (DEGs) related to immunity and their significance as immune biomarkers for the accurate prediction of overall survival of patients with sarcoma. The Cancer Genome Atlas was adopted for obtaining sarcoma gene microarray and corresponding clinical information. ESTIMATE algorithm was used to calculate tumor immune microenvironment indices. Immune-associated DEGs were identified using the limma packages and were further analyzed using the ClusterProfiler package and STRING website. Based on the results of these analyses, we constructed a prognostic model. Furthermore, we assessed the prognosis prediction model through functional evaluation and analysis of GSE17674. The functional analysis revealed that the upregulated immune DEGs were related to immune-related aspects. Chemokine ligands/receptors and immune-related genes were found to be vital for sarcoma formation and progression. We established a prognostic signature of seven genes, which indicated that high-risk cases exhibit poor prognostic outcome. The prognostic signature constructed in this study can accurately predict the overall prognosis in patients with sarcoma. Moreover, the novel immune gene expression analysis may provide clinical guidance for predicting prognosis in patients with sarcoma.
Introduction
Sarcomas that originate from the mesenchymal tissues are malignant and consist of 50 different subtypes, with a high degree of histological heterogeneity within each subtype. Currently, the number of patients with sarcoma is more than 10,000, and approximately 3800 sarcoma-related fatalities per year are reported in the United States [Citation1]. Poor prognosis of sarcomas can be attributed to their extremely high recurrence rates, even after initial surgical resection. Additionally, the pathological mechanism of sarcomas remains poorly understood to date.
The tumor microenvironment (TME) is the cellular environment composed of extracellular matrix molecules, endothelial, mesenchymal, and tumor-infiltrating immune cells, and inflammatory mediators [Citation2]. It provides metabolites and controls the proliferation and spread of many tumors. The TME has been reported to considerably affect gene expression in tumor tissues [Citation3–6]. Stroma and immune cells account for two major nontumour components in TME, and these cells play essential roles in the diagnostic, prognostic, and overall survival (OS) assessment of tumors [Citation7–9].
We hypothesized that sarcoma microenvironment and immune-related genes play a role in the pathogenesis and prognosis of sarcomas. Thus, in the present study, we explored the role of sarcoma microenvironment and immune genes in sarcomas and constructed risk models by using immune genes to predict the prognosis of patients with sarcomas. We performed the ESTIMATE algorithm [Citation5] analysis to determine the relative indices of TME of sarcomas from The Cancer Genome Atlas (TCGA) [Citation10,Citation11]. The limma package was used to calculate the immune DEGs based on their immune scores. IMMPORT data were used to screen immune cells. Finally, immune genes were incorporated to construct a prognosis prediction model.
Materials and methods
Data sources
Both sarcoma gene microarray data and clinical information (including age, sex, histological type, survival, and outcome) were downloaded from TCGA (https://portal.gdc.cancer.gov/).
Data processing
The standardization of gene expression was performed in R software (version 4.0.0), whereas the indices of TME, including immune and stromal scores, were obtained using the ESTIMATE algorithm [Citation5]. The limma package [Citation12] was used to analyze DEGs, with the criteria of adjusted p value ≤ 0.05 and |logFC| ≥ 1.5 indicating statistical significance.
Functional enrichment analysis
Gene Ontology (GO) analysis is widely performed in bioinformatics to annotate large quantities of genes and their expression products after translation [Citation13]. Kyoto Encyclopedia of Genes and Genomes (KEGG) is used to analyze the pathways in which certain genes are enriched [Citation14]. In this study, the ClusterProfiler package [Citation15], one of the R packages, was used for both GO and KEGG enrichment analyses.
Construction of a protein–protein interaction network
A protein–protein interaction (PPI) network was constructed using DEGs imported into the STRING database [Citation16] (https://string-db,org/) at the confidence level of 0.700. Further, the final PPI networks data were downloaded and input into Cytoscape software [Citation17] (version 3.7.1) to reconstruct and further analyze the PPI network. The PPI sub-networks, with both the number of nodes and Molecular Complex Detection (MCODE) scores being >10, were analyzed using the MCODE plug-in.
Immunohistochemistry
The collected samples from the tumor and adjacent samples were subjected to 10% formalin fixation and paraffin embedding. The gene expression was detected through EnVision immunohistochemistry [Citation18]. The antibodies and concentrations used were: anti-CCR2 rabbit polyclonal antibody (D260151; 1:50 dilution); anti-CCR4 rabbit polyclonal antibody (D162858; 1:400 dilution); and anti-CCR5 rabbit polyclonal antibody (D161519; 1:15 dilution). All the antibodies were obtained from Sangon Biotech Co. Ltd. Shanghai, China. The study was approved by the Ethics Committee of The First Affiliated Hospital of Guangxi Medical University, China [Approval Number: 2021(KY-E-130)].
Analysis of immune-related genes and establishment of a prognostic model
The shared IMMPORT data [Citation19] (https://www.immport.org/) enable searching and downloading of biomedical research data, which were used in this study to obtain data regarding immune-related genes. Furthermore, the collected genes were combined with the immune DEGs to obtain immune genes related to sarcoma. Associations between the expression of immune-related genes and OS were analyzed through the univariate regression analysis. Genes were considered prognostically significant only when the p value was <0.05 and the corresponding levels were markedly associated with OS. Immune-related genes for prognosis prediction were selected using a ‘step-by-step’ approach to establish the prognosis prediction model [Citation20]. Using OS as the dependent variable, immune-related genes for prognosis prediction were fitted through multivariate regression for evaluating their corresponding contributions to OS prediction. The risk score prognosis prediction model was established according to relevant gene expression, with corresponding gene levels as linear combination and coefficient of multivariate regression (α) as weight. The cases were classified into low – or high-risk groups based on the median risk score value.
Evaluation and verification of the prognostic model
R package SurvivalROC was used to test the reliability of the constructed prognosis model based on receiver operating characteristic (ROC) analysis [Citation21,Citation22]. Furthermore, univariate and multivariate regression analyses were performed for better evaluation of the model’s degrees of independence. Additionally, the prognostic assessments were performed on the sarcoma data obtained from Gene Expression Omnibus (GEO; https://www.ncbi.nlm.nih.gov/geo/). The acquired patients’ clinical information along with the genes and risk scores were analyzed to construct a nomogram by using R with the survival and RMS packages. Nomograms can be used to predict the survival probability for patients with sarcoma after disease onset.
Statistical analysis
The limma and ClusterProfiler packages were used based on a false discovery rate (FDRs, that is, adjusted p value) of ≤0.05 to adjust for the multivariate Cox regression analysis, and the FDR was controlled using the Benjamini–Hochberg programme [Citation23]. Univariate analysis was conducted using the log-rank test, and the Pearson correlation coefficient was used to analyze the co-expression relationships. A p value of <0.05 was considered statistically significant. All statistical analyses were performed using GraphPad Prism (Version 8), SPSS (version 22.0), and R software (version 4.0.0).
Results
To better understand the immune microenvironment and the possible underlying mechanism through which it contributes to sarcomas, we analyzed the sarcoma data downloaded from TCGA database to calculate the immune and stromal scores and identified the DEGs between the high – and low-score groups. PPI analysis showed that the C-C motif chemokine receptor (CCR) genes were closely related to sarcoma. By using the IMMPORT data, sarcoma-related immune genes were obtained that were used to construct risk models. Risk models can accurately predict the prognosis of patients with sarcoma. And the risk model constructed in this study also performed well in GEO dataset.
The relationship of clinical data with scores
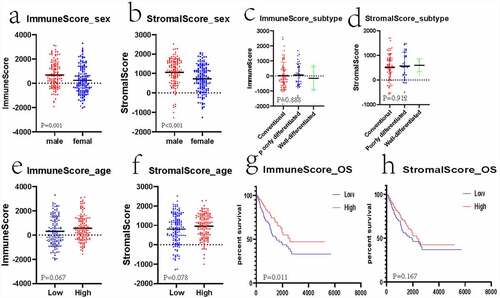
A total of 263 gene microarray samples and the clinical data were obtained from TCGA. Of these, 119 (45.25%) cases were of male patients and 144 (54.75%) cases were of female patients. The age of patients ranged from 20 to 90 years (mean: 60.56 ± 14.63). A total of 158 (60.08%) inconclusive histological cases were identified, of which the conventional leiomyosarcoma histological subtype accounted for 67 (25.48%) cases; poorly differentiated, pleomorphic, or epithelioid leiomyosarcoma accounted for 34 (12.93%) cases; and well-differentiated leiomyosarcoma accounted for 4 (1.52%) cases. The number of cases with positive tumor margins was 74 (28.14%), that of cases with negative tumor margins was 139 (52.85%), and that of cases with unknown or incomplete data on tumor margins was 50 (19.01%). The clinical data are presented in the Supplement 1.xlsx. The ESTIMATE algorithm analysis indicated that the range of immune scores was from −2039.13 to 3295.15 (mean: 433.88 ± 1116.81) and that of the stromal scores was from −1275.33 to 2519.30 (mean: 882.36 ± 718.82). The mean immune score significantly increased compared with the mean stromal score (p < 0.001). Moreover, the results revealed that male patients had higher stromal/immune scores than female patients (, p < 0.05). The correlation between different subtypes and the stromal/immune scores was not statistically significant (, p > 0.05). All the cases were classified into the high – or low-stromal/immune score group based on the corresponding stromal/immune scores. The relationship between the age and score was not statistically significant (, p > 0.05). According to the Kaplan–Meier analysis, the low stromal/immune scores predicted dismal OS. However, the relationship between stromal scores and OS was not statistically significant (), p < 0.05; ), p > 0.05).
Figure 1. Associations of clinical information with stromal/immune scores of patients with sarcoma
Identification of significant DEGs
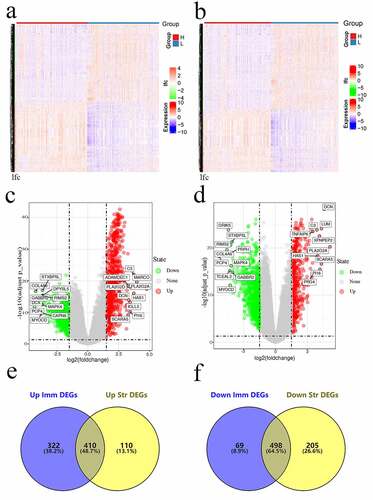
The limma package was employed to analyze the association of gene levels with stromal/immune scores by examining DEGs. The heatmaps of DEGs obtained using the heatmap package are shown in . We drew a volcano plot of DEGs and set | logFC | > 1.5 and FDR < 0.05. A total of 1299 DEGs were detected between high – and low-immune score groups. Of these, 732 genes were upregulated and 567 genes were downregulated. Altogether, we detected 1223 DEGs between high – and low-stromal score groups, with 520 genes being upregulated and 703 genes being downregulated. Furthermore, 410 overlapped genes with upregulation and 498 genes with downregulation were identified between immune and stromal DEGs ().
Figure 2. Gene levels in sarcoma and related scores. Heatmaps (a and b), volcanos (c and d), and Venn diagrams (e and f) regarding DEGs of high – versus low-stromal/immune score groups
The functional analysis of DEGs
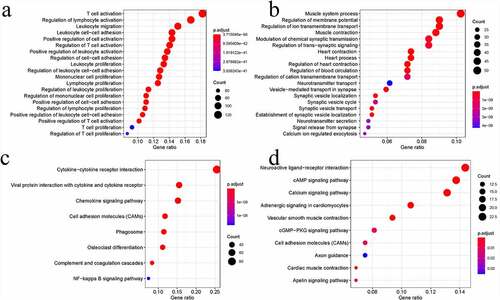
To analyze the associations of immunity with sarcoma cells, we investigated the in-depth function of DEGs by analyzing both immune score groups. Altogether, 732 upregulated genes and 567 downregulated genes were analyzed using the ClusterProfiler package. The GO terms consisted of Biological process, Molecular function, and Cellular component aspects and processes. After analysis, 732 upregulated genes were found to be enriched in 1193 GO terms (n = 1015 in Biological process, n = 102 in Molecular function, and n = 76 in Cellular component). The GO analysis indicated that most upregulated DEGs were related to the growth, adhesion, and activation of immune cells ()). This finding further underlined the functional significance of immune cell processes in sarcoma development. Altogether, 567 downregulated DEGs were enriched in 477 GO terms (n = 324 in Biological process, n = 48 in Molecular function, and n = 105 in Cellular component). Clearly, these downregulated DEGs were mostly related to muscle contraction ()). The KEGG pathway analysis indicated that these upregulated DEGs were mostly related to the interaction of viral protein with cytokine/cytokine receptor, cell adhesion molecules (CAMs), cytokine–cytokine receptor interaction, osteoclast differentiation, and chemokine signaling ()). Meanwhile, those downregulated DEGs were mostly related to cardiac muscle contraction, calcium pathway, vascular smooth muscle contraction, cAMP pathway, and adrenergic signaling in cardiomyocytes ()).
Figure 3. Functional analysis of DEGs. Bubble charts showing the 20 most significant GO terms among DEGs (a and b). Bubble charts showing the KEGG pathways among DEGs (c and d)
PPI network construction
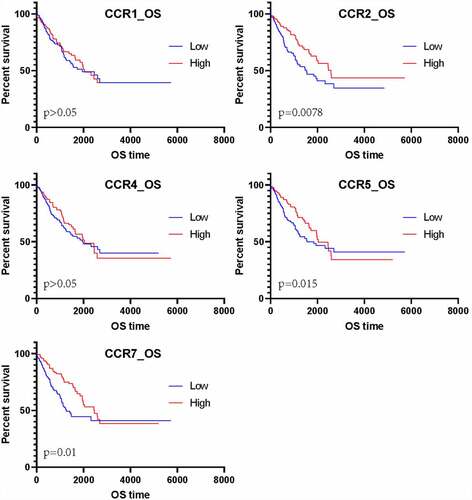
To further understand the DEG interactions, the PPI network was constructed. Using the STRING data, we reconstructed PPI networks by incorporating the upregulated and downregulated DEGs with Cytoscape (Supplement 1–2). The PPI networks were further analyzed using the MCODE plug-in. Upon the thresholds of nodes ≥ 10 and Density*#Nodes score ≥ 10, we acquired four sub-networks based on the upregulated DEG PPI networks and 1 subnet from the downregulated DEG PPI networks (). Of the PPI sub-networks constructed by incorporating downregulated DEGs, GNG4 exhibited the greatest score of 24, followed by ADCY2 and ADCY5 (both with a degree of 17). The GO results indicated that the upregulated DEGs were mostly associated with immune activity. Sub-network 1 related to the upregulated DEGs displayed the most edges and greatest scores but only 36 nodes. Therefore, this network was analyzed in detail; FPR2 had the highest degree (72), followed by C3 (degree = 66), C3AR1 (degree = 66), CXCL8 (degree = 66), CCR5 (degree = 65), CCR7 (degree = 65), CCR2 (degree = 59), CXCL1 (degree = 59), CXCL10 (degree = 57), and CXCR3 (degree = 57). Among the top 10 genes, CCRs and CXCLs each accounted for three genes. The CCRs and CXCLs accounted for 5 and 8 genes, respectively, in the top 1 subnet. Additionally, the CCL gene, with six genes, was significantly enriched in the top 1 subnet. As suggested by the matrix diagram for Pearson’s correlation, the levels of CCR family genes and certain CCL and CXCL family genes were tightly related to the correlation coefficient ≥ 0.5 (). The number in each grid represented the correlation coefficient between each gene. Furthermore, our results indicated that the high expression of CCR genes corresponds to better short-term survival, although CCR1 and CCR4 did not exhibit any statistical significance ().
Figure 4. PPI sub-networks. (a–c) indicate the 3 PPI sub-networks constructed by the most significantly upregulated DEGs. (d) shows the PPI sub-network constructed by the downregulated DEGs. Node size stands for the connectivity degree. Blue and red colors indicate downregulated and upregulated genes, respectively. Color depth stands for fold change size. Edge thickness stands for combined score
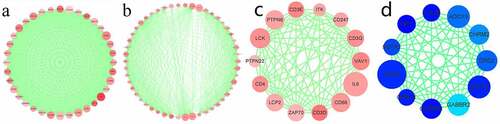
Figure 5. Matrix graphs for Pearson’s correlation analysis. a, b, and c are CCR gene, CXCL gene, and CCL gene, respectively. The correlations coefficients between the genes are shown in grid
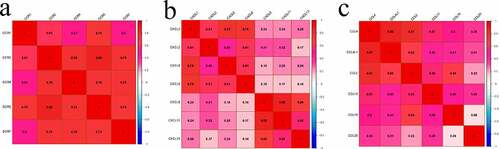
Figure 6. The survival analysis of CCR genes in sarcoma
CCR family genes were protective factors
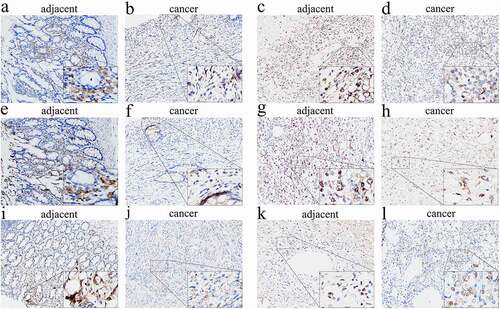
To further evaluate our results, we randomly selected CCR2, CCR4, and CCR5 belonging to the CCR family for immunohistochemical verification. The expressions of CCR genes within tumor and matched noncarcinoma tissue samples in patients with leiomyosarcoma and synovial sarcoma were examined. The immunohistochemical analysis results showed that the expressions of CCR2, CCR4, and CCR5 were considerably lower in cancer tissues than in paracancerous tissues (). This result suggested that such genes exhibit a low expression level within tumor tissues, thus indirectly supporting our conclusion that patients with high expressions of CCR family genes have a better short-term survival prognosis, thereby indicating the protective nature of these genes.
Figure 7. Immunohistochemical evaluation of CCR family protein expression in cancer and adjacent tissues. CCR2 in leiomyosarcoma (a) and synovial sarcoma (b). CCR4 in leiomyosarcoma (c) and synovial sarcoma (d). CCR5 in leiomyosarcoma (e) and synovial sarcoma (f). The expression of CCRs in tumor tissues is weaker than that in adjacent tissues in the same tumor at 200× magnification. The picture at the bottom right of each slice image is magnified 10 times again
Construction of an immune-related gene signature
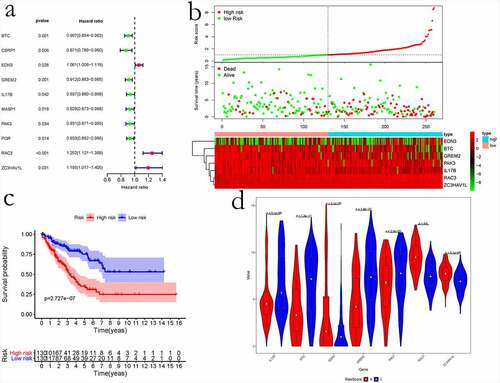
Immune scores were calculated to analyze DEGs. To better understand immune-related genes involved in sarcoma, we obtained corresponding immune-related genes from IMMPORT and intersected them with our obtained DEGs. Overall, 85 sarcoma immune-related genes were obtained. Afterward, the univariate regression analysis was performed to examine the relationships of immune gene levels with OS of sarcoma cases. Lastly, 10 genes were identified as the prognosis-related immune genes, and their optimal combination was analyzed through the ʻstep-by step’ function ()). Finally, a prognostic model was constructed using the seven prognosis-related immune genes, namely EDN3, BTC, IL17B, GREM2, ZC3HAV1L, RAC3, and PAK3 (). Based on our prognostic model, we classified the cases into two groups, namely low – and high-risk score groups. Consequently, cases with high-risk scores exhibited poor prognosis compared with those having low-risk scores (). The expression of seven prognostic immune genes in the high – and low-risk groups was examined using the Wilcoxon rank sum test. The results revealed that the difference in the expression of seven prognostic immune genes was significant between the two groups ()).
Table 1. Immune-related gene-based sarcoma prognosis prediction model
Figure 8. The prognostic risk assessment of immune-related genes in sarcoma. (a) Univariate regression for immune genes. (b) RS values, distribution of survival status, and heatmap for the seven prognosis-related immune genes are shown from top to bottom. (c) Kaplan–Meier curves of the two groups. (d) Violin map of seven prognostic immune genes expressed in the high – and low-risk groups
Evaluation and verification of the immune gene-based prognostic model
Based on ROC curve analysis, the prognostic model constructed by incorporating immune genes exhibited excellent performance in predicting survival of patients with sarcoma, with an AUC (area under curve) of 0.765 ()). Univariate and multivariate regression analyses revealed that the risk score value is an independent factor for predicting the prognosis of sarcoma ()). Moreover, we obtained the GSE17674 dataset from the GEO database for analysis, which suggested that our constructed model is suitable for predicting survival of patients with sarcoma. GSE17674 contains the clinical data of 44 Ewing sarcoma patients. The Robust Multichip Average algorithm [Citation24] was used to standardize, normalize, and correct gene expression profiles. shows the Kaplan–Meier analysis for OS and event-free survival of patients in the high – and low – risk score groups in the GSE17674 dataset. The results revealed that both event-free survival and OS were poor in the high-risk score group, although the difference in event-free survival between the two groups was not significant (p > 0.05). After screening, a total of 83 patients with complete pathological classification and margin status were selected to construct a nomogram diagram. The nomogram diagram showed that the constructed risk model had a significant effect on survival prognosis, and the high expressions of CCR4 and CCR5 also were identified as the protective factors. However, CCR2 was identified as a risk factor in the nomogram diagram constructed for these 83 cases ().
Figure 9. Evaluation of the immune-related gene-based prognostic model. a, ROC analysis to predict sarcoma prognosis according to the risk score value. b, Univariate and multivariate regression analyses are shown from left to right
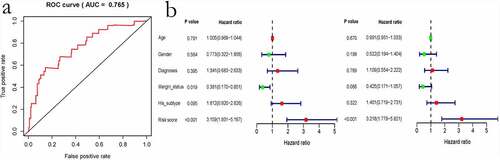
Figure 10. Kaplan–Meier analysis for event-free survival and overall survival in high – and low-risk patients with sarcoma derived from the GSE17674 dataset
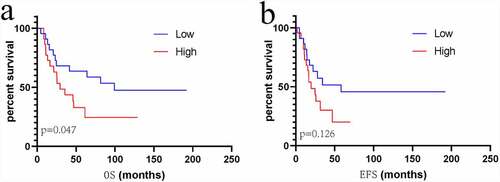
Figure 11. The nomogram for predicting 1-, 3 – and 5-year overall survival of sarcoma patient
Discussion
The treatment of sarcoma, a malignant tumor, is a nightmare for clinicians because of its high recurrence potential. The stromal and immune scores of CIBERSORT algorithm were used for analyzing the TME, which is significantly associated with tumor prognosis [Citation25,Citation26]. Runzhi Huang el at [Citation6] reported the association between TME and sarcoma recurrence. However, the present study used TCGA data to analyze the TME for predicting survival of patients with sarcoma. The function of immune-related DEGs was analyzed for better understanding the association among these genes. The results indicated that the immune-related DEGs with high expression levels were mostly related to the immune-related biological processes, such as T-cell activation regulation, T-cell activation, leukocyte proliferation, lymphocyte activation regulation, and leukocyte cell–cell adhesion. In addition, these DEGs were found to be related to immune pathways including the viral protein–cytokine/cytokine receptor interaction, cytokine–cytokine receptor interaction, osteoclast differentiation, chemokine pathway, phagosomes, CAMs, NF-κB pathway, complement and coagulation cascades, PI3K–Akt pathway, and arachidonic acid metabolism.
CCRs, CXCLs, and CCLs are significantly related to cell inflammation, immune surveillance, migration, and tumourigenesis [Citation27–29]. Several studies have reported that CCRs are associated with tumor growth [Citation30] through various molecular mechanisms [Citation31]. In PPI sub-network 1, wherein highly expressed immune DEGs were incorporated and which was analyzed using MCODE, genes in the CCR, CCL, and CXCL families, particularly the CCR family genes, showed distinct clusters and had obvious co-expression relationships. Cases with CCR gene upregulation demonstrated superior short-term survival. These results are consistent with those of studies by Zhou et al. and Zhang et al. Zhou et al. showed that CCRs are the protective genes in patients with early pancreatic ductal adenocarcinoma [Citation32]. Zhang et al. reported that high CCR expression in childhood osteosarcoma is associated with a better prognosis [Citation33]. However, other studies have demonstrated that the high expression of CCRs promotes tumor progression and indicates a poor prognosis [Citation34,Citation35]. In our study, survival analysis showed that the high expression of CCR family genes is associated with better short-term survival (). Additionally, immunohistochemical results showed that the expression levels of CCR2, CCR4, and CCR5 were higher in adjacent tissues than in cancer tissues. However, CCR2 was identified as a risk factor in the nomogram of 83 patients, although it was not as significant for the prognostic score as the risk model score. This can be ascribed to the following reasons: first, the less number of cases after screening might have lead to a different result; second, a nomogram diagram is a prediction method that integrates several indicators, and the influence of some of the included indicators might have lead to differences in the results for CCR2. Therefore, further analysis in the future should be performed by collecting basic clinical information. In our study, the highly expressed immune DEGs were enriched in both chemokine signaling and NF-κB signaling pathways. We believe that CCR genes and their ligand genes increase the DNA binding activity of NF-κB, κB-mediated luciferase activity, and TNF-α level depending on NF-κB [Citation36,Citation37]. CCR, one of the G-protein-coupled receptors expressed on the cell membrane, can inhibit tumor cell proliferation. CCR1 can inhibit the proliferation of human liver cancer cells [Citation38]. CCR5 decreases breast cancer development in a p53-dependent manner [Citation39]. CCR7-triggered migration of leukocytes has a crucial function in triggering immune response under normal conditions, and CCR7 can recruit the activated dendritic cells and innate T cells into the lymph nodes to stimulate the adaptive immunity [Citation40]. CCL19 is a type of CCR7 ligand [Citation41,Citation42] that activates T cells [Citation43]. Suppression of CCR7 genes can trigger the returning of T cells into secondary lymphoid organs experiencing severe impairment. Additionally, CXCL1 and CXCL2 have been shown to be related to the proliferation of cancers, including melanoma, gastric cancer, pancreatic cancer, adenocarcinoma, and lung cancer [Citation44,Citation45]. In our study, the CCR gene upregulation predicted longer short-term survival, although this association was not found to be significant in case of CCR1 and CCR4. In the later disease stage, patients displaying the upregulation of CCR family genes had poor survival. We assume that the TME was adversely affected due to tumor growth, and thus, the body was at a disadvantage.
To date, various prognostic models have been established based on molecular genes. Yang Liu et al. constructed an autophagy-related gene model to improve prognosis prediction in individual cases of non-small cell lung cancer [Citation46]. A prognostic model based on eight RNA binding proteins for lung adenocarcinoma was established by Wei Li et al [Citation47]. Previous prognostic signatures for sarcoma were constructed based on the age, tumor size, histological type, necrosis, tumor stage, and vascular invasion [Citation48,Citation49]. Rong-Quan He et al. predicted the clinical outcome and survival in patients with sarcoma by using a ten-lncRNA signature [Citation49]. Growing evidence suggests that the TME and immune genes play a pivotal role in regulating multiple tumor pathogenesis processes [Citation25,Citation26,Citation50]. However, to date, no prognosis prediction model for the prediction of survival in patients with sarcoma has been constructed by incorporating immune genes. To further analyze the relationship between immunity and sarcoma, this study selected sarcoma-related immune genes based on IMMPORT-derived immune genes and immune-related DEGs. Univariable and multivariable analyses were conducted for constructing the sarcoma prognosis prediction model. Finally, the prognostic model was constructed using seven immune-related genes. Among these genes, GREM2, BTC, PAK3, and IL17B were the favorable prognostic factors, whereas EDN3, ZC3HAV1L, and RAC3 were the risk factors.
Endothelin 3 (EDN3) is a vital paracrine factor that affects the migration, proliferation, and survival of embryonic melanocytes during embryonic development [Citation51]. It is involved in the development of choriocarcinoma [Citation52] and malignant melanoma [Citation53]. EDN3 is produced in large quantities by glioblastoma stem cells and serves as a crucial mitogen related to the growth and invasion of neural crest cells [Citation54]. RAC3, a small GTPase 3 in the Rac family, belongs to the small guanosine triphosphatases (GTPases) Rac family, which has a crucial role in regulating cancer genesis and metastasis [Citation55,Citation56]. Liu TQ reported that lung cancer cell growth and clone formation were markedly suppressed after RAC3 knockdown [Citation57]. Moreover, Wang reported that RAC3 upregulation predicts the extended survival of patients with lung adenocarcinoma [Citation58]. Limited reports are available on ZC3HAV1L (zinc finger CCCH-type containing, antiviral 1 like), particularly on its relation with the tumor pathogenic mechanism. To the best of our knowledge, this study is the first to report that ZC3HAV1L is a risk factor for sarcoma, and the prognostic model in the present study is the first model constructed using the immune-related genes screened from the sarcoma environment. The ROC curve and GSE17674 analysis further supported the sarcoma prognosis prediction model. In summary, we analyzed the DEGs in different microenvironments of sarcoma and illustrated the sarcoma pathogenic mechanism, in particular the functions and prognosis prediction value of CLLs, CCRs, and CXCLs in the context of sarcoma. Based on IMMPORT-derived genes, immune genes associated with sarcoma were obtained, which were used to establish the prognosis prediction model. The constructed model could accurately predict survival of patients with sarcoma.
Conclusion
Chemokine receptors or ligands and immune-related genes are vital for the development and progression of sarcoma. The novel immune gene-based prognosis model may provide clinical guidance for prognosis prediction in patients with sarcoma.
Research highlights
1. A seven-gene signature to predict sarcoma prognosis is constructed for the first time.
2. CCR family genes are closely related to the pathogenesis and prognosis of sarcoma.
3. The seven genes and CCR genes could be potential therapeutic targets for sarcoma.
Abbreviations
DEGs: differentially expressed genes; TCGA: The Cancer Genome Atlas; GEO: Gene Expression Omnibus; TME: Tumor microenvironment; GO: Gene Ontology; KEGG: Kyoto Encyclopedia of Genes and Genomes; PPI: protein–protein interaction; MCODE: Molecular Complex Detection; OS: overall survival; ROC: receiver operating characteristic; CCR: C–C motif chemokine receptor; FDR: False discovery rate
Authors’ contributions
JRC and CL conceived, designed, analysed the data, and wrote the manuscript. JMC and XLZ conceptualised and developed an outline for the manuscript and revised the manuscript. TL, SXP, LYC, JJ, Xuhua Sun, and HL analysed the data and generated the figures and tables. TYC, WL, Wuhua Chen, Yuanlin Yao, Zhen Ye, and Hao Guo completed the verification of immunohistochemistry experiments.
Ethics approval and consent to participate
Our research and verification are approved by the Ethics Committee of The First Affiliated Hospital of Guangxi Medical University, China [Approval Number: 2021(KY-E-130)].
Supplemental Material
Download ()Acknowledgements
We would like to thank Miss. Luo Jinying ([email protected]), a member of Shu Lun Pan in Hong Kong, for supporting in downloading the data of patients from TCGA. We would also like to thank all the reviewers and editors for taking their precious time to review our manuscript and providing valuable suggestions, which played a great role in improving the quality of our manuscript.
Disclosure statement
No potential conflict of interest was reported by the author(s).
Availability of data and materials
The data used for analysis are available on the online public and free open platforms (TCGA: https://portal.gdc.cancer.gov/; GEO: https://www.ncbi.nlm.nih.gov/geo/; IMMPORT data: https://www.immport.org/), and the specimens used for verification are available at our institution.
Supplementary material
Supplemental data for this article can be accessed here.
Additional information
Funding
References
- Stiller CA, Trama A, Serraino D, et al. Descriptive epidemiology of sarcomas in Europe: report from the RARECARE project. Eur J Cancer. 2013;49(3):684–695.
- Hanahan D, Coussens LM. Accessories to the crime: functions of cells recruited to the tumor microenvironment. Cancer Cell. 2012;21(3):309–322.
- Curry JM, Sprandio J, Cognetti D, et al. Tumor microenvironment in head and neck squamous cell carcinoma. Semin Oncol. 2014;41(2):217–234.
- Galon J, Pagès F, Marincola FM, et al. The immune score as a new possible approach for the classification of cancer. J Transl Med. 2012;10:1.
- Yoshihara K, Shahmoradgoli M, Martínez E, et al. Inferring tumour purity and stromal and immune cell admixture from expression data. Nat Commun. 2013;4:2612.
- Huang R, Meng T, Chen R, et al. The construction and analysis of tumor-infiltrating immune cell and ceRNA networks in recurrent soft tissue sarcoma. Aging (Albany NY). 2019;11(22):10116–10143.
- Galon J, Costes A, Sanchez-Cabo F, et al. Type, density, and location of immune cells within human colorectal tumors predict clinical outcome. Science. 2006;313(5795):1960–1964.
- Geiger J, Hutchinson R, Hohenkirk L, et al. Treatment of solid tumours in children with tumour-lysate-pulsed dendritic cells. Lancet. 2000;356(9236):1163–1165.
- Wang C, Zhou X, Li W, et al. Macrophage migration inhibitory factor promotes osteosarcoma growth and lung metastasis through activating the RAS/MAPK pathway. Cancer Lett. 2017;403:271–279.
- Tomczak K, Czerwińska P, Wiznerowicz M. The Cancer Genome Atlas (TCGA): an immeasurable source of knowledge. Contemp Oncol (Pozn). 2015;19(1a):A68–77.
- Weinstein JN, Collisson EA, Mills GB, et al. The Cancer Genome Atlas pan-cancer analysis project. Nat Genet. 2013;45(10):1113–1120.
- Ritchie ME, Phipson B, Wu D, et al. limma powers differential expression analyses for RNA-sequencing and microarray studies. Nucleic Acids Res. 2015;43(7):e47.
- Gene Ontology C. The Gene Ontology (GO) project in 2006. Nucleic Acids Res. 2006;34(Database issue):D322–326.
- Kanehisa M, Furumichi M, Tanabe M, et al. KEGG: new perspectives on genomes, pathways, diseases and drugs. Nucleic Acids Res. 2017;45(D1):D353–D361.
- Yu G, Wang LG, Han Y, et al. clusterProfiler: an R package for comparing biological themes among gene clusters. Omics. 2012;16(5):284–287.
- Szklarczyk D, Morris JH, Cook H, et al. The STRING database in 2017: quality-controlled protein-protein association networks, made broadly accessible. Nucleic Acids Res. 2017;45(D1):D362–d368.
- Shannon P, Markiel A, Ozier O, et al. Cytoscape: a software environment for integrated models of biomolecular interaction networks. Genome Res. 2003;13(11):2498–2504.
- Vosse BA, Seelentag W, Bachmann A, et al. Background staining of visualization systems in immunohistochemistry: comparison of the avidin-biotin complex system and the EnVision+ system. Appl Immunohistochem Mol Morphol. 2007;15(1):103–107.
- Lei Y, Tang R, Xu J, et al. Construction of a novel risk model based on the random forest algorithm to distinguish pancreatic cancers with different prognoses and immune microenvironment features. Bioengineered. 2021;12(1):3593–3602.
- Wang B, Huang Q, Liu K, et al. Robot-assisted level III-IV inferior vena cava thrombectomy: initial series with step-by-step procedures and 1-yr outcomes. Eur Urol. 2020;78(1):77–86.
- Jiang J, Liu C, Xu G, et al. Identification of hub genes associated with melanoma development by comprehensive bioinformatics analysis. Front Oncol. 2021;11:621430.
- Jiang J, Zhan X, Xu G, et al. Glycolysis- and immune-related novel prognostic biomarkers of Ewing’s sarcoma: glucuronic acid epimerase and triosephosphate isomerase 1. Aging (Albany NY). 2021;13(13):17516–17535.
- Reiner A, Yekutieli D, Benjamini Y. Identifying differentially expressed genes using false discovery rate controlling procedures. Bioinformatics. 2003;19(3):368–375.
- Irizarry RA, Hobbs B, Collin F, et al. Exploration, normalization, and summaries of high density oligonucleotide array probe level data. Biostatistics. 2003;4(2):249–264.
- Xu WH, Xu Y, Wang J, et al. Prognostic value and immune infiltration of novel signatures in clear cell renal cell carcinoma microenvironment. Aging (Albany NY). 2019;11(17):6999–7020.
- Zhang C, Zheng JH, Lin ZH, et al. Profiles of immune cell infiltration and immune-related genes in the tumor microenvironment of osteosarcoma. Aging (Albany NY). 2020;12(4):3486–3501.
- Van Damme J, Proost P, Lenaerts JP, et al. Structural and functional identification of two human, tumor-derived monocyte chemotactic proteins (MCP-2 and MCP-3) belonging to the chemokine family. J Exp Med. 1992;176(1):59–65.
- Fujiwara H, Hamaoka T. Coordination of chemokine and adhesion systems in intratumoral T cell migration responsible for the induction of tumor regression. Int Immunopharmacol. 2001;1(4):613–623.
- Raman D, Sobolik-Delmaire T, Richmond A. Chemokines in health and disease. Exp Cell Res. 2011;317(5):575–589.
- Sarvaiya PJ, Guo D, Ulasov I, et al. Chemokines in tumor progression and metastasis. Oncotarget. 2013;4(12):2171–2185.
- Lacalle RA, Blanco R, Carmona-Rodríguez L, et al. Chemokine receptor signaling and the hallmarks of cancer. Int Rev Cell Mol Biol. 2017;331:181–244.
- Zhou X, Liao X, Wang X, et al. Clinical significance and prospective molecular mechanism of C‑C motif chemokine receptors in patients with early‑stage pancreatic ductal adenocarcinoma after pancreaticoduodenectomy. Oncol Rep. 2019;42(5):1856–1868.
- Zhang Z, Liu C, Liang T, et al. Establishment of immune prognostic signature and analysis of prospective molecular mechanisms in childhood osteosarcoma patients. Medicine (Baltimore). 2020;99(46):e23251.
- Zhang J, Liu C, Mo X, et al. Mechanisms by which CXCR4/CXCL12 cause metastatic behavior in pancreatic cancer. Oncol Lett. 2018;15(2):1771–1776.
- Sleightholm RL, Neilsen BK, Li J, et al. Emerging roles of the CXCL12/CXCR4 axis in pancreatic cancer progression and therapy. Pharmacol Ther. 2017;179:158–170.
- Chandrasekar B, Bysani S, Mummidi S. CXCL16 signals via Gi, phosphatidylinositol 3-kinase, Akt, I kappa B kinase, and nuclear factor-kappa B and induces cell-cell adhesion and aortic smooth muscle cell proliferation. J Biol Chem. 2004;279(5):3188–3196.
- Jo H, Zhang R, Zhang H, et al. NF-kappa B is required for H-ras oncogene induced abnormal cell proliferation and tumorigenesis. Oncogene. 2000;19(7):841–849.
- Lu P, Nakamoto Y, Nemoto-Sasaki Y, et al. Potential interaction between CCR1 and its ligand, CCL3, induced by endogenously produced interleukin-1 in human hepatomas. Am J Pathol. 2003;162(4):1249–1258.
- Mañes S, Mira E, Colomer R, et al. CCR5 expression influences the progression of human breast cancer in a p53-dependent manner. J Exp Med. 2003;198(9):1381–1389.
- Villablanca EJ, Raccosta L, Zhou D, et al. Tumor-mediated liver X receptor-alpha activation inhibits CC chemokine receptor-7 expression on dendritic cells and dampens antitumor responses. Nat Med. 2010;16(1):98–105.
- Kim CH, Pelus LM, Appelbaum E, et al. CCR7 ligands, SLC/6Ckine/Exodus2/TCA4 and CKbeta-11/MIP-3beta/ELC, are chemoattractants for CD56(+)CD16(-) NK cells and late stage lymphoid progenitors. Cell Immunol. 1999;193(2):226–235.
- Yoshida R, Nagira M, Imai T, et al. EBI1-ligand chemokine (ELC) attracts a broad spectrum of lymphocytes: activated T cells strongly up-regulate CCR7 and efficiently migrate toward ELC. Int Immunol. 1998;10(7):901–910.
- Steinman RM, Pack M, Inaba K. Dendritic cells in the T-cell areas of lymphoid organs. Immunol Rev. 1997;156:25–37.
- Richmond A, Thomas HG. Purification of melanoma growth stimulatory activity. J Cell Physiol. 1986;129(3):375–384.
- Cheng ZH, Shi YX, Yuan M, et al. Chemokines and their receptors in lung cancer progression and metastasis. J Zhejiang Univ Sci B. 2016;17(5):342–351.
- Liu Y, Wu L, Ao H, et al. Prognostic implications of autophagy-associated gene signatures in non-small cell lung cancer. Aging (Albany NY). 2019;11(23):11440–11462.
- Li W, Gao LN, Song PP, et al. Development and validation of a RNA binding protein-associated prognostic model for lung adenocarcinoma. Aging (Albany NY). 2020;12(4):3558–3573.
- Yang L, Takimoto T, Fujimoto J. Prognostic model for predicting overall survival in children and adolescents with rhabdomyosarcoma. BMC Cancer. 2014;14:654.
- Carneiro A, Bendahl PO, Engellau J, et al. A prognostic model for soft tissue sarcoma of the extremities and trunk wall based on size, vascular invasion, necrosis, and growth pattern. Cancer. 2011;117(6):1279–1287.
- Qu Y, Cheng B, Shao N, et al. Prognostic value of immune-related genes in the tumor microenvironment of lung adenocarcinoma and lung squamous cell carcinoma. Aging (Albany NY). 2020;12(6):4757–4777.
- Tang L, Su M, Zhang Y, et al. Endothelin-3 is produced by metastatic melanoma cells and promotes melanoma cell survival. J Cutan Med Surg. 2008;12(2):64–70.
- Rauh A, Windischhofer W, Kovacevic A, et al. Endothelin (ET)-1 and ET-3 promote expression of c-fos and c-jun in human choriocarcinoma via ET(B) receptor-mediated G(i)- and G(q)-pathways and MAP kinase activation. Br J Pharmacol. 2008;154(1):13–24.
- Spinella F, Rosanò L, Di Castro V, et al. Endothelin-1 and endothelin-3 promote invasive behavior via hypoxia-inducible factor-1alpha in human melanoma cells. Cancer Res. 2007;67(4):1725–1734.
- Liu Y, Ye F, Yamada K, et al. Autocrine endothelin-3/endothelin receptor B signaling maintains cellular and molecular properties of glioblastoma stem cells. Mol Cancer Res. 2011;9(12):1668–1685.
- Chatterjee M, Sequeira L, Jenkins-Kabaila M, et al. Individual rac GTPases mediate aspects of prostate cancer cell and bone marrow endothelial cell interactions. J Signal Transduct. 2011;2011:541851.
- Gest C, Joimel U, Huang L, et al. Rac3 induces a molecular pathway triggering breast cancer cell aggressiveness: differences in MDA-MB-231 and MCF-7 breast cancer cell lines. BMC Cancer. 2013;13:63.
- Liu TQ, Wang GB, Li ZJ, et al. Silencing of Rac3 inhibits proliferation and induces apoptosis of human lung cancer cells. Asian Pac J Cancer Prev. 2015;16(7):3061–3065.
- Wang G, Wang H, Zhang C, et al. Rac3 regulates cell proliferation through cell cycle pathway and predicts prognosis in lung adenocarcinoma. Tumour Biol. 2016;37(9):12597–12607.