
ABSTRACT
Thyroid carcinoma is one of the most common endocrine malignancies, in which papillary thyroid carcinoma (PTC) is the main pathotype. ANXA1 plays a significant role in many cancer types, but how it works in PTC has not been identified. MYC is a common transcript factor involved in tumorigenesis, development, invasion, and metastasis. The relation between ANXA1 and MYC has not been proved in PTC. In this study, firstly, we analyzed the expression and prognostic value of ANXA1 in pan-cancer using the data from the UCSC database. Then we explore the role of ANXA1 in PTC, including expression, prognostic value, and immune infiltration. In addition, we evaluated the relation between ANXA1 and the transcription factor MYC. Finally, we identified the expression of ANXA1 and MYC and then evaluated their function associated with proliferation and apoptosis in PTC cell lines by CCK8 proliferation and flow cytometry apoptosis experiment. We found that ANXA1 is up-regulated in PTC comparing with normal patients. High expression of ANXA1 was associated with adverse overall survival of PTC. ANXA1 may be regulated by MYC to promote the proliferation of PTC. MYC may regulate the expression of ANXA and thus affect the proliferation of PTC.
Introduction
Thyroid cancer is one of the common tumors in the endocrine system worldwide and the incidence of THCA has increased in recent years, especially in women [Citation1,Citation2]. Papillary thyroid carcinoma is the most popular pathological type of thyroid cancer and usually has a good prognosis [Citation3,Citation4]. However, studies have found that papillary thyroid carcinoma has more histological variants and may be more aggressive, such as high cell subtypes, columnar cell subtypes, diffuse sclerosis, and so on [Citation5,Citation6]. That means the researches of papillary thyroid carcinoma should be given more attention.
Annexin A1 (ANXA1) is a polypeptide chain composed of 346 amino acids and about 38KD [Citation7,Citation8]. It has been reported that ANXA1 is up-regulated in many cancer types, such as prostate cancer and cervical cancer. It is down-regulated in some cancer types like lung cancer, liver cancer [Citation9,Citation10]. In tumors, ANXA1 is involved in cell proliferation, apoptosis, metastasis, and invasion processes [Citation8]. Previous reports have preliminarily studied the role of ANXA1 in PTC and found it was upregulated and may be related to the development of tumorigenesis in PTC, which deserves further study [Citation11,Citation12].
MYC is a proto-oncogene in humans, including c-MYC, N-MYC, and L-MYC [Citation13], which acts as a transcriptional regulator in cellular processes [Citation14]. MYC can lead to the occurrence and metastasis of diverse cancers [Citation14]. The abnormal expression of MYC in papillary thyroid carcinoma has been described in many documents [Citation15,Citation16]. It was reported that the expression of ANXA1 might be related to MYC in breast cancer [Citation17]. However, the role of ANXA1 and MYC in PTC haven’t been researched.
In this study, we speculated that ANXA1 and MYC have an interaction relationship and we explored the role of ANXA1 in PTC. The relationship between ANXA1 and MYC and their function in tumor formation in PTC were also explored. The results can provide a reference for the clinical diagnosis and treatment of PTC.
Materials & methods
Data source
The mRNA expression and clinical data of pan-cancer including BLCA, BRCA, CHOL, COAD, ESCA, GBM, HNSC, KICH, KIRC, KIRP, LIHC, LUAD, LUSC, PRAD, READ, STAD, THCA, and UCEC were downloaded from the UCSC database (https://xena.ucsc.edu/). Then, 56 normal and 289 papillary thyroid carcinoma (PTC) data were divided from the thyroid carcinoma. The transcription factors (TFs) names were acquired by using the Cistrome database (http://www.cistrome.org/).
Bioinformatics analysis
The expression of ANXA1 was compared between the normal group and the carcinoma group among pan-cancer by using the Timer database ((http://timer.cistrome.org/). Next, we performed the survival analysis of ANXA1 in pan-cancer by using the R packages ‘survival’ and ‘survminer’. In addition, we evaluated the function of ANXA1 in normal samples and PTC, including expression analysis, prognostic value, potential diagnosis value, immune infiltration, and proliferation analysis. The immune infiltration levels were evaluated by the cistrome database (http://cistrome.org/). We got 318 TFs gene names in the cistrome data base, then the expression of 318 TFs in PTC can be acquired from the data downloaded. We analyzed the relation between ANXA1 and TFs with the spearman-related analysis. Finally, 75 TFs were acquired with the standard (|correlation|>0.35 and p-value <0.001). The Cytoscape software [Citation18] was used to visualize the relation between ANXA1 and TFs. Finally, we divided the PTC patients into high ANXA1 expression group and low ANXA1 expression group by the median score and got the different expression genes (DEGs) by the ‘DESeq2’ package to explore the gene ontology (GO) analysis as well as the Kyoto Encyclopedia of Genes and Genomes (KEGG) pathway analysis through the package ‘clusterProfiler’ and ‘GSEA’. There are 975 downregulated genes and 349 upregulated genes (p < 0.05 & |logFC| >1).
Cell culture
Normal thyroid follicular epithelial cell line Nthy-ori 3–1 and PTC cell line IHH-4 were obtained from BeNa Culture Collection(BNCC, Beijing, China). Nthy-ori 3–1 were cultured in RPMI-1640 containing 10%FBS. IHH-4 were cultured in DMEM containing 10%FBS (all from KeyGEN BioTECH, Jiangsu, China). These cells were maintained at 37°C in a 95% humidified atmosphere containing 5% CO2.
Constructing the Lentiviral vector-mediated MYC overexpression and RNA interference(RNAi)model
Nthy-ori 3–1 and IHH-4 cell lines wereseeded into a 48-well plate at a concentration of 1*104 per well, and MOI with 10/20/40/60 was respectively added to each type of cells. polybrene was added to select the successfully transfected cells . Put the plate into the incubator for 3 days to check the optimal MOI value under a microscope. cell lines above were cultured again, the virus with the best MOI concentration was added, and polybrene was added by 10ug/ml final concentration, then cultured in the incubator.
RT-qPCR
The cell culture fluid was removed. 1 ml Trizol(CWBIO, China) and 0.2 ml chloroform were added. After centrifuging at 12000rpm at 4°C for 15 min, the supernatant was extracted. An equal volume of 70% ethanol was added. The supernatant fluid was discarded and RNase-free water was added to dissolve the RNA. An ultraviolet spectrophotometer (NanoPhotometer, Germany) was used to calculate the total RNA concentration and purity, A260/280 ratio between 1.8 to 2.0. The reagents were added according to the instruction of reverse transcription kit (HiScript ® II Q RT SuperMix for qPCR (+gDNA wiper), Vazyme, Nanjing, China) to obtain stable cDNA.2× SYBR Green PCR Master Mix kit (A4004M, Lifeint, Xiamen, China) was used to configure 20ul system, reaction program:95°C for 10 min, followed by 40 cycles of 95°C for 10s and 58°C for 30s,72°C for 30s. β-actin was the control. MYC Forward: GAGCAGCGACTCTGAGGAG; MYC Reverse: AAGACGTTGTGTGTTCGCCT; β-actin Forward: TGGCACCCAGCACAATGAA; β-actin Reverse: CTAAGTCATAGTCCGCCTAGAAGCA; ANXA1 Forward: CAACTTCGCAGAGTGTTTCAG; ANXA1 Reverse: GTTTGCTTGTGGCGCACTT.
Western blot
Cell lines were lysed with RIPA cell lysate, the total protein was extracted, and then the BSA protein quantification kit (CWBIO, China) was used to determine the protein concentration of the sample. Protien samples were separated using 10% SDS–polyacrylamide gel electrophoresis (SDS-PAGE). The proteins were then transferred from the gel onto a PVDF membrane (Millipore, Bedford, MA). Skimmed milk powder was diluted with TBST at a 3%concentration, blocking the membrane for 1 hour. The primary antibodies Mouse Monclonal-GAPDH (TA-08, ZSBio, Beijing, China, dilution 1:2000) and Rabbit Anti Myc (ab32072, Abcam, 1:1000) was added and incubated overnight, the secondary antibody(HRP-conjugated anti-rabbit or anti-mouse IgG at the appropriate dilutions Beyotime, Nanjing, China) was incubated for 2 hours and the PVDF membranes were washed with TBST solution. After adding the luminescent solution, the PVDF membrane was detected using the Ultra-High sensitivity chemiluminescence imaging system (BIORAD, Shanghai, China)
CCK8 cell proliferation experiment
The supernatant fluids of cell lines were discarded and washed with PBS Twice, 0.25% trypsin (containing 0.02% EDTA) (Solarbio, Beijing, China) was added to the cells, which were incubated in 37°C for 2 minutes, the medium was added to stop the digestion. The cell lines were collected into a 10 ml centrifuge tube and centrifuged at 1000 rpm for 3 minutes, the supernatant fluids were discarded. The culture mediums were added to dilute the cell suspension by a density of 5000 cells/well and then added to a prepared 96-well plate with100ul per well and placed in a 37°C, 5% CO2 incubator for culture. After 22 h, 46 h, 70 h, 94 h,10ul CCK8 detection reagent were added to each well, and cell lines were incubated for 2 hours at 37°C, then the survival rates were calculated by detecting the OD value of each well with a microplate reader (LIUYI, Beijing, China) at 450 nm wavelength.
Flow cytometry apoptosis experiment
The experiments had been done according to Annexin V-APC/7-AAD apoptosis kit(Multi Sciences, China). The 1 × 10⁶–3 × 10⁶ cells in each group were collected, added 1 ml PBS, and centrifuged at 1500 rpm, 3 min, then washed twice. 5× Binding Buffer was diluted into 1× Binding Buffer with double distilled water.500ul of pre-chilled 1× Binding Buffer were added to resuspend the cells.5ul Annexin V-APC and 10 ul 7-AAD were added to each tube and incubated at room temperature and dark for 10 min. Flow cytometry (NovoCyte 2060 R, ACEA BIO, Hangzhou, China) was used to detect.
Statistical analysis
SPSS 23.0 and R software were used to perform the statistical analysis. Two groups of samples used t-test, data comparison with more than three groups were conducted using one-way analysis of variance (ANOVA), and Student-Newman-Keuls(SNK) multiple comparison method, P < 0.05 was considered statistically significant
Results
In this study, firstly, we analyzed the expression and prognostic value of ANXA1 in pan-cancer using the data from the UCSC database. Then we explore the role of ANXA1 in PTC, including expression, prognostic value, and immune infiltration. In addition, we evaluated the relation between ANXA1 and the transcription factor MYC. Finally, we identified the expression of ANXA1 and MYC and then evaluated their function associated with proliferation and apoptosis in PTC cell lines by CCK8 proliferation and flow cytometry apoptosis experiment.
The expression of ANXA1 across cancers
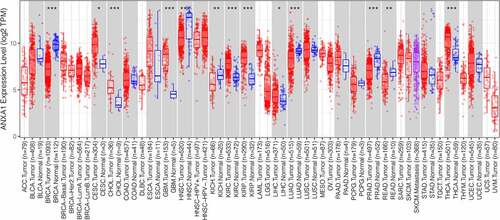
To explore the potential role of ANXA1 in cancers, we analyzed the expression of ANXA1 between normal and pan-cancer patients. What is showed in is that ANXA1 is up-regulated in 7 cancer types, including cervical squamous cell carcinoma(CESC), Cholangiocarcinoma(CHOL), Glioblastoma(GBM), Kidney renal clear cell carcinoma(KIRC), kidney renal papillary cell carcinoma (KIRP), Liver hepatocellular carcinoma(LIHC), and Thyroid carcinoma (THCA) In addition, ANXA1 is down-regulated in 5 cancer types. The differential expression of ANXA1 in these types of tumors may play an important role.
Figure 1. The expression level of ANXA1 in pan-carcinoma: analysis of 501 patients with THCA and 59 healthy subjects showed that ANXA1 was highly expressed in THCA, and the difference was statistically significant(p < 0.05).
The prognostic value of ANXA1 in pan-cancer
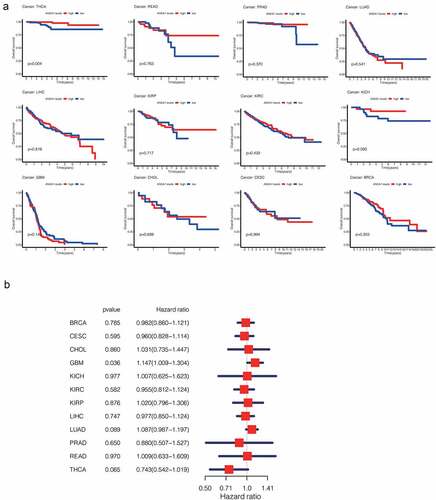
To study the prognostic value of ANXA1 in pan-cancer, we analyzed the overall survival (OS) associated with the expression of ANXA1 across cancers. As shown in , we found that the ANXA1 expression is significantly associated with the decreased overall survival in THCA. However, the phenomenon is not so significant with the Cox regression analysis. In other cancer types, we couldn’t find an apparent change in the overall survival curve between the low ANXA1 expression group and the high expression group (). However, thyroid cancer can be classified into several types, and we will further discuss the role of ANXA1 in PTC.
Figure 2. (a)Survival analysis of ANXA1 in pan-cancer showed that the high expression of ANXA1 was associated with higher overall survival in THCA patients, with a statistically significant difference (P = 0.004). (b)Univariate Cox regression was performed on the results of survival analysis, and the results showed that the expression of ANXA1 was not statistically significant in overall survival of THCA.
The role of ANXA1 in PTC
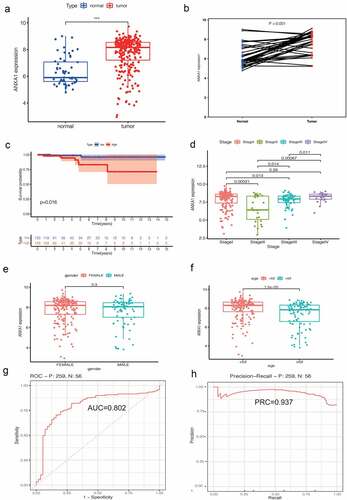
We divided 56 normal samples and 289 PTC samples including clinical data from the UCSC database, then explored the role of ANXA1 in PTC. We found ANXA1 expression was significantly up-regulated in PTC comparing with normal samples (). The overexpression of ANXA1 was associated with a worse prognosis in PTC(). The area under of curve (AUC) was 0.802, which suggested that ANXA1 was an effective biomarker to guide the prognosis of PTC(). What is more, we found that the expression of ANXA1 is higher in PTC patients with age <50 compared with PTC patients with age ≥ 50(p < 0.001). In addition, ANXA1 was expressed differently in the different pathological stages (P < 0.001) ().
Figure 3. (a) The expression analysis of ANXA1 was refined into the PTC subtype, and the results showed that ANXA1 was significantly highly expressed in PTC (P < 0.05). (b) In 56 pairs of paired PTC and normal samples, the mRNA expression of ANXA1 showed a significant upward trend in tumors (P < 0.05). (c) A survival analysis of 259 PTC patients showed that ANXA1 high expression was a poor prognostic signal for PTC, which is contrary to the results previously obtained in THCA. (d) Differences in the expression of ANXA1 in different stages of PTC, with P values listed in the figure. (e) The expression level of ANXA1 was not statistically significant among different genders (P = 0.03). (f) PTC patients were grouped according to 52 years old. ANXA1 was highly expressed in patients younger than 52 years old, and the difference was statistically significant (P < 0.001). (g) ROC curve of survival analysis: the area under the curve (AUC) was 0.802. (h) Precision-Recall analysis showed that the PRC value was 0.931.
The immune infiltration analysis in PTC
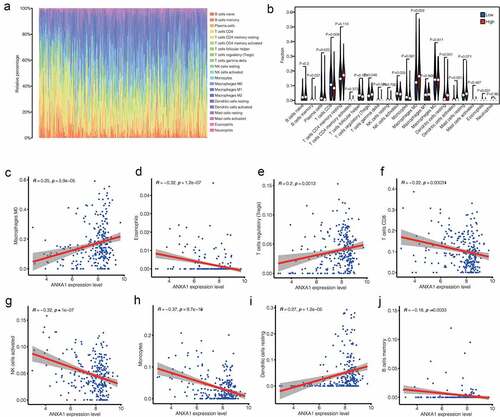
As shown in , we can see the relative percentage of 22 kinds of immune cells in PTC. T cells, Monocytes, and Macrophages accounted for the majority of cases. In , We can observe that the high expression of ANXA1 will lead to lower levels of Plasma cells, T cells CD8, T cells regulatory, T cell gamma delta, NK cells activated, Macrophages M0, Dendritic cell resting, Dendritic cell activated, and Eosinophils in PTC patients(P < 0.05) (). Correlation analysis revealed that the expression of ANXA1 was significantly associated with Macrophages M0, Eosinophils, T cells regulatory, T cells CD8, NK cells activated, Monocytes, Dendritic cells resting, B cells memory. ()
Figure 4. (a) Relative percentages of different immune cells in PTC patients. According to the area of different colors, T cells, monocytes and macrophages accounted for the main part. (b) The high expression of ANXA1 will lead to lower levels of Plasma cells, T cells CD8, T cells regulatory, T cell gamma delta, NK cells activated, Macrophages M0, Dendritic cell resting, Dendritic cell activated, And Eosinophils in PTC patients(P < 0.05) (c) – (f) Immunoinfiltration analysis showed that the expression level of ANXA1 was correlated with 8 kinds of immune cells(p < 0.05).
The relation between ANXA1 and transcript factor MYC
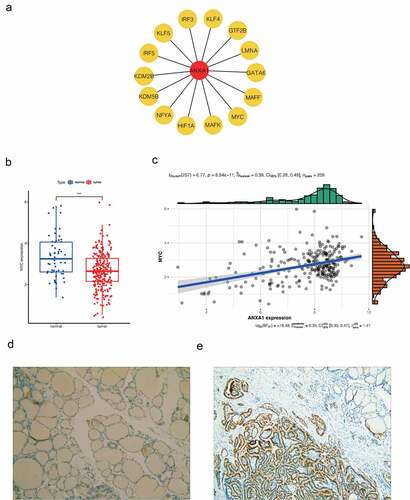
Then, we use Cytoscape software to explore the network between ANXA1 and the 75TFs, and the top 15 hub TFs (such as MYC, HIF1A, and so on) were selected using cytohubba plugin (). MYC is one of the Hub TFs(Cor = 0.39, p < 0.001, ). MYC expressed differently between normal and PTC patients (). It suggested that MYC may function by affecting the expression of ANXA1 in PTC patients. What is more, we explored the protein expression of ANXA1 in PTC and found it was upregulated in PTC ().
Figure 5. (a) The network of 15 hub transcription factors of ANXA1which includes MYC. (b) We chose the MYC molecule as the study object. Expression analysis in UCSC database showed low expression of MYC gene in PTC patients (P < 0.05). (c) Correlation analysis between MYC and ANXA1 showed that MYC was one of the Hub TFS (COR = 0.39, P < 0.001).(d,e) The protein expression of ANXA1 in normal and PTC.
Verification of lentivirus transfection results
The MYC overexpression plasmid was introduced into Nthy-ori 3–1 cells using lentiviral transfection. The MYC interference plasmid was also used to transfect IHH-4 cells. The transfection results were verified by qRT-PCR technology and western blot assays (supplymentary figure s1A,C,E). Nthy-ori 3–1 cells were divided into three groups, the normal thyroid cell group(control), the empty vector-treated negative control(NC) and the MYC overexpression group (MYC). MYC has significantly high mRNA and protein expression in the MYC overexpression group compared with the previous two groups of cells. IHH-4 cells were also divided into three groups. The IHH-4(control), the IHH-4 MYC empty group (shRNA NC), and the MYC-interfering IHH-4 cell group (shRNA-1, shRNA-2, shRNA-3). In these groups, the mRNA and protein expression of MYC in shRNA1 and shRNA2 was significantly down-regulated (Figure S1b,d,f), indicating that the cells were successfully transfected.
RT-qPCR results
The expression of ANXA1 mRNA in the Nthy-ori 3–1 cell line with overexpression MYC group has a decreased trend, compared with the NC group (P < 0.05, ). And the expression of ANXA1 mRNA in the IHH-4 cell line interference MYC group shows an increasing trend, compared with the NC group (P < 0.05, ). (* means treating group compared with Control; # means treating group compared with NC group)
Figure 6. (a)The expression of ANXA1 mRNA in the Nthy-ori 3–1 cell line with overexpression MYC group has a decreased trend, compared with the NC group(P < 0.05). (b)The expression of ANXA1 mRNA in the IHH-4 cell line interference MYC group shows an increasing trend, compared with the NC group (P < 0.05). (c)The expression of ANXA1 protein in the overexpressing MYC group was significantly increased in the Nthy-ori 3–1 cell line(P < 0.05), compared with the control group and NC group. (d)The expression of ANXA1 protein in the interference MYC group showed a downward trend in the IHH-4 cells(P < 0.05), compared with the control group and NC group. (* means treating group compared with Control; # means treating group compared with NC group).
Western blot results
The expression of ANXA1 protein in the overexpressing MYC group was significantly increased in the Nthy-ori 3–1 cell line (P < 0.05, ), compared with the control group and NC group. And the expression of ANXA1 protein in the interference MYC group showed a downward trend in the IHH-4 cells(P < 0.05), compared with the control group and NC group (). The discrepancy between PCR and Western blot may be due to the presence of posttranslational modifications such as DNA methylation, microRNAs, and others.
Up-regulated ANXA1 and MYC promotes cell proliferation
In normal thyroid follicular cells, compared with the control group and the no-load group, thyroid follicular cells with overexpressed MYC showed significantly higher cell proliferation at 24 h, 48 h, 72 h, and 96 h than control group as well as NC group(P < 0.05) ()
Figure 7. (a) In normal thyroid follicular cells, compared with the control group and the no-load group, thyroid follicular cells with overexpressing MYC promoted significantly cell proliferation at 24 h, 48 h, 72 h, and 96 h (P < 0.05). (b)In papillary thyroid carcinoma cells, compared with the control group and the no-load group, the papillary thyroid carcinoma cells that interfered with MYC significantly inhibited cell proliferation at 24 h, 48 h, 72 h, and 96 h (P < 0.05).
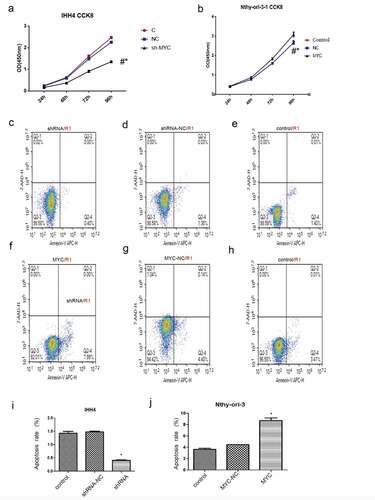
In papillary thyroid carcinoma cells, compared with the control group and the no-load group, the papillary thyroid carcinoma cells that interfered with MYC significantly inhibited cell proliferation at 24 h, 48 h, 72 h, and 96 h (P < 0.05) ().
Up-regulated ANXA1 and MYC had no significant influence on cell apoptosis
In papillary thyroid cancer cells, the mean apoptotic rates of the untreated group, group treated with control vector, and the group expressing MYC shRNA were 1.41%, 1.41%, and 0.40%, respectively. Similarly, the MYC gene interference does not affect cell apoptosis. ().The mean apoptosis rate of the untreated group, group treated with control vector, and the group with MYC overexpression were 3.42%, 4.54%, and 7.99% correspondingly. As for the lower apoptosis rate (<10%) which may be caused by cell cycle, the overexpression of the MYC gene may have no significant effect on cell apoptosis ().
GO and KEGG analysis results
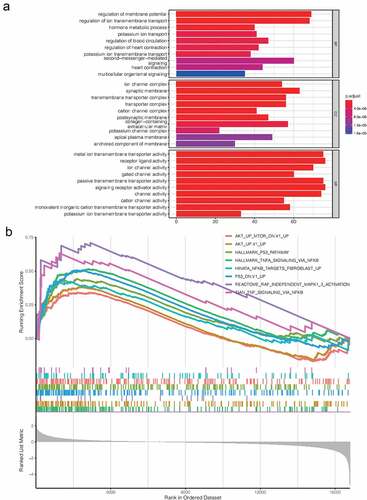
After exploring the GO and KEGG pathway analysis with the DEGs related to ANXA1, we found they are mainly related to the transporter activity and channel activity (). It indicates that ANXA1 may function in PTC by regulating the transporter and channel activity. In addition, the GSEA results suggest that upregulated ANXA1 may active the pathways like P53-AKT signal pathway, mTOR pathway, NF-KB signaling pathway, etc. ()
Figure 8. (a) GO enrichment analysis indicates that ANXA1 may function in PTC by regulating the transporter and channel activity. (b) GSEA results suggest that upregulated ANXA1 may active the pathways like p53-Akt signal pathway, mTOR pathway, NF-KB signaling pathway, etc.
Discussion
Thyroid carcinoma is a common cancer type around the world, in which PTC accounts for the main part. There is significant heterogeneity in prognosis among PTC patients. The principal treatment consists of adrenalectomy and adjuvant combination iodine 131 treatment, which may affect the quality of life. Therefore, a new marker or target for diagnosing and curing PTC is necessary. ANXA1 and the transcript factor MYC are expressed differently in many cancers, but the role of ANXA1 in PTC and the relation between them are not clear, which is the major part we involve in the research.
In this study, the data related to papillary thyroid carcinoma were obtained from the official website of UCSC and the expression of ANXA1 and MYC in PTC were analyzed. The results showed that the expression of ANXA1 in 7 cancer types was relatively high, and 5 cancer types were relatively low compared with the normal thyroid group. In addition, the high expression of ANXA1 in THCA was associated with a good prognosis, but it turns out just the opposite in PTC. As to the different results, we guess it may depend on the influence of different subtypes of THCA. As is reported, there is an apparent different prognosis in the subtypes of THCA [Citation19]. In PTC patients, 6 immune cells (T cells CD8, T cells regulatory, NK cells activated, Macrophages M0, Dendritic cells resting and Eosinophils) are both related to ANXA1in PTC patients. As is reported, T cells CD8 plays an important role in cancer immunology by tumor immune-surveillance, and then inhabit the tumor formation even eliminate the cancer cells [Citation14,Citation20]. NK cells activated may help us prevent developing cancers [Citation21]. In the research, we found T cells CD8 expression was negative associated with the expression of ANXA1 as well as NK cells activated and it suggested that ANXA1 might promote the proliferation of PTC cell by affecting the expression of the immune cells. In recent studies, some people find ANXA1 is related to T cells in PTC, which is similar to our results [Citation22]. T cells regulatory suppress immune activity in cancer, unlike T cells CD8 and ANXA1 expression was positively related with T cells regulatory (Tregs), which suggests ANXA1 may function in PTC by affecting the expression of Tregs [Citation23]. According to the role of ANXA1 including the ROC (0.807) in PTC, ANXA1 may be a potential marker for diagnosing PTC and a potential target for curing PTC. In addition, the exploration of immune infiltration in PTC samples may accelerate the new treatment strategies for PTC later. With the Pearson-related analysis method, we acquire 75 TFs (including MYC) related to ANXA1. TFs were some special genes that drive cancer to develop and play a crucial role in cancer initiation [Citation24,Citation25]. Then the correlation between ANXA1 and MYC in papillary thyroid carcinoma was analyzed and the result showed that ANXA1 and MYC have a positive correlation in papillary thyroid carcinoma. That shows that ANXA1 may function in PTC regulated by MYC. To further confirm the results, we purchased and cultured two cell lines of normal thyroid follicular cells Nthy-ori3-1 and thyroid papillary carcinoma cells IHH-4. RT-qPCR and Western blot technology were applied to analyze the mRNA expression of ANXA1 and MYC. The mRNA expression of ANXA1 tends to be down when the mRNA expression of MYC is upregulated. However, the ANXA1 protein showed a high expression trend and MYC protein has the same trend. With the increasing MYC protein expression, the expression of ANXA1 protein increases later and accounts for the proliferation of PTC. Therefore, it can be concluded that ANXA1 may be regulated by MYC and function in the occurrence and development of papillary thyroid carcinoma.
To further study the relationship between ANXA1 and MYC in papillary thyroid carcinoma, Normal follicular thyroid cells were transfected by llentivirus to generate a MYC overexpression model, and papillary thyroid carcinoma cells interfered with MYC expression, as well as the blank load group and control group were used as controls. After the transfection was completed, the expression of ANXA1 was detected. The results showed that ANXA1 mRNA was lower expressed in normal thyroid follicular cells with overexpressing MYC, while ANXA1 protein was significantly increased. In the papillary thyroid carcinoma, the expression of ANXA1 mRNA in the MYC group was up-regulated, while the protein level was significantly down-regulated. The above experimental results show MYC regulates positively the expression of ANXA1 protein and regulates reversely the expression of ANXA1 mRNA. As for the issue that the mRNA expression of ANXA1 is upregulated while MYC is downregulated, it may be explained due to the presence of DNA methylation, non-coding RNA, and other posttranslational modifications such as histone modifications. What is more, CCK8 experiments were performed. The results show that normal thyroid cells overexpressing MYC promote proliferation and the papillary thyroid cells that interfered with MYC inhibit proliferation. However, overexpression or interference with MYC has no significant effect on the apoptosis of thyroid cells. That means MYC plays an important role in the occurrence and development of papillary thyroid carcinoma. The expression of ANXA1 in papillary thyroid carcinoma is mostly limited to the high expression of ANXA1 protein in papillary thyroid carcinoma in previous research. This study is to show the role of ANXA1 in papillary thyroid carcinoma including expression analysis, prognosis analysis, immune infiltration, cell function experiment, biological function, related pathways, etc. And we also explored the connection between ANXA1 and MYC in papillary thyroid carcinoma.
Through this research, we have realized the high expression of ANXA1 in papillary thyroid carcinoma, and the expression of ANXA1 in papillary thyroid carcinoma is related to the MYC. And ANXA1 was regulated by MYC and functions in PTC by promoting proliferation. However, all results are acquired by sequencing data and cell experiments without involving animal model confirmation, the accurate mechanism of the ANXA1 function in papillary thyroid carcinoma still needs further exploring.
Conclusion
ANXA1 may be regulated by the transcript factor MYC and is upregulated in PTC, which promotes proliferation of PTC and accelerate the tumor formation. And it may be a potential marker for diagnosing PTC and a target for curing PTC later.
Highlights
1. We explored the role of ANXA1 in papillary thyroid carcinoma.
2. We combine bioinformatics analysis and cell experiments.
3. We provided a potential marker for diagnosing PTC and a target for curing PTC later.
Supplemental Material
Download Zip (246.5 KB)Acknowledgements
This work was supported by the Department of General Surgery and Pathology of Fuyang Hospital Affiliated to Anhui Medical University.
Disclosure statement
No potential conflict of interest was reported by the author(s).
Data availability statement
The authors confirm that the data supporting the findings of this study are available within the article.
Supplementary material
Supplemental data for this article can be accessed here
Additional information
Funding
Related Research Data
References
- Seib CD, Sosa JA. Evolving understanding of the epidemiology of thyroid cancer. Endocrinol Metab Clin North Am. 2019;48(1):23–35.
- Wu D, Hu S, Hou Y, et al. Identification of potential novel biomarkers to differentiate malignant thyroid nodules with cytological indeterminate. BMC Cancer. 2020;20(1):199.
- Pinto N, Prokopec SD, Vizeacoumar F, et al. Lestaurtinib is a potent inhibitor of anaplastic thyroid cancer cell line models. PLoS One. 2018;13(11):e0207152.
- Sa R, Cheng L, Jin Y, et al. Distinguishing patients with distant metastatic differentiated thyroid cancer who biochemically benefit from next radioiodine treatment. Front Endocrinol (Lausanne). 2020;11:587315.
- Lee HS, Lee JW, Park JH, et al. Comprehensive analysis for diagnosis of preoperative non-invasive follicular thyroid neoplasm with papillary-like nuclear features. PLoS One. 2019;14(7):e0218046.
- Zajkowska K, Kopczynski J, Gozdz S, et al. Noninvasive follicular thyroid neoplasm with papillary-like nuclear features: a problematic entity. Endocr Connect. 2020;9(3):R47–R58.
- Han PF, Che XD, Li HZ, et al. Annexin A1 involved in the regulation of inflammation and cell signaling pathways. Chin J Traumatol. 2020;23(2):96–101.
- Liu A, Huang W, Zeng G, et al. Expression of the Annexin A1 gene is associated with suppression of growth, invasion and metastasis of nasopharyngeal carcinoma. Mol Med Rep. 2014;10(6):3059–3067.
- Foo SL, Yap G, Cui J, et al. Annexin-A1 - A blessing or a curse in cancer? Trends Mol Med. 2019;25(4):315–327.
- Sugimoto MA, Ribeiro ALC, Costa BRC, et al. Plasmin and plasminogen induce macrophage reprogramming and regulate key steps of inflammation resolution via annexin A1. Blood. 2017;129:2896–2907.
- Zhao X, Ma W, Li X, et al. ANXA1 enhances tumor proliferation. and migration by regulating epithelial-mesenchymal transition and IL-6/JAK2/STAT3 pathway in papillary thyroid carcinoma. J Cancer. 2021;12:1295–1306.
- Ciregia F, Giusti L, Molinaro A,et al. Presence in the pre-surgical fine-needle aspiration of potential thyroid biomarkers previously identified in the post-surgical one. PLoS One. 2013 Sep 2;8(9):e72911. doi:10.1371/journal.pone.0072911. PMID: 24023790; PMCID: PMC3759451
- Elbadawy M, Usui T, Yamawaki H, et al. Emerging roles of C-Myc in cancer stem cell-related signaling and resistance to cancer chemotherapy: a potential therapeutic target against colorectal cancer. Int J Mol Sci. 2019;20. DOI:10.3390/ijms20092340
- Da Costa EM, Armaos G, McInnes G, et al. Heart failure drug proscillaridin A targets MYC overexpressing leukemia through global loss of lysine acetylation. J Exp Clin Cancer Res. 2019;38(1):251.
- Sanjari M, Kordestani Z, Safavi M, et al. Enhanced expression of Cyclin D1 and C-myc, a prognostic factor and possible mechanism for recurrence of papillary thyroid carcinoma. Sci Rep. 2020;10(1):5100.
- Zhang Y, Li F, Chen J. MYC promotes the development of papillary thyroid carcinoma by inhibiting the expression of lncRNA PAX8‑AS1:28. Oncol Rep. 2019;41:2511–2517.
- Shannon P, Markiel A, Ozier O, et al. Cytoscape: a software environment for integrated models of biomolecular interaction networks. Genome Res. 2003;13:2498–2504.
- Prates J, Moreli JB, Gimenes AD, et al. Cisplatin treatment modulates Annexin A1 and inhibitor of differentiation to DNA 1 expression in cervical cancer cells. Biomed Pharmacother. 2020;129:110331.
- Yuan Y, Anbalagan D, Lee LH, et al. ANXA1 inhibits miRNA-196a in a negative feedback loop through NF-kB and c-Myc to reduce breast cancer proliferation. Oncotarget. 2016;7(19):27007–27020.
- Liu X, Xu J, Zhang B, et al. The reciprocal regulation between host tissue and immune cells in pancreatic ductal adenocarcinoma: new insights and therapeutic implications. Mol Cancer. 2019;18(1):184.
- Blish CA. Natural Killer cell diversity in viral infection: why and how much? Pathog Immun. 2016;1(1):165–192.
- Chen S, Liu M, Liang B, et al. Identification of human peripheral blood monocyte gene markers for early screening of solid tumors. PLoS One. 2020;15(3):e0230905.
- Kovaleva OV, Rashidova MA, Samoilova DV, et al. Immunosuppressive phenotype of esophagus tumors stroma. Anal Cell Pathol (Amst). 2020;2020:5424780.
- Kazdan J, Sharp V, Pui J. Case report: a rare presentation of high risk epithelioid hemangioendothelioma on leg treated with surgical excision. Int J Surg Case Rep. 2019;59:66–69.
- Wang N, Wu D, Long Q, et al. Dysregulated YY1/PRMT5 axis promotes the progression and metastasis of laryngeal cancer by targeting Hippo pathway. J Cell Mol Med. 2020;25(2):946–959.