
ABSTRACT
Oral squamous cell carcinoma (OSCC) is the leading cause of death in patients with head and neck cancer. Reliable biomarkers to guide treatment decisions for OSCC remain scarce. The purpose of this study was to identify novel prognostic markers regulated by super enhancers in OSCC. Eight modules were obtained by weighted gene co-expression network analysis (WGCNA), among which MEblue module had the highest correlation with tumor stage, alcohol consumption and smoking. There were 41 genes regulated by super enhancers in MEblue module. Functional analysis showed that 41 super enhancer-regulated genes were involved in cancer progression. A total of twenty transcription factors of the 41 genes were predicted. Prognostic analysis of the 41 genes and the top 5 transcription factors showed that patients with high expression of AHCY, KCMF1, MANBAL and TFDP1 had a poor prognosis. Immunohistochemical analysis showed that AHCY, KCMF1 and MANBAL were highly expressed in OSCC tissue. Cellular experiment demonstrated that TFDP1 promoted AHCY, KCMF1 and MANBAL expression by binding to the super enhancers of these genes. Knockdown of TFDP1, AHCY, KCMF1 and MANBAL inhibited the proliferation of OSCC cells. In conclusion, AHCY, KCMF1 and MANBAL were recognized as super enhancer-regulated prognostic biomarkers regulated by TFDP1 in OSCC.
Introduction
Oral squamous cell carcinoma (OSCC) is the most common malignancies of the oral and maxillofacial cavity, with approximately 300,000 new cases occurring worldwide annually [Citation1,Citation2]. OSCC is characterized by a high rate of recurrence and lymph node metastasis. Majority of OSCC patients are diagnosed at an advanced stage when diagnosed [Citation3]. The 5-year survival of OSCC has remained less than 50%[Citation4]. Local metastasis and recurrence are vital obstacles to the clinical management of OSCC [Citation4]. OSCC progression is complicated and involves various factors, such as smoking, alcohol consumption, genetic mutations and epigenetic alterations [Citation5–7]. Routine surgery, radiotherapy and chemotherapy are common clinical treatments for OSCC. Despite significant advances in imaging, surgery, radiotherapy and chemotherapy in recent years, effective biomarkers for OSCC to guide clinical treatment are still sorely lacking [Citation8]. Exploration of key genes affecting the clinical phenotype of OSCC using systems biology approaches, such as weighted gene co-expression network analysis (WGCNA) [Citation9,Citation10], may provide innovative insights into the theoretical investigation of OSCC progression and offer novel therapeutic approaches.
Super enhancers are recognized as clusters of dense enhancers on the genome, characterized by high enrichment of H3K27ac and bromodomain-containing protein 4 [Citation11,Citation12]. Super enhancers are significantly more capable of driving gene expression than typical enhancers [Citation13]. Super enhancers interact with transcription factors and play a crucial role in transcription [Citation14,Citation15]. Abnormal transcription mediated by super enhancers is involved in maintaining tumor cell characteristics [Citation13,Citation15]. For example, KLF4 was found to maintain the oncogenic state of head and neck squamous cell carcinoma by targeting super enhancers to activate downstream target genes [Citation16]; FOSL1 promotes head and neck squamous cell carcinoma metastasis through super enhancer-driven transcriptional activation [Citation17]. Transcriptional regulation by super enhancers has potential to be an effective target for cancer therapy. However, regulatory mechanisms of super enhancers in OSCC are largely unknown. Discovering super enhancer-regulated prognostic genes could provide valuable targets for therapeutic intervention in OSCC.
The aim of this study was to identify and validate prognostic genes regulated by super enhancers in OSCC. The key module significantly associated with tumor stage, alcohol consumption and smoking in OSCC was screened by WGCNA. Genes regulated by super enhancers in the key module and transcription factors for these genes were screened, and used for prognostic analysis. Finally, we verified that the expression of prognostic genes regulated by transcription factor through binding to super enhancers, and the effects of key genes in OSCC cell proliferation.
Materials and methods
Data collection
RNA-seq and clinical data of 328 OSCC patients were available from The Cancer Genome Atlas (TCGA; https://tcga-data.nci.nih.gov/tcga/) for WGCNA, expression correlation and overall survival analysis. H3K27ac ChIP-seq data of GSE88976 [Citation18] cohort were downloaded for super enhancer identification and visualization. Immunohistochemical data of AHCY, KCMF1 and MANBAL expression in OSCC and normal control tissues were downloaded from The Human Protein Atlas database (https://www.proteinatlas.org/).
WGCNA [Citation9,Citation19]
The WGCNA R package was used for co-expression network construction to analysis the relationships among OSCC tumor stage, alcohol consumption and smoking. The co-expression network was transformed into the adjacency matrix and then into the topological overlap matrix, which was further transformed into different modules according to the dissimilarity. Modules with a dissimilarity of less than 0.2 were merged. The module eigengene (ME) of each module was calculated. Pearson correlations between the MEs and tumor stage, alcohol consumption or smoking were calculated by R. Module with the highest correlation coefficients with tumor stage (AJCC 8th), alcohol consumption and smoking was defined as the key module.
Identification of super enhancer
For super enhancer identification, H3K27ac ChIP-seq data of HSC4 and BHY cells in GSE88976 dataset were used. H3K27ac ChIP-seq signal peaks were identified using findPeaks tool in HOMER algorithm [Citation20]. Regions on the genome with high density of H3K27ac signaling were defined as enhancers. Enhancers were arranged according to H3K27ac signal using super enhancer tool in HOMER algorithm. Enhancers with tangent slope >1 were identified as super enhancer, and the others were identified as typical enhancers [Citation21,Citation22].
H3K27ac ChIP-seq data of HSC4, BHY, CAL33 and BICR31 cells in GSE88976 cohort were applied to visualize super enhancers at AHCY, KCMF1 and MANBAL locus using the UCSC Genome Browser (http://genome.ucsc.edu) after H3K27ac peaks calling using findPeaks tool in HOMER algorithm.
Identification and functional annotations of overlapping genes
Overlapping genes of the three collections (genes in the key module, genes closest to super enhancers in HSC4 and BHY cells) were screened by plotting a Venn diagram using R. Metascape (http://metascape.org/gp/index.html) was applied to annotate the function of the overlapping genes [Citation23].
Transcription factor prediction and correlation analysis
Transcription factors for the overlapping genes were predicted using the Toolkit for Cistrome Data Browser (http://dbtoolkit.cistrome.org) [Citation24]. R was used to calculate the Pearson’s correlation among the expression of overlapping genes and transcription factors based on TCGA database. Expression correlation network was plotted using Cytoscape (http://www.cytoscape.org) [Citation25,Citation26].
Cell culture and transfection
The HSC4 human OSCC cell line was gained from the Chinese Academy of Sciences. The BHY human OSCC cell line was purchased from Cell Lines Service (Eppelheim, Germany). Cells were cultured in Dulbecco’s modified of Eagle medium (DMEM; Gibco, MA, USA) with 10% fetal bovine serum (FBS; Gibco), 1% penicillin (Sigma-Aldrich, Missouri, USA) and streptomycin (Sigma-Aldrich) at 37°C, 5% CO2.
For AHCY, KCMF1, MANBAL and TFDP1 knockdown, HSC4 and BHY cells were transfected with shRNA (sh)-AHCY, sh-KCMF1, sh-MANBAL and sh-TFDP1 individually. Cells transfected with sh-control was selected as negative control. Sh-AHCY, sh-KCMF1, sh-MANBAL, sh-TFDP1 and sh-control were provided by Gene Pharma (Shanghai, China). Lipofectamine 3000 (Invitrogen, Carlsbad, CA, USA) was used for cell transfection according to the manufacturer’s instructions.
JQ1 treatment
JQ1 is a bromodomain and extraterminal-bromodomain inhibitor that preferentially represses transcription of super enhancer-regulated genes [Citation14]. JQ1 was purchased from Sigma-Aldrich. HSC4 and BHY cells were treated with different concentrations of JQ1 (0, 500 and 1000 nM) for 24 h. Then, cells were collected for RNA extraction and RT-qPCR assay.
RNA extraction and real-time quantitative PCR (RT-qPCR)
Total RNA was extracted from cells using TRIzol (Invitrogen). High-Capacity cDNA Reverse Transcription Kit (Applied Biosystems, CA, USA) was used for cDNA synthesis according to the protocol. RT-qPCR was performed using Power SYBRs Green PCR Master Mix (Applied Biosystems) with β-actin as the endogenous control. The relative expression of TFDP1, AHCY, KCMF1 and MANBAL was calculated using 2−ΔΔCt formula. The primer sequences for RT-qPCR were shown as follows:
β-actin-forward (F): 5ʹ-TTGCTGACAGGATGCAGAAGGAGA-3ʹ; β-actin-reverse (R), 5ʹ-ACTCCTGCTTGCTGA TCCACATCT-3ʹ.
TFDP1-F: 5ʹ-AATTGAAGCCAACGGAGAACTC-3ʹ; TFDP1-R: 5ʹ-CGGTCTCTGAGGCGTACCA-3ʹ.
AHCY-F: 5ʹ-ATTCCGGTGTATGCCTGGAAG-3ʹ; AHCY-R: 5ʹ-GAGATGCCTCGGATGCCT-3ʹ.
KCMF1-F: 5ʹ-TCGAGGTCGCAGATATAAGTGT-3ʹ; KCMF1-R: 5ʹ- CCGTATAGCCCATTTTTCCACAA-3ʹ.
MANBAL-F: 5ʹ-TGACCTAGACTTCTCACCTCCG-3ʹ; MANBAL-R: 5ʹ-CAGGAAGAGTCCGTACCGTAG-3ʹ.
Chromatin immunoprecipitation (ChIP)-qPCR
HSC4 cells treated with 0 or 500 nM JQ1 were used for ChIP. ChIP assay was carried out Magna Chromatin Immunoprecipitation kit (Millipore, Massachusetts, USA) according to the manufacturer’s protocol. Cell cross-linking was performed using 1% formaldehyde (Thermo Fischer Scientific, MA, USA). Then, cross-linked cells were fragmented into ~1 0000 bp by Covaris E220 (Woburn, MA, USA). TFDP1 antibody (ab227144, Abcam) and rabbit IgG monoclonal [EPR25A]-Isotype control (ab172730, Abcam) were used for immunoprecipitation. DNA was purified using Gel Extraction Kit (Omega Bio-Tek, MA, USA) and quantified by RT-qPCR. The primer sequences for ChIP-qPCR were shown as follows:
ANCY, E1-F: 5ʹ-ATTGAGGTAATGGTCGGCCC-3ʹ, E1-R: 5ʹ-CTGTGGTAGCGAGTGGAGAC −3ʹ; E2-F: 5ʹ-TTTTCCATGGAGCGAGCCTT-3ʹ, E2-R: 5ʹ-TTCAGGCGGACTCCACTTTC-3ʹ; E3-F: 5ʹ-TCAAACCATGGAGACCAGGC-3ʹ, E3-R: 5ʹ-GATACACTTGCCCCTGGCAT-3ʹ.
KCMF1, E1-F: 5ʹ-GAGAAAGTGGTCAGCCGTCA-3ʹ, E1-R: 5ʹ-GGGTCCCCAGGAAACAGATG-3ʹ; E2-F: 5ʹ-CTGAGTGTGTGGACTGACCC-3ʹ, E2-R: 5ʹ-GAGAGGACATGGGCGAGATG-3ʹ; E3-F: 5ʹ-ATGCAGGCAGAGAAGGTAGGT-3ʹ, E3-R: 5ʹ-GTACTCATTCTCGAACATTCCATGC-3ʹ.
MANBAL, E1-F: 5ʹ-TGGCCAAGATGTGGATGTGA-3ʹ, E1-R: 5ʹ-CCACCTCGAAGTCATAGCGG-3ʹ; E2-F: 5ʹ-TCAAAGTCCAGAAAGCACACAG-3ʹ, E2-R: 5ʹ-CTGATAAGGGCTGACTCTACGG-3ʹ; E3-F: 5ʹ-TCAAAGTCCAGAAAGCACACAG-3ʹ, E3-R: 5ʹ-CTGATAAGGGCTGACTCTACGG3ʹ.
Protein extraction and Western blotting
Total protein was extracted from cells using radio-immunoprecipitation assay (RIPA) buffer (Sigma-Aldrich). 10% sodium dodecyl sulfate polyacrylamide gel electrophoresis was used for protein separation. The separated proteins were transferred to polyvinylidene flouride membranes (Millipore). Then, the membranes were blocked with 5% skim milk for 1.5 h. After incubation with the primary antibodies at 4°C overnight, membranes were incubated with the secondary antibodies at room temperature for 1 h. Visualization of proteins was carried out using ImageJ software (Bio-Rad, Hercules, CA). Anti-AHCY (1:1000, ab134966, Abcam, MA, USA), anti-KCMF1 (1:1000, ab192761, Abcam), anti-MANBAL (1:1000, ab224611, Abcam) and anti-β-actin (1:1000, ab181092, Abcam) were implemented as the primary antibodies. Goat Anti-Rabbit IgG H&L (1:5000, ab96899, Abcam) and goat Anti-Mouse IgG H&L (1:5000, ab96879, Abcam) were used as the secondary antibodies.
Cell proliferation assay
Cell proliferation was measured using the Cell Counting Kit-8 (CCK-8) (Solarbio, Beijing, China). HSC4 and BHY cells transfected with sh-control, sh-AHCY, sh-KCMF1, sh-MANBAL or sh-TFDP1 were seeded into 96-well plates with 3000 cells per well. Cells were cultured for 0, 1, 2 and 3 days. 10 μL of CCK-8 reagent was added into each well and incubated at 37°C for 2 h. Absorbance at 450 nm (OD 450) was detected using a microplate reader (Thermo).
Statistical analysis
Experiments were replicated for three times. Data were presented as mean ± standard deviation. Statistical analysis was carried out using GraphPad Prism 7.0 with one-way analysis of variance and Student’s t-test. Overall survival analysis was performed using Kaplan–Meier method and log-rank test based on TCGA database. The prognostic impact of gene was validated using the Kaplan-Meier Plotter tool (https://www.kmplot.com) with ‘Auto select best cutoff’. P < 0.05 was regarded as significant difference.
Results
In this study, we aimed to explore novel prognostic genes regulated by super enhancers in OSCC. We screened MEblue module with the strongest correlation with tumor stage, alcohol consumption and smoking by WGCNA. Then, genes regulated by super enhancers in MEblue module were filtered. Transcription factor prediction and prognosis analysis of these genes were performed. Through these explorations, prognostic super enhancer-regulated genes (AHCY, KCMF1 and MANBAL) and transcription factor (TFDP1) were screened out. Finally, the regulation of AHCY, KCMF1 and MANBAL by super enhancers and TFDP1, as well as the effects of TFDP1, AHCY, KCMF1 and MANBAL on proliferation of OSCC cells were verified.
Co-expression network construction and key module selection
A total of 328 patients with OSCC in TCGA database were used for WGCNA analysis. The soft-thresholding power β was picked at 9 because of the scale free R^2 = 0.85 () and the high mean connectivity ().
Figure 1. Identification of the key co-expression module using WGCNA. Determination of soft-thresholding power (A/B). Cluster dendrogram was established based on dissimilarity of modules (c). Eigengene dendrogram and adjacency heatmap of co-expression modules (D/E). Heatmap of correlation relationships among module eigengenes, tumor stage, alcohol consumption and smoking. For each cell in the heatmap, the data above were the correlation coefficients and the data below were p-value (f).
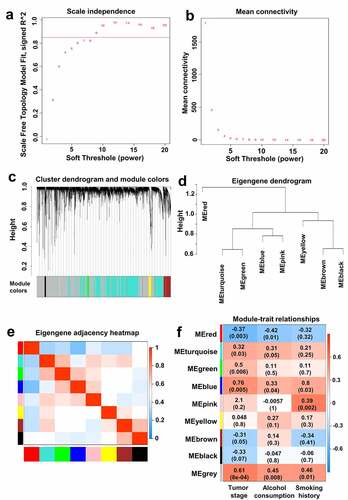
Gene co-expression network was constructed using WGCNA package in R. The criteria for cluster splitting were β = 9, modules contained >30 genes, and modules with dissimilarity<0.2 were merged. According to these cutoff values, eight gene co-expression modules were obtained, and these modules were labeled in different colors (). The dendrogram and adjacency heatmap of eigengenes of the eight co-expression modules are shown in and . Three pairs, including MEturquosie and MEgreen, MEblue and MEpink, MEbrown and MEblack, had a high degree of interactivity ( and ). MEred had the lowest interaction connectivity with other MEs ( and ). Un-coexpressed genes were classified as MEgrey module. In this study, we focused on the relationships among the modules and tumor stage, alcohol consumption and smoking history. MEturquosie, MEgreen, MEblue and MEyellow modules were positively correlated with tumor stage, alcohol consumption and smoking. Importantly, MEblue module had the highest correlation coefficients with tumor stage (r = 0.76, p = 0.005), alcohol consumption (r = 0.33, p = 0.04) and smoking history (r = 0.8, p = 0.03) (). Therefore, MEblue module was selected as the key module.
Screening and functional analysis for genes regulated by super enhancers in the key module
We scored two OSCC cells, BHY and HSC4, for H3K27ac signaling. There were 21,114 enhancers in HSC4 cells, of which 502 were super enhancers (). A total of 16,113 enhancers including 897 super enhancers in BHY cells were identified (). Gene in closest proximity to a super enhancer on the genome was regarded as a super enhance-controlled gene. Overlapping analysis of the genes in MEblue module and the super enhancer-controlled genes in HSC4 and BHY cells were performed (). The 41 overlapping genes were considered to be super enhancer-regulated genes in MEblue module ().
Figure 2. Screening and functional analysis of super enhancer-regulated genes in MEblue module. Identification of super enhancers in HSC4 and BHY cells based on H3K27ac ChIP-seq signaling (A/B). Venn diagram for overlapping of genes in MEblue module and super enhancer-controlled genes in HSC4 and BHY cells (c). Functional analysis of overlapping genes (d).
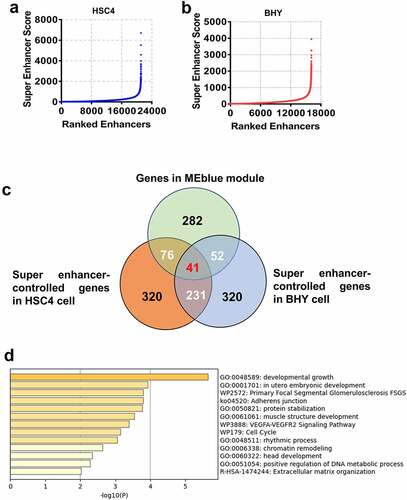
Subsequently, we performed a functional analysis of 41 overlapping genes. As shown in , functions of these genes were mainly associated with cancer progression and development, such as developmental growth, adherens junction, VEGFA-VEGFR2 signaling pathway, cell cycle and chromatin remodeling ().
Transcription factor analysis of super enhancer-regulated genes in MEblue module
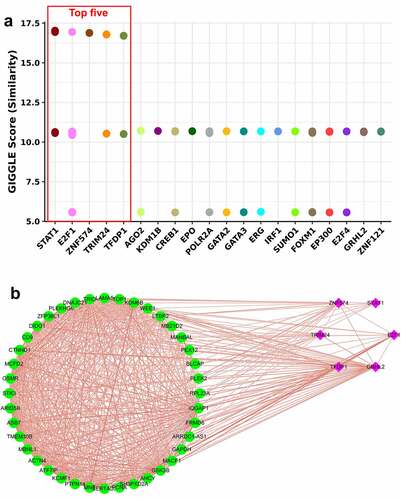
Transcription factors of the 41 overlapping genes were predicted. A total of twenty transcription factors were identified, and the top five were STAT1, E2F1, ZNF574, TRIM24 and TFDP1 (). Subsequently, we analyzed the expression correlation of overlapping genes and the top five transcription factors by constructing a network. Except for a negative correlation between TRIM24 and PLEK2, transcription factors were predominantly positively correlated with overlapping genes (). In addition, overlapping genes showed mainly positive correlations with each other ().
Figure 3. Prediction and expression correlation analysis of transcription factors of overlapping genes. Twenty potential transcription factors were predicted (a). Expression correlation network of 41 overlapping genes and the top five transcription factors. Green dot indicated the overlapping gene. Red square indicated transcription factor. Red line indicated a positive correlation. Blue line indicated a negative correlation (b).
Identification of prognostic super enhancer-regulated genes and transcription factors
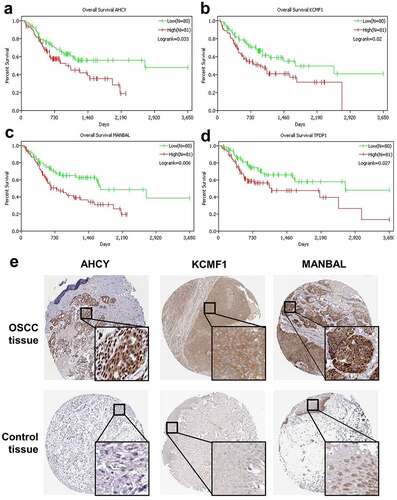
Overall survival analysis of the 41 overlapping genes and the top 5 transcription factors were performed using TCGA data. Patients were divided into high- and low-expression group according to the median. High expression of three overlapping genes (AHCY, KCMF1 and MANBAL) and one transcription factor (TFDP1) were significantly related to poor outcome in OSCC (-). Hence, AHCY, KCMF1 and MANBAL were identified as prognostic super enhancer-regulated genes. Immunohistochemical staining of AHCY, KCMF1 and MANBAL from The Human Protein Atlas database were analyzed. As expected, the expression of AHCY, KCMF1 and MANBAL were distinctly higher in OSCC tissue than the normal control tissue ().
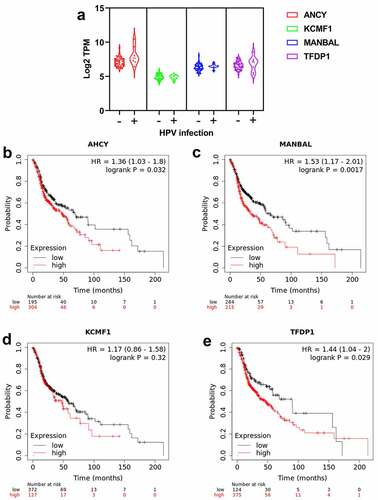
Figure 4. Prognostic and expression analysis of overlapping genes and transcription factors. Kaplan-Meier curves of overall survival were drawn using TCGA database. Three overlapping genes and one transcription factor had a significant effect on OSCC prognosis (a-d). Analysis of AHCY, KCMF1 and MANBAL expression in OSCC tissues and normal control tissues based on the human protein atlas database (e).
As human papilloma virus (HPV) infection status is an important factor in OSCC prognosis, we analyzed the relationships between AHCY, KCMF1, MANBAL and TFDP1 expression and HPV infection using TCGA database. The differences in the four genes expression between HPV positive and HPV negative tissues were not significant (). The prognostic impact of the four genes expression was further validated using the Kaplan-Meier Plotter tool. Patients with low expression of AHCY, MANBAL and TFDPI had a better prognosis (, and ), which were consistent with the results of TCGA database. Although KCMF1 expression had no significant effect on prognosis of OSCC patients, the prognostic trend of KCMF1 in the Kaplan-Meier Plotter database was consistent with that of TCGA database ().
Figure 5. Validation of the prognostic impacts of AHCY, KCMF1, MANBAL and TFDP1 on OSCC. Expression of AHCY, KCMF1, MANBAL and TFDP1 in OSCC patients with HPV positive (+) and negative (-) infection based on TCGA database (a). Overall survival of AHCY, KCMF1, MANBAL and TFDP1 using Kaplan-Meier Plotter web tool (b-e).
TFDP1 bound to super enhancers of AHCY, KCMF1 and MANBAL and regulated the expression of these genes
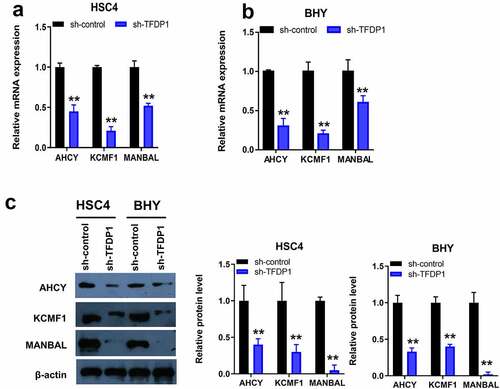
We analyzed H3K27ac ChIP-seq signal at AHCY, KCMF1 and MANBAL locus in four OSCC cell lines, including HSC4, BHY, CAL33 and BICR31 cells. The results illustrated that AHCY, KCMF1 and MANBAL included three super-enhanced regions (E1, E2 and E3), respectively (-). JQ1 treatment significantly down-regulated the expression of AHCY, KCMF1 and MANBAL in HSC4 and BHY cells (-). Combination of TFDP1 and super-enhanced regions was verified in HSC4 cells using ChIP-qPCR. Results revealed that TFDP1 bound to the three super-enhanced regions of AHCY, KCMF1 and MANBAL (-). JQ1 significantly inhibited the binding of TFDP1 to super enhancers of AHCY, KCMF1 and MANBAL (-). TFDP1 knockdown significantly reduced mRNA and protein levels of AHCY, KCMF1 and MANBAL in HSC4 and BHY cells (-). Collectively, TFDP1 regulated the expression of AHCY, KCMF1 and MANBAL by binding to the super enhancers of these genes.
Figure 6. Analysis and validation of the super enhancers of AHCY, KCMF1 and MANBAL in OSCC cells. Super enhancer regions of AHCY, KCMF1 and MANBAL locus were analyzed based on H3K27ac signal in HSC4, BHY, CAL33 and BICR31 cells. The gray box represented a super enhancer region (E1, E2 or E3) that was common to all of the four OSCC cells (a-c). RT-qPCR was performed to measure the mRNA levels of AHCY, KCMF1 and MANBAL in HSC4 and BHY cells treated with 0, 500 and 1000 nM JQ1 for 24 h (D/E). Validation of TFDP1 binding to the super enhancers of AHCY, KCMF1 and MANBAL in HSC4 cells upon treating with 500 nM JQ1 for 24 h (f-h). ** P < 0.01.
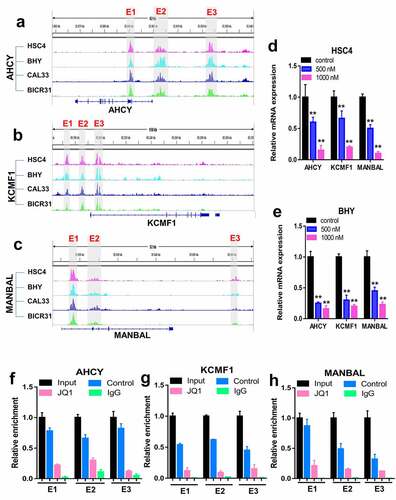
Figure 7. Knockdown of TFDP1 inhibited AHCY, KCMF1 and MANBAL expression in OSCC cells. Detection of AHCY, KCMF1 and MANBAL mRNA levels upon TFDP1 knockdown in HSC4 and BHY cells by RT-qPCR (A/B). Protein levels of AHCY, KCMF1 and MANBAL upon TFDP1 knockdown in HSC4 and BHY cells were detected by Western blot (c). ** P < 0.01.
Knockdown of AHCY, KCMF1, MANBAL and TFDP1 inhibited proliferation of OSCC cells
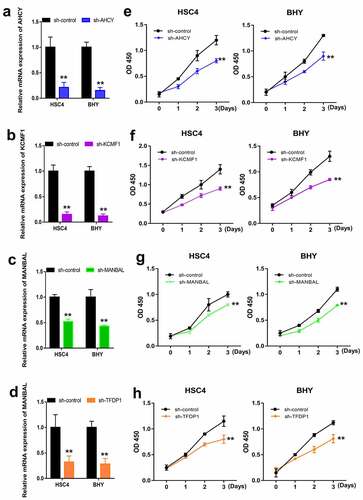
To verify the roles of AHCY, KCMF1, MANBAL and TFDP1 in OSCC cells, AHCY, KCMF1, MANBAL and TFDP1 were separately knocked down. Knockdown efficiency of AHCY, KCMF1, MANBAL and TFDP1 was examined by RT-qPCR (-). Finally, we examined the proliferation of HSC4 and BHY cells upon knockdown of AHCY, KCMF1, MANBAL and TFDP1. As shown in -, knockdown of AHCY, KCMF1, MANBAL and TFDP1 resulted in a significant decrease in cell proliferation.
Figure 8. Effects of AHCY, KCMF1, MANBAL and TFDP1 knockdown on the proliferation of OSCC cells. Detection of knockdown efficiency of AHCY, KCMF1, MANBAL and TFDP1 in HSC4 and BHY cells using RT-qPCR (a-d). CCK-8 was used to detect the proliferation of HSC4 and BHY cells upon AHCY, KCMF1, MANBAL and TFDP1 knockdown (e-h). ** P < 0.01.
Discussion
Although the diagnosis and treatment of OSCC have improved in recent years, effective markers of OSCC are still lacking [Citation27]. WGCNA is a typical systems biology algorithm for constructing gene co-expression networks. Here, we established a co-expression network for exploring the relationships of gene expression profile, tumor stage, alcohol consumption and smoking in OSCC using WGCNA. MEblue module with the highest correlation with tumor stage, alcohol consumption and smoking piqued our interest.
Epigenetic regulation plays critical roles in cancer progression. The influence of super enhancers on epigenetic regulation of cancer has attracted extensive attention. Super enhancers promote the expression of oncogenic genes [Citation28,Citation29]. In this study, we screened MEblue module for genes regulated by super enhancers. One of the characteristics of super enhancers is high H3K27ac level [Citation14,Citation15]. By analyzing H3K27ac signal, we found 502 and 897 super enhancers in HSC4 and BHY cells, respectively. There were 41 super enhancer-controlled genes that overlap with the genes in MEblue module. These overlapping genes were enriched in pathways including VEGFA-VEGFR2 signaling pathway and adherens junction. Vascular endothelial growth factor A (VEGFA) and VEGF receptor 2 (VEGFR2) are known to promote migration and angiogenesis in a variety of cancers including epithelial ovarian cancer, gastric cancer, esophageal carcinoma, pancreatic cancer and breast cancer [Citation30–34]. Adherens junction, such as E-cadherin-based adherens junction rear, is involved in epithelial-mesenchymal transition in tumor cells [Citation35]. Hence, the overlapping genes identified in this study may be involved in the regulation of tumor progression.
Transcription factors bind to enhancers and recruit co-activators to alter chromatin spatial structure and regulate target gene expression [Citation14]. Super enhancers have a greater ability to bind transcription factors than typical enhancers [Citation21,Citation36]. In this study, we found that the top five transcription factors (STAT1, E2F1, ZNF574, TRIM24 and TFDP1) were mainly positively correlated with the expression of overlapping genes. Three overlapping genes (AHCY, KCMF1, MANBAL) and one transcription factor (TFDP1) had a significant effect on the prognosis of OSCC. Additionally, AHCY, KCMF1 and MANBAL were highly expressed in OSCC tissues. Although HPV infection status is an important factor in the progression of OSCC [Citation37], differences in the expression of the four genes between HPV-positive and HPV-negative tissues were not significant. We hypothesized that the transcriptional activation of these four genes is not affected by the infection status of HPV, however this still needs further experimental confirmation in the future.
Adenosylhomocysteinase (AHCY), also known as SAHH, is essential for maintaining cellular methylation. It can be used as a biomarker for esophageal carcinoma, liver cancer, neuroblastoma and colorectal cancer [Citation38–41]. Potassium channel modulatory factor 1 (KCMF1) is a highly conserved protein that is overexpressed in epithelial cancer, especially in pancreatic cancer [Citation42]. Mannosidase beta like (MANBAL) is highly expressed in esophageal carcinoma cells [Citation43]. At present, there is a lack of studies on the function and mechanism by which AHCY, KCMF1 and MANBAL regulate OSCC. Transcription factor Dp-1 (TFDP1) forms a complex with E2F, which is involved in the regulation of cell cycle from G1 to S phase [Citation44]. TFDP1 regulates many cancers, such as non-small cell lung cancer, colon cancer and glioma [Citation45–47]. However, the role and target genes of TFDP1 in OSCC are still unclear. Here, we verified the binding of TFDP1 to the super enhancers of AHCY, KCMF1 and MANBAL by ChIP-qPCR. We also demonstrated that TFDP1 promotes the expression of these genes in HSC4 and BHY cells. In addition, we verified that AHCY, KCMF1 and MANBAL were super enhancer-regulated genes by analyzing the H3K27ac peaks at AHCY, KCMF1 and MANBAL locus in four OSCC cells, combined with the detection of the expression of AHCY, KCMF1 and MANBAL upon JQ1 treatment. Furthermore, TFDP1, AHCY, KCMF1 and MANBAL knockdown notably inhibited the proliferation of HSC4 and BHY cells. The overexpression of these super enhancer-regulated genes provided a theoretical basis for super enhancers and their regulated genes as biomarkers in OSCC diagnosis and treatment. Inhibitors of super enhancers may serve as potential therapeutic agents for OSCC. However, the more detailed functions and regulatory mechanisms of these biomarkers remain to be investigated. Further in vivo experiments are still needed to verify the effectiveness of relevant epigenetic drugs in the future.
Conclusion
In this study, three prognostic super enhancer-regulated genes (AHCY, KCMF1 and MANBAL) were screened. TFDP1 promoted the expression of AHCY, KCMF1 and MANBAL by binding to the super enhancers of these genes. TFDP1, AHCY, KCMF1 and MANBAL promoted the proliferation of OSCC cells. These biomarkers may provide a theoretical basis for the diagnosis and treatment of OSCC.
Highlights
MEblue module was identified as the key module by WGCNA.
AHCY, KCMF1, MANBAL were key prognostic genes regulated by super enhancers.
TFDP1 regulated AHCY, KCMF1 and MANBAL expression by binding to super enhancers.
Knockdown of AHCY, KCMF1, MANBAL and TFPD1 inhibited OSCC cell proliferation.
Ethics approval and consent to participate
Not applicable.
Consent to publish
Not applicable.
Data availability
Data related to this article can be obtained by contacting the corresponding author (Email: [email protected]).
Authors’ contribution
Wang Wenjing conceived this study and supervised its completion. ZHANG Liru completed the data analysis and experiments. Li Huanju, Qiu Yongle, LIU Yuanhang and LIU Xin participated in the data analysis. ZHANG Liru, Li Huanju and Qiu Yongle participated in article writing. ZHANG Liru and Wang Wenjing contributed to article modification. The article was corrected and agreed by all the authors.
Acknowledgements
The authors sincerely thank all members of the research team for their support of this study.
Disclosure statement
No potential conflict of interest was reported by the author(s).
Additional information
Funding
References
- Haddad RI, Shin DM. Recent advances in head and neck cancer. N Engl J Med. 2008;359(11):1143–1154.
- Ferlay J, Shin HR, Bray F, et al. Estimates of worldwide burden of cancer in 2008: GLOBOCAN 2008. Int J Cancer. 2010;127(12):2893–2917.
- Wang HC, Chiang CJ, Liu TC, et al. Immunohistochemical expression of five protein combinations revealed as prognostic markers in Asian oral cancer. Front Genet. 2021;12:643461.
- Cristaldi M, Mauceri R, Di Fede O, et al. Salivary biomarkers for oral squamous cell carcinoma diagnosis and follow-up: current status and perspectives. Front Physiol. 2019;10:1476.
- Hashibe M, Brennan P, Chuang SC, et al. Interaction between tobacco and alcohol use and the risk of head and neck cancer: pooled analysis in the international head and neck cancer epidemiology consortium. Cancer Epidemiol Biomarkers Prev. 2009;18(2):541–550.
- Chow LQM, Longo DL. Head and neck cancer. N Engl J Med. 2020;382(1):60–72.
- Kawakita D, Matsuo K. Alcohol and head and neck cancer. Cancer Metastasis Rev. 2017;36(3):425–434.
- Lindemann A, Takahashi H, Patel AA, et al. Targeting the DNA damage response in OSCC with TP53 mutations. J Dent Res. 2018;97(6):635–644.
- Langfelder P, Horvath S. WGCNA: an R package for weighted correlation network analysis. BMC Bioinformatics. 2008;9(1):559.
- Kakati T, Bhattacharyya DK, Barah P, et al. Comparison of methods for differential co-expression analysis for disease biomarker prediction. Comput Biol Med. 2019;113:103380.
- Thandapani P. Super-enhancers in cancer. Pharmacol Ther. 2019;199:129–138.
- Jia Q, Chen S, Tan Y, et al. Oncogenic super-enhancer formation in tumorigenesis and its molecular mechanisms. Exp Mol Med. 2020;52(5):713–723.
- Sengupta S, George RE. Super-enhancer-driven transcriptional dependencies in cancer. Trends Cancer. 2017;3(4):269–281.
- Loven J, Hoke HA, Lin CY, et al. Selective inhibition of tumor oncogenes by disruption of super-enhancers. Cell. 2013;153(2):320–334.
- Hnisz D, Schuijers J, Lin CY, et al. Convergence of developmental and oncogenic signaling pathways at transcriptional super-enhancers. Mol Cell. 2015;58(2):362–370.
- Tsompana M, Gluck C, Sethi I, et al. Reactivation of super-enhancers by KLF4 in human head and neck squamous cell carcinoma. Oncogene. 2020;39(2):262–277.
- Zhang M, Hoyle RG, Ma Z, et al. FOSL1 promotes metastasis of head and neck squamous cell carcinoma through super-enhancer-driven transcription program. Mol Ther. 2021;29(8):2583–2600.
- Zhang X, Choi PS, Francis JM, et al. Somatic superenhancer duplications and hotspot mutations lead to oncogenic activation of the KLF5 transcription factor. Cancer Discov. 2018;8(1):108–125.
- Botia JA, Vandrovcova J, Forabosco P, et al. An additional k-means clustering step improves the biological features of WGCNA gene co-expression networks. BMC Syst Biol. 2017;11(1):47.
- Heinz S, Benner C, Spann N, et al. Simple combinations of lineage-determining transcription factors prime cis-regulatory elements required for macrophage and B cell identities. Mol Cell. 2010;38(4):576–589.
- Whyte WA, Orlando DA, Hnisz D, et al. Master transcription factors and mediator establish super-enhancers at key cell identity genes. Cell. 2013;153(2):307–319.
- Zhang L, Xiong D, Liu Q, et al. Genome-wide histone H3K27 acetylation profiling identified genes correlated with prognosis in papillary thyroid carcinoma. Front Cell Dev Biol. 2021;9:682561.
- Zhou Y, Zhou B, Pache L, et al. Metascape provides a biologist-oriented resource for the analysis of systems-level datasets. Nat Commun. 2019;10(1):1523.
- Zheng R, Wan C, Mei S, et al. Cistrome data browser: expanded datasets and new tools for gene regulatory analysis. Nucleic Acids Res. 2019;47(D1):D729–D735.
- Otasek D, Morris JH, Boucas J, et al. Cytoscape automation: empowering workflow-based network analysis. Genome Biol. 2019;20(1):185.
- Shannon P. Cytoscape: a software environment for integrated models of biomolecular interaction networks. Genome Res. 2003;13(11):2498–2504.
- Ribeiro IP, Esteves L, Santos A, et al. A seven-gene signature to predict the prognosis of oral squamous cell carcinoma. Oncogene. 2021;40(22):3859–3869.
- Kim TM, Huang W, Park R, et al. A developmental taxonomy of glioblastoma defined and maintained by MicroRNAs. Cancer Res. 2011;71(9):3387–3399.
- Wang D, Gu J, Wang T, et al. OncomiRDB: a database for the experimentally verified oncogenic and tumor-suppressive microRNAs. Bioinformatics. 2014;30(15):2237–2238.
- Rao X, Wan L, Jie Z, et al. Upregulated miR-27a-3p indicates a poor prognosis in pancreatic carcinoma patients and promotes the angiogenesis and migration by epigenetic silencing of GATA6 and activating VEGFA/VEGFR2 signaling pathway. Onco Targets Ther. 2019;12:11241–11254.
- Refolo MG, Lotesoriere C, Lolli IR, et al. Molecular mechanisms of synergistic action of ramucirumab and paclitaxel in gastric cancers cell lines. Sci Rep. 2020;10(1):7162.
- Zhao S, Guan X, Hou R, et al. Vitexin attenuates epithelial ovarian cancer cell viability and motility in vitro and carcinogenesis in vivo via p38 and ERK1/2 pathways related VEGFA. Ann Transl Med. 2020;8(18):1139.
- Zhang Q, Lu S, Li T, et al. ACE2 inhibits breast cancer angiogenesis via suppressing the VEGFa/VEGFR2/ERK pathway. J Exp Clin Cancer Res. 2019;38(1):173.
- Li CH, Sun XJ, Niu SS, et al. Overexpression of IQGAP1 promotes the angiogenesis of esophageal squamous cell carcinoma through the AKT and ERKmediated VEGFVEGFR2 signaling pathway. Oncol Rep. 2018;40(3):1795–1802.
- Rubtsova SN, Zhitnyak IY, Gloushankova NA. Phenotypic plasticity of cancer cells based on remodeling of the actin cytoskeleton and adhesive structures. Int J Mol Sci. 2021;22(4):4.
- Hnisz D, Abraham BJ, Lee TI, et al. Super-enhancers in the control of cell identity and disease. Cell. 2013;155(4):934–947.
- Maxwell JH, Grandis JR, Ferris RL. HPV-associated head and neck cancer: unique features of epidemiology and clinical management. Annu Rev Med. 2016;67(1):91–101.
- Novak EM, Halley NS, Gimenez TM, et al. BLM germline and somatic PKMYT1 and AHCY mutations: genetic variations beyond MYCN and prognosis in neuroblastoma. Med Hypotheses. 2016;97:22–25.
- Yin HR, Zhang L, Xie LQ, et al. Hyperplex-MRM: a hybrid multiple reaction monitoring method using mTRAQ/iTRAQ labeling for multiplex absolute quantification of human colorectal cancer biomarker. J Proteome Res. 2013;12(9):3912–3919.
- Yoshimoto S, Loo TM, Atarashi K, et al. Obesity-induced gut microbial metabolite promotes liver cancer through senescence secretome. Nature. 2013;499(7456):97–101.
- Li Q, Mao L, Wang R, et al. Overexpression of S-adenosylhomocysteine hydrolase (SAHH) in esophageal squamous cell carcinoma (ESCC) cell lines: effects on apoptosis, migration and adhesion of cells. Mol Biol Rep. 2014;41(4):2409–2417.
- Beilke S, Oswald F, Genze F, et al. The zinc-finger protein KCMF1 is overexpressed during pancreatic cancer development and downregulation of KCMF1 inhibits pancreatic cancer development in mice. Oncogene. 2010;29(28):4058–4067.
- Sud N, Sharma R, Ray R, et al. Differential expression of beta mannosidase in human esophageal cancer. Int J Cancer. 2004;112(5):905–907.
- Zhang J, Li H, Yabut O, et al. Cdk5 suppresses the neuronal cell cycle by disrupting the E2F1-DP1 complex. J Neurosci. 2010;30(15):5219–5228.
- Morimoto Y, Mizushima T, Wu X, et al. miR-4711-5p regulates cancer stemness and cell cycle progression via KLF5, MDM2 and TFDP1 in colon cancer cells. Br J Cancer. 2020;122(7):1037–1049.
- Zhan W, Wang W, Han T, et al. COMMD9 promotes TFDP1/E2F1 transcriptional activity via interaction with TFDP1 in non-small cell lung cancer. Cell Signal. 2017;30:59–66.
- Lu X, Lv XD, Ren YH, et al. Dysregulation of TFDP1 and of the cell cycle pathway in high-grade glioblastoma multiforme: a bioinformatic analysis. Genet Mol Res. 2016;15(2):2.