
ABSTRACT
To investigate the effects of myeloid ecotropic viral integration site-1 (MEIS1) on the proliferation and apoptosis of acute myeloid leukemia (AML) cells and the anticancer effects of the drug, we screened Kasumi-6, KG-1, and Kasumi-1 cells using quantitative reverse transcription polymerase chain reaction. Kasumi-6 and Kasumi-1 cells were subjected to human antigen R (HuR)-mediated interference (IV). Hexokinase 2 (HK2) expression and phosphorylation of protein kinase B (p-AKT) and mammalian target of rapamycin (p-mTOR) were observed with Western blotting. Cell proliferation was assessed using Cell Counting Kit-8, apoptosis was examined using Hoechst 33,258 staining, and glucose uptake was detected with a colorimetric biochemical assay kit. We found that, among the three cell lines tested, MEIS1 expression was highest in Kasumi-1 cells, which were therefore selected for subsequent experiments. Kasumi-1 cells receiving IV showed significantly decreased proliferation (p < 0.05) and increased apoptosis compared to the control group. Compared with the controls, IV significantly increased the expression of HK2, p-AKT, p-mTOR, multidrug resistance-associated protein 1 and P-glycoprotein (P < 0.05), but decreased glucose uptake. Treatment with adriamycin, daunorubicin and imatinib resulted in a progressive increase in inhibition of cell proliferation, with the IV group showing the highest inhibition rate among the three groups (P < 0.05). Thus, inhibition of MEIS1 activity promoted apoptosis, inhibited the proliferation of Kasumi-1 and Kasumi-6 cells, and increaseed the anticancer effect of the drugs, suggesting that inhibition of MEIS1 may be a potential strategy for the treatment of AML.
KEYWORDS:
Introduction
Acute myeloid leukemia (AML) is a malignant disease of myeloid hematopoietic stem/progenitor cells, caused mainly by the abnormal proliferation of primitive and naïve myeloid cells in the bone marrow and peripheral blood [Citation1]. Anemia, bleeding, infection, and fever are typical clinical symptoms of AML. AML treatment is primarily based on chemotherapy, and commonly used chemotherapeutic drugs include doxorubicin (adriamycin), daunorubicin, imatinib, and idarubicin [Citation2]. However, prolonged use of chemotherapeutic agents increases the likelihood of developing drug resistance, which weakens drug efficacy. Therefore it is critical to identify additional strategies to treat AML.
Tumor cells can evade normal apoptotic processes through abnormal glycometabolic behavior, which enhances cell proliferation and migration. The primary glycometabolic perturbation in tumor cells is known as the Warburg effect, which is a key factor in the pathogenesis of tumors [Citation3]. The Warburg effect provides growth advantages for cancer cells, allowing them to escape apoptosis and promote tumor metastasis [Citation4]. In addition, the Warburg effect creates a microenvironment that favors the emergence of drug-resistant cancer cells [Citation5]. Recent findings suggest that the family of protein kinase B/mammalian target of rapamycin (AKT/mTOR) signaling pathway is a major driver of altered glycometabolism in cancer cells, and that specifically inhibiting the glycometabolism of tumor cells can suppress their proliferation and decrease their aggressiveness [Citation6-10].
The myeloid ecotropic viral integration site-1 (MEIS1) gene, which is located on human chromosome 2p13-p14, is a of the homeobox HOX branch gene that encodes a protein belonging to the ‘three amino acid loop extension’ family [Citation11,Citation12]. The expression of MEIS1 in the bone marrow is closely associated with the development and progression of leukemia, and is positively correlated with poor prognosis [Citation13,Citation14]. MEIS1 is also closely related to cell metabolism, angiogenesis, and tumor resistance [Citation15-19]. Arabanian et al. have observed that endothelin receptor type A (EDNRA) is a candidate for HOXA9 and MEIS1 as a downstream target of AML cells. MEIS1 combines with the EDNRA promoter domain; overexpression of EDNRA can increase bone marrow cell proliferation and enhance the anti-apoptotic effect of these cells [Citation20]. However, the impact of MEIS1 on the Warburg effect and the proliferation and apoptosis of AML cells have not yet been reported.
In this study, human AML cell lines Kasumi-6, KG-1, and Kasumi-1 and normal human peripheral blood mononuclear cells were cultured in vitro, and cells with abnormally high expression of MEIS1 were screened. Molecular and cellular experiments were performed to determine the influence of MEIS1 on the Warburg effect in AML cells and to provide novel strategies for the clinical management of AML. This study is aimed to explore the role of MEIS1 in the Warburg effect in AML cells as well as its effect on the proliferation and drug resistance of tumor cells, in an attempt to provide a new therapeutic strategy for tumors.
Materials and methods
Cell culture
The AML cell lines Kasumi-6, KG-1, and Kasumi-1 were obtained from the American Type Culture Collection (ATCC, Virginia, USA), and normal peripheral blood THP-1 monocytes were purchased from the Stem Cell Bank, Chinese Academy of Sciences. Cells were cultured in RPMI 1640 medium (SH30809.01B, Hyclone) or Iscove’s Modified Dulbecco’s Medium (SH30228.01B, Hyclone) supplemented with 10% or 20% fetal bovine serum (10,270–106, Gibco) in an incubator containing 5% CO2 and 95% air, at 37°C for 24 h. Cells were passaged or cryopreserved when they reached 70–80% density [Citation21].
Construction of MEIS1 interference vector
Full-length cDNA of human MEIS1 (Gene ID: 4211) was obtained from the NCBI database. Kasumi-1 and Kasumi-6 cells were transfected with MEIS1 siRNA (5ʹ-CCATCCTTCAAGTGAACAA-3ʹ, Addgene) using Lipofectamine 2000 reagent, according to the manufacturer’s instructions of the. At 24 hours before transfection, seeded 0.5–2 × 10⁵ cells were seeded 500 µL anti-resistant medium, and the number of cells was adjusted to 4–8 × 10⁵/well during transfection. A total of 1 μL siRNA (10 µM) was diluted in 50 µL Opti-MEM, diluted with 3 μL Lipofectamine® RNAiMAX in 50 µL Opti-MEM, mixed and incubated at 4°C for 5 min. The cell culture plate was then placed in a 37°C, 5% CO2 incubator for 24 h. The cell experiments were divided into three groups: control, empty vector (EV), and MEIS1 siRNA (IV). Transfection efficiency was determined by quantitative reverse transcription-polymerase chain reaction (qRT-PCR) and Western blotting [Citation22].
RNA isolation and qRT-PCR
Total RNA was extracted from Kasumi-1 and Kasumi-6 cells using TRIzol reagent according to the manufacturer’s instructions, and reverse-transcribed into cDNA using the RevertAid First Strand cDNA Synthesis Kit (639,505, TAKARA). The synthesized cDNA was subjected to qRT-PCR using the SYBR Green PCR Master Mix according to the manufacturer’s instructions (KM4101, KAPA Biosystems). Data were collected and analyzed using the 2-ΔΔCt method. The primers were designed and configured by Nanjing Kingsy Biotechnology Co., Ltd. (). All parts of the experiment were performed in strict according with the manufacturer’s instructions.
Table 1. Primer sequences
Cell counting kit-8 (CCK-8)
Cells (5 × 10³) were seeded in a 96-well plate in RPMI 1640 medium containing 10% fetal bovine serum. The cells were treated with different concentrations of adriamycin (0, 0.25, 0.75, 1.5, 3.0, 6.0, and 12.0 µmol/L), daunorubicin (0, 0.01, 0.025, 0.05, 0.25, and 1.25 µg/mL, and imatinib (0, 0.25, 0.5, 1.0, 2.0, and 5.0 μM) for 24 h, as previously described in literature [Citation21-23]. Next, 10 μL of CCK-8 solution was added to each well, and the cells were cultured at 37°C for 4 h. The optical density was measured at 450 nm. The experiments were performed in strict accordance with the manufacturer’s instructions.
Flow cytometry
For apoptosis, discard the culture broth was discarded, and the residual broth using PBS. This was then centrifuge and the cells collected, and the supernatant discarded. The cells were resuspended in 200 µL PBS. Annexin V-FITC (10 µL) and PI (10 µL) were added, mixed gently, and incubated for 30 min at 4°C in the dark. A total of 300 µL of PBS was added, followed by flow cytometry [Citation23]. For cell cycle analysis, cells were collected and resuspended in 300 µL PBS, then 700 µL anhydrous ethanol was added and fixed for more than 24 h in a − 20°C freezer. The fixed samples were removed and centrifuged at 700 × g for 5 min at 4°C, and the supernatant was discarded. The samples were washed twice with PBS (1 mL). Cells were resuspended in 100 μL of RNase A solution at a concentration of 1 mg/mL, and RNA was digested at 37°C for 30 min. PI (400 μL at a concentration of 50 μg/mL) was added and incubated for 10 min at 4°C in the dark. Cellular DNA content was then measured using flow cytometry to determine the proportion of cells in each part of the cell cycle [Citation24]. All results were analyzed using NovoExpress software for results.
Measurement of glucose uptake rate
Glucose uptake was measured using a kit according to the manufacturer’s instructions (KA4086, Abnova). Detection was performed in strict accordance with the kit instructions.
Western blot
Protein extracts (20 μg) prepared from the Kasumi-1 and Kasumi-6 cells were separated by 12% SDS-PAGE and transferred to PVDF membranes (Millipore, USA). The membranes were blocked for 120 min in a skim milk blocking buffer, washed five times with Tris-buffered saline with 0.1% Tween 20 detergent (TBST) containing 0.1% Tween 20, and probed with primary antibodies against hexokinase 2 (HK2, 1:1000, PAB30271, Bioswamp), AKT (1:1000, PAB30596, Bioswamp), p-AKT (1:1000, ab38449, Abcam), mTOR (1:1000, PAB30674, Bioswamp), p-mTOR (1:1000, PAB36313-P, Bioswamp), Multidrug resistance-associated protein 1 (MRP1) (1:1000, ab23338, Abcam), P-glycoprotein (P-gp, 1:1000, 22,336-1-AP, Proteintech), and GAPDH (1:1000, PAB36269, Bioswamp) overnight at 4°C. The membranes were washed three times with TBST and incubated with secondary antibodies (goat anti-rabbit IgG, 1:20,000, PAB160011, Bioswamp) for 60 min [Citation25]. Protein bands were examined using enhanced chemiluminescence (Tanon-5200, TANON) and analyzed using AlphaEase FC gel image analysis software.
Statistical analysis
Data are expressed as the mean ± standard deviation. To analyze the differences between the groups, data comparisons were performed with t- tests and one-way analysis of variance using SPSS 22 statistical software. P < 0.05 was considered statistically significant.
Results
MEIS1 mRNA expression in Kasumi-6, KG-1, Kasumi-1, and THP-1 cells
In order to screen the cell line that are most suitable and this experiment, the expression of MEIS1 in the three cell lines was detected using qPCR. As illustrated in , with respect to THP-1 cells, the mRNA expression of MEIS1 was significantly increased in the KG-1, Kasumi-1, and Kasumi-6 cells; the Kasumi-1, and Kasumi-6 cell lines had the highest expression (P < 0.001). Therefore, Kasumi-1 and Kasumi-6 cells were used for subsequent experiments.
Figure 1. MEIS1 mRNA expression was quantified by qRT-PCR in THP-1, Kasumi-6, KG-1 and Kasumi-1 cells. *P < 0.05, **P < 0.01, ***P < 0.001 vs. control (n = 3).
Controls for interference expression
After characterization of transfection efficiency ( and ), the expression of MEIS1 mRNA was measured in the control, EV, and IV groups in order to confirm MEIS1 inhibition by the interference vector. In comparison to the control and EV groups, MEIS1 expression was significantly decreased in the IV group (P < 0.001) in Kasumi-1 and Kasumi-6 cells ( and ).
Figure 2. MEIS1 repression in Kasumi-1 and Kasumi-6 cells. (a) MEIS1 mRNA expression in Kasumi-1 cells. (b) MEIS1 mRNA expression in Kasumi-6 cells. *P < 0.05, **P < 0.01, ***P < 0.001 vs. control (n = 3).
Inhibition of MEIS1 promotes cell apoptosis and inhibits cell proliferation
Next, we next performed a CCK-8 assay to evaluate the role of MEIS1 in cell proliferation (). Compared with the control group, the proliferation rate in the IV group was significantly decreased (P < 0.001). Flow cytometry was performed carried out in order to quantify apoptosis in Kasumi-1 and Kasumi-6 cells. As shown in , the apoptotic rate in the IV group was higher than that in the control and EV groups (P < 0.001). We further examined the expression of glucose-metabolizing proteins and pathways associated with proliferation. As shown in , the rate of glucose uptake in the IV group was significantly lower than that in the control and EV groups (P < 0.01 and P < 0.001, respectively). shows that the expression of HK2, p-AKT, and p-mTOR proteins in the IV group was significantly decreased (P < 0.01 and P < 0.001, respectively). Together, these results suggest that the inhibition of MEIS1 expression may inhibit cell proliferation via its effect on glucose metabolism in Kasumi-1 and Kasumi-6 cells.
Figure 3. Proliferation of Kasumi-1 and Kasumi-6 cells in control, EV, and IV groups. (a) The extent of cell proliferation in control, EV, and IV groups was detected using a CCK-8 assay. (b) Apoptosis was detected by flow cytometry. *P < 0.05, **P < 0.01, ***P < 0.001 vs. control (n = 3).
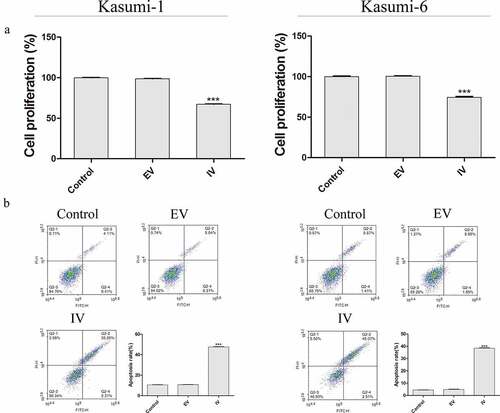
Figure 4. Effect of MEIS1 knockdown on the Warburg effect in Kasumi-1 and Kasumi-6 cells. (a) Glucose uptake rate was evaluated using a glucose uptake assay kit. (b) Expression of HK2, p-AKT, and p-mTOR proteins was measured by Western blot. *P < 0.05, **P < 0.01, ***P < 0.001 vs. control (n = 3).
Effect of MEIS1 on drug sensitivity in Kasumi-1 cells
To further investigate the resistance of si-MEIS1 to AML cells, we next examined the expression of the resistance-related proteins, MRP1 and P-gp. shows that MRP1 and P-gp levels were lower in the IV group than in when compared with the control and EV groups (P < 0.05). We also observed a dose-dependent reduction in proliferation in response to adriamycin, daunorubicin, and imatinib, which was significantly higher in the IV group (, p < 0.05). These results suggest that inhibition of MEIS1 expression enhances the anti-proliferative effects of these anticancer agents.
Figure 5. Effect of MEIS1 on drug resistance of Kasumi-1 and Kasumi-6 cells. (a) The expression of MRP1 and P-gp proteins was measured by Western blot. (b) The extent of cell proliferation inhibition (%) in control, EV, and IV groups treated with different concentrations of Adriamycin (0–12 µmol/L), daunorubicin (0–1 µg/mL) and imatinib (0–5 μM) was evaluated using a CCK-8 assay. *P < 0.05, **P < 0.01, ***P < 0.001 vs. control (n = 3).
Discussion
Drug resistance is a frequent problem in AML treatment and is mainly manifested as a decrease in the sensitivity of cancer cells to chemotherapeutic drugs after a few sessions of treatment [Citation26]. As a result, the efficacy of chemotherapeutic drugs progressively decreases, ultimately leading to failure of chemotherapy failture.
The Warburg effect describes the switch to anaerobic respiration even under oxygen-replete conditions; this adaptive metabolism is exploited by tumor cells to produce a large amount of ATP [Citation4]. The Warburg effect is often observed in tumor cells that are affected by local hypoxia, which partially inhibits mitochondrial oxidative phosphorylation [Citation3]. The ensuing anaerobic metabolism of glucose generates a large amount of lactic acid, leading to microenvironment acidification [Citation27]. Acidified microenvironments enhance hypoxia-inducible factor-1 (HIF-1) expression and promote the survival, proliferation, and metastasis of cancer cells [Citation28]. Tumor cell metabolism requires a large amount of glucose, thus reducing the concentration of glucose in the internal environment. Paradoxically, the enhanced utilization of glucose can lead to rapid apoptosis in some tumor cells [Citation29]. In this study, we found that glucose content and cell proliferation rate decreased significantly following inhibition of MEIS1 expression. This was accompanied by a significant increase in apoptosis, suggesting that MEIS1 inhibition suppresses the Warburg effect by reducing glucose uptake, which in turn inhibits tumor cell proliferation and facilitates apoptosis.
PI3K/AKT/mTOR signaling is one of the most important regulators of the Warburg effect in cancer cells. PI3K phosphorylation can activate AKT, which then upregulates the expression of HIF-1a through mTOR, thereby upregulating the expression of pyruvate dehydrogenase kinase isoenzyme 1 (PDK1), a key enzyme in glucose metabolism. PDK1 inhibits pyruvate dehydrogenase (PDH) activity [Citation30] and initiates the switch from aerobic glucose metabolism to increased glycolysis and lactate production [Citation31,Citation32]. Consistent with this, PI3K/AKT signaling promotes the Warburg effect in tumor cells [Citation7], while inhibitors of PI3K (LY294002) and mTOR (A-443654) effectively inhibit the Warburg effect and tumor cell proliferation [Citation33,Citation34]. In this study, AKT/mTOR signaling was significantly attenuated after MEIS1 expression was inhibited, suggesting that MEIS1 drives the Warburg effect in tumors via the AKT/mTOR signaling pathway.
Many anti-neoplastic drugs induce irreversible cellular damage by affecting nucleic acid formation and protein synthesis by directly damaging DNA or by disrupting the balance of hormone levels. After a certain number of course of treatment, most patients will develop drug resistance. The main mechanisms underlying drug resistance include inhibition of cellular drug uptake, promotion of drug efflux, enhanced enzymatic activity of drug targets, enhanced DNA repair, and elevated expression of molecules associated with drug resistance or anti-apoptosis. Enhanced glycolysis in tumor cells leads to higher production of ATP and NADPH, and high concentrations of ATP can activate ATP-binding cassette transporters, thereby promoting drug efflux [Citation32] and upregulation of HIF-1 expression. Enhanced activity of key enzymes in glycolysis reduces the generation of reactive oxygen species by the tricarboxylic acid cycle, prevents DNA damage, and inhibits tumor cell apoptosis [Citation35,Citation36]. NADPH is an important antioxidant that inhibits oxidative damage induced by chemotherapeutic drugs [Citation37,Citation38]. Here, we observed that the exposure of resistance-associated proteins MRP1 and P-gp in the IV group was markedly lower than that in the control, suggesting that inhibition of MEIS1 may suppress drug resistance in Kasumi-1 cells. To verify this conclusion, we knocked down MEIS1 in Kasumi-1 cells before treatment them continuously with different concentrations of adriamycin, daunorubicin, and imatinib. This revealed that all three drugs were significantly more effective in MEIS1-knockdown cells than in control cells. The vendor of the cell lines we used in our study (ATCC) did not indicate that any of them exhibited a drug resistance phenotype. Therefore we cannot conclusively determine whether MEIS1 inhibition is a bona fide strategy for abrogating drug resistance, or whether it sensitizes cells to these drugs by another mechanism. This will be addressed in future studies. This study has some limitations. We did not study the survival rate of leukemia cells in chemotherapy after MEIS1 knockout to investigate whether MEIS1 can overcome drug resistance.
Conclusions
Inhibition of MEIS1 significantly increases the anticancer effect of drugs by inhibiting proliferation and promoting apoptosis, which may be due to disruption of MEIS1-dependent stimulation of the Warburg effect.
Highlights
Due to drug resistance of tumor cells, the therapeutic effect of AML is not presently ideal.
MEIS1 may be a key protein that regulates AML cell resistance.
Inhibiting MEIS1 activity can promote apoptosis, inhibit proliferation, and increase the drug sensitivity of Kasumi-1 cells.
Author contributions
YL Jin collected and analyzed the data. YL Jin and JH Wang drafted the manuscript. MM Zhao and LJ Hong commented in detail on the manuscript. All authors read and approved the final manuscript.
Disclosure statement
No potential conflict of interest was reported by the author(s).
Data availability
The data generated form this study are available from the corresponding author upon request.
Additional information
Funding
References
- Appelbaum FR, Rowe JM, Radich J, et al. Acute myeloid leukemia. N Engl J Med. 1999;341(14):1051–1062.
- Müller MR, Lennartz K, Boogen C, et al. Cytotoxicity of Adriamycin, idarubicin, and vincristine in acute myeloid leukemia: chemosensitization by verapamil in relation to P-glycoprotein expression. Ann Hematol. 1992;65(5):206–212.
- Jiang SH, Li J, Dong FY, et al. Increased serotonin signaling contributes to the Warburg effect in pancreatic tumor cells under metabolic stress and promotes growth of pancreatic tumors in mice. Gastroenterology. 2017;277-291:2017.
- Hsu PP, Sabatini DM. Cancer cell metabolism: warburg and beyond. Cell. 2008;134:703–707.
- Bhattacharya B, Mohd Omar MF, Soong R. The warburg effect and drug resistance. Brit J Pharmacol. 2016;173:970–979.
- Xiao Y, Peng H, Hong C, et al. PDGF promotes the warburg effect in pulmonary arterial smooth muscle cells via activation of the PI3K/AKT/mTOR/HIF-1α signaling pathway. Cell Physiol Biochem. 2017;42:1603–1613.
- Jing L, Pan C, Guo L, et al. A new mechanism of trastuzumab resistance in gastric cancer: macc1 promotes the warburg effect via activation of the PI3K/AKT signaling pathway. J Hematol Oncol. 2016;9:76.
- Zhang BM, Hao X, Chen BY, et al. Relationship between mitochondrial bound hexokinase and tumor development and PI3K/AKT signal pathway. World Latest Med Inform. 2016;16(77):1-3.
- Villaume K, Blanc M, Gouysse G, et al. VEGF Secretion by neuroendocrine tumor cells is inhibited by octreotide and by Inhibitors of the PI3K/AKT/mTOR pathway. Neuroendocrinology. 2010;91:268–278.
- Su MA, Huang YT, Chen IT, et al. An invertebrate warburg effect: a shrimp virus achieves successful replication by altering the host metabolome via the PI3K-Akt-mTOR pathway. Plos Pathog. 2014;10:e1004196.
- Moskow JJ, Bullrich F, Huebner K, et al. PBX1-related homeobox gene involved in myeloid leukemia in BXH-2 mice. Mol Cell Biol. 1995;15:5434–5443.
- Smith JE, Bollekens JA, Inghirami G, et al. Cloning and mapping of the meis 1 gene, the human homolog of a leukemogenic gene. Genomics. 1997;43:99–103.
- Thorsteinsdottir U, Kroon E, Jerome L, et al. Defining roles for Hox and meis 1 genes in induction of acute myeloid leukemia. Mol Cell Biol. 2001;21:224–234.
- Adamaki M, Lambrou GI, Athanasiadou A, et al. HOXA9 and meis 1 gene overexpression in the diagnosis of childhood acute leukemias: significant correlation with relapse and overall survival. Leuk Res. 2015;39:874–882.
- Argiropoulos B, Yung E, Xiang P, et al. Linkage of the potent leukemogenic activity of meis 1 to cell-cycle entry and transcriptional regulation of cyclin D3. Blood. 2010;115:4071–4082.
- Ho TT, He X, Beck WT. Abstract 796: novel mechanisms of drug resistance in leukemia cells associated with changes in HoxA9 and microRNA expression. Cancer Res. 2012;72: 796–796.
- Gundry M, Brunetti L, Sheppard H, et al. Nuclear relocalization of mutant npm1 induces downregulation of hox/meis 1, terminal differentiation, and cell cycle arrest. Exp Hematol. 2017;53:S45.
- Roychoudhury J, Clark JP, Graciamaldonado G, et al. Meis 1 regulates an HLF-oxidative stress axis in MLL-fusion gene leukemia. Blood. 2015;125:2544.
- Crijns AP, De GP, Geerts D, et al. Meis 1 and PBX homeobox proteins in ovarian cancer. Eur J Cancer. 2007;43:2495–2505.
- Arabanian LS, Johansson P, Staffas A, et al. The endothelin receptor type A is a downstream target of Hoxa9 and Meis1 in acute myeloid leukemia. Leukemia Res. 2018. DOI:10.1016/j.leukres.2018.10.005.
- Xu H, Mi R, Fan R, et al. Effects of thalidomide combined with interferon on inhibiting Kasumi-1 cell proliferation. Adv Clin Exp Med. 2016;25(3):403–408.
- Johng D, Torga G, Ewing CM, et al. HOXB13 interaction with MEIS1 modifies proliferation and gene expression in prostate cancer. Prostate. 2019;79(4):414–424.
- Zargari S, Negahban Khameneh S, Rad A, et al. MEIS1 promotes expression of stem cell markers in esophageal squamous cell carcinoma. BMC Cancer. 2020 20;20(1):789.
- Mahmoud AI, Kocabas F, Muralidhar SA, et al. Meis1 regulates postnatal cardiomyocyte cell cycle arrest. Nature. 2013 9;497(7448):249–253.
- Lyu S, Xing H, Liu Y, et al. Deficiency of Meis1, a transcriptional regulator, in mice and worms: neurochemical and behavioral characterizations with implications in the restless legs syndrome. J Neurochem. 2020;155(5):522–537.
- Baines P, Limaye M, Hoy T, et al. Drug-resistance in acute myeloid-leukemia. Br J Haematol. 1993;84: 2–2.
- Taisuke M, Shun D, Yasuyuki S. Lactic acid promotes cell survival by blocking autophagy of B16F10 mouse melanoma cells under glucose deprivation and hypoxic conditions. Biol Pharm Bull. 2019;42(5):837–839.
- Zheng YF, Chen HR, Zhao Y, et al. Knockdown of FBXO22 inhibits melanoma cell migration, invasion and angiogenesis via the HIF-1α/VEGF pathway. Invest New Drugs. 2020;38(1):20–28.
- Spitz DR, Sim JE, Ridnour LA, et al. Glucose deprivation-induced oxidative stress in human tumor cells. A fundamental defect in metabolism? Ann N Y Acad Sci. 2000;899:349–362.
- Cottrill KA, Chan SY. Metabolic dysfunction in pulmonary hypertension: the expanding relevance of the warburg effect. Eur J Clin Invest. 2013;43:855–865.
- Paulin R, Michelakis ED. The metabolic theory of pulmonary arterial hypertension. Circ Res. 2014;115:148–164.
- Robey RB, Hay N. Is Akt the “Warburg kinase”?-Akt-energy metabolism interactions and oncogenesis. Semin Cancer Biol. 2009;19:25–31.
- Perez J, Hill B, Benavides G, et al. Role of cellular bioenergetics in smooth muscle cell proliferation induced by platelet-derived growth factor. Biochem J. 2010;428:255–267.
- Houssaini A, Abid S, Mouraret N, et al. Rapamycin reverses pulmonary artery smooth muscle cell proliferation in pulmonary hypertension. Am J Resp Cell Mol. 2013;48:568–577.
- Nuruzzaman M, Zhang R, Cao HZ, et al. Plant pleiotropic drug resistance transporters: transport mechanism, gene expression, and function. J Integr Plant Biol. 2014;56:729–740.
- Murono K, Tsuno NH, Kawai K, et al. SN-38 overcomes chemoresistance of colorectal cancer cells induced by hypoxia, through HIF1α. Anticancer Res. 2012;32:865–872.
- Flamant L, Notte A, Ninane N, et al. Anti-apoptotic role of HIF-1 and AP-1 in paclitaxel exposed breast cancer cells under hypoxia. Mol Cancer. 2010;9:191.
- Zhang QG, Raz L, Wang R, et al. Estrogen attenuates ischemic oxidative damage via an estrogen receptor alpha-mediated inhibition of NADPH oxidase activation. J Neurosci. 2009;29:13823.