
ABSTRACT
Alcoholic liver disease (ALD) denotes a series of liver diseases caused by ethanol. Recently, immune-related genes (IRGs) play increasingly crucial role in diseases. However, it’s unclear the role of IRGs in ALD. Bioinformatic analysis was used to discern the core immune-related differential genes (IRDGs) in the present study. Subsequently, Cell Counting Kit-8 say, oil red O staining, and triglyceride detection were employed to explore optimal experimental conditions of establishing hepatocellular models of early ALD. Ultimately, real-time reverse transcription-PCR and immunohistochemistry/immunocytochemistry methods were adopted to verify the expressions of mRNA and proteins of core IRDGs, respectively. C-X-C Motif Chemokine Ligand 1 (Cxcl1) and Cxcl6 were regarded as core IRDGs via integrated bioinformatics analysis. Besides, Lieber Decarli Ethanol feeding and 200 mM and 300 mM ethanol stimulating L02 cells for 36 h can both successfully hepatocellular model. In ethanol groups, the levels of CXCL1 and CXCL6 mRNA were significantly upregulated than pair-fed groups (P < 0.0001). Also, immunohistochemistry revealed that positive particles of CXCL1 and CXCL6 in mice model of early ALD were obviously more than control groups (P < 0.0001). Besides, in L02 hepatocytes stimulated by ethanol, CXCL1 and CXCL6 mRNA were over-expressed, compared with normal L02 cells (P < 0.0001). Meanwhile, immunocytochemistry indicated that CXCL1 and CXCL6 proteins in hepatocellular model of early ALD were higher than normal L02 hepatocytes stimulus (P < 0.0001). Ethanol promoted the upregulation of Cxcl1 and Cxcl6 mRNA and proteins in models of early ALD, denoting their potentiality of acting as biomarkers of ALD.
1. Introduction
Alcoholic liver disease (ALD) refers to a series of diseases caused by ethanol, encompassing steatosis, steatohepatitis, fibrosis, as well as cirrhosis [Citation1]. Alcohol is an independent risk factor for the ALD. In the United States, excessive alcohol consumption is the third leading cause of individual death [Citation2]. According to the data of National Center for Health Statistics, 2.6% of the total deaths in the US were pertinent to alcohol in 2017 (total 2.8 million deaths), and alcohol-related liver disease accounts for 30.7% of alcohol-related deaths [Citation3]. In addition, the rate of liver transplantation for hepatocellular carcinoma caused by ALD have increased from 12.7% to 28.8% during 2010–2019 [Citation4]. However, in the early stage of ALD, due to nonspecific symptoms, patients without or with slight clinical manifestations will likely go undiagnosed. Hence, it is imperative to identify the ALD as early as possible from individuals with long-term drinking.
Recently, some researchers have elucidated that ethanol was capable of inducing inflammatory chemokines and cytokines via the production of reactive oxygen species (ROS) and acetaldehyde [Citation5–7]. In human hepatocytes, ethanol is oxidized by alcohol dehydrogenase to acetaldehyde, which is subsequently metabolized to acetate. Among ethanol metabolites, acetaldehyde is characterized by extremely high toxicity and carcinogenicity via combing with proteins, causing alterations in the structure and function of proteins, inducing the formation of new antigens, and propelling the host to produce immune response [Citation8]. Immune response, inflammatory cytokines, as well as intestinal barrier dysfunction caused by ethanol, result in systemic endotoxemia, which has been proved to be closely pertinent to the progression of liver disease [Citation9] and thus established the vicious circle of pro-inflammatory signaling. Currently, the main biomarkers of liver inflammation were aspartate transaminase/alanine transaminase, characterized by nonspecificity and easily influenced by various of pathologies [Citation10]. Thus, it is imperative to investigate the consistently expressed and stable biomarkers of ALD. With immune-related genes (IRGs) playing more and more crucial role in diseases, such as colon adenocarcinoma [Citation11–13], lung squamous cell carcinoma [Citation14], testicular germ cell tumor [Citation15], gastric cancer [Citation16], bladder urothelial carcinoma [Citation17], prostate cancer [Citation18], head and neck cancer [Citation19], Down syndrome [Citation20], preeclampsia [Citation21], intergenerational trauma [Citation22], etc. it is necessary to elucidate their impact on ALD or alcoholic hepatitis (AH). Meanwhile, at present, it has not yet been elucidated that the functions of IRGs in ALD.
Nowadays, AH has been gradually proved to occur in various stages of the ALD. We can reasonably speculate the chemokine signaling pathway serves a role in the AH. The purpose of this study was to discover core immune-related differential genes (IRDGs) and establish mice and hepatocellular models of early ALD, then we could reveal the roles of core IRDGs in ALD and contribute early molecular diagnosis and targeted therapy for patients.
2. Materials and methods
2.1 Data source
The raw data of GSE28619 (Gene Expression Omnibus Series 28619) dataset (CEL format) was downloaded from GEO (Gene Expression Omnibus) database (www.ncbi.nlm.nih.gov/geo), whose platform was GPL570 ([HG-U133_Plus_2] Affymetrix Human Genome U133 Plus 2.0 Array) samples contained 17 alcoholic hepatitis samples and five healthy samples. Then, we decompressed the original data and used robust multichip averaging (RMA) algorithm of the “affy” package to process these data [Citation23]. If multiple probes represent a same gene symbol, the median expression value will be calculated as their expression level [Citation24]. The annotation information of GPL570 platform was employed to convert the IDs of probes into official gene symbols [Citation25]. Besides, differentially expressed genes (DEGs) list of GSE143318 dataset were directly obtained from GEO database, including five alcoholic hepatitis patients and five healthy donors, with platform of GPL18573 (Illumina NextSeq 500). A total of 2498 immune-related genes (IRGs) also were downloaded from the immunology database and analysis portal (ImmPort) (https://www.immport.org/shared/home).
2.2 DEGs and immune-related differential genes (IRDGs)
For GSE28619 dataset, we applied the “limma” package to perform the differential expression analysis between the AH and healthy population samples. The Benjamini–Hochberg method was used to calculated the values of FDR, and t test was implemented for calculating the P-value. Then DEGs should meet the following criteria: the absolute value of log2FoldChange (|log2FC|) more than 1.0 and adjusted P-value less than 0.05. Then consistently expressed genes (CEGs) were identified in the overlapping section of Venn plot [Citation26]. After eliminating 687 duplicated IRGs, we selected the intersection of IRGs and CEGs gene lists as IRDGs.
2.3 Functional enrichment analysis
The Gene Ontology (GO) term and Encyclopedia of Kyoto Encyclopedia of Genes and Genomes (KEGG) pathways functional analyses of IRDGs were accomplished via the “clusterProfiler” package [Citation27]. Besides, the “GOplot” package was visualized the GO term functional enrichment analysis, including biological processes (BP), molecular function (MF), cellular component (CC) [Citation28], as well as KEGG pathway enrichment analysis. The P-value less than 0.05 was considered to be the threshold of significant enrichment.
2.4 Construction of protein–protein interaction (PPI) network and identification of core genes
We used 0.9 as minimum required interaction score in protein–protein interaction (PPI) network on the STRING website (https://string-db.org), which is a search tool for screening the interacting genes [Citation29]. The PPI network was visualized in Cytoscape (Version 3.6.1) software. Then CentiScaPe 2.2 and Molecular Complex Detection (MCODE) plug-ins were separately employed to calculate the centrality parameters of each node and identify highly connected clusters for screening out the most pivotal nodes. These nodes, comprising of MCODE clusters and belonging to DEGs, with degree more than threshold, were regarded as core genes.
2.5 Establishment of the mice model of early ALD
Twenty-four 6- to 8-week-old male mice were randomized into research and control group according to random number generated by STATA 14.0 software, among which no more than three mice a cage. Next, all mice were fed ordinary liquid feed for 3 days. Subsequently, research and control groups were fed with Lieber Decarli Ethanol (Trophic Animal Feed High-Tech Co. Ltd, China) and matched ordinary liquid feed ad libitum diet for 5 weeks, respectively. As previously described [Citation30], we made corresponding adjustments according to the results of pre-experiments. The concentration of ethanol added to the diet gradually increased by 28% from the initial concentration of 9% in the research (ethanol-fed) groups. And mice in control groups (pair-fed) were still fed with ordinary liquid feed until to 5 weeks. Then all mice were sacrificed, and their liver tissues were collected for further analysis. Besides, HE staining was used to explore the structure of mice liver lobules and hepatic cords, as well as the steatosis of hepatocytes. Oil red O staining was employed to investigate the formation of red lipid droplets in mouse hepatocytes, which was measured by IOD/area value. Each of four mouse hepatocytes group repeats the test three times, taking three pictures each time. Then we have detected each picture three times at 400× magnification to make an average value, calculating the IOD/area value. We followed the guidelines of the Hessian Animal Care and Use Committee. The regional authority has approved of the animal protocol, with number of 201809121.
2.6 Cell culture, Cell Counting Kit-8 (CCK-8) assay, and the hepatocellular model of early ALD
The human normal hepatocyte cell line, namely L02, was provided by Chongqing Medical University (Chongqing, China). Hepatocytes were cultured in the Dulbecco’s Modified Eagle’s medium (DMEM) with 5% fetal bovine serum and 100 U/mL penicillin and 100 U/mL streptomycin under the incubator of 37°C and 5% CO2 [Citation31]. Cell Counting Kit-8 (CCK-8, Beyotime, C0038, China) assay was applied to indirectly measure the number of living cells at different concentrations of ethanol, including 50 mM, 100 mM, 150 mM, 200 mM, 300 mM, 400 mM, and 600 mM. The cells were inoculated into a 96-well plate at a density of 10,000 cells/well. After incubation of 24 h in the incubator, fresh medium supplemented various concentrations of absolute ethanol replaced the supernatant for 24 h. Next, after ethanol treatment for 12 h, 24 h, 36 h, and 48 h, respectively, 10 μl CCK-8 solution was added to each well for 1–4 h. Then the optical density (OD) at 450 nm was measured using microplate reader. Each concentration and each group were repeated in five times. To validate cellular model of early ALD, the Oil red O staining was used to explore the formation of lipid droplets in hepatocytes. Besides, the detection of triglyceride contents of hepatocytes was performed using triglyceride assay kit (Nanjing Jiancheng, A110-1-1, China) by the GPO-PAP method.
2.7 Real-time PCR
Total RNA was extracted from cells using Trizol (Sangon Biotech, Shanghai, China). Then reverse transcription kit (Takara, Japan) was used to erase the genomic DNA and convert RNA into complementary DNA (cDNA) according to the manufacturer’s instructions. Subsequently, quantitative real-time PCR based on TB Green dye was performed by ABI7500 Applied Biosystems for amplifying the cDNA using cDNA transcription kit (Takara, Japan). GAPDH was selected as internal reference for relative quantitative analysis [Citation32]. The results were presented using 2−ΔΔCt, indicating the fold change of core genes in the early ALD model compared to normal hepatocytes [Citation33]. The sequences of primers are shown in . All the PCR quantification methods were implemented in triplicate.
Table 1. The sequence of primers for PCR
2.8 Immunohistochemistry (IHC) and Immunocytochemistry (ICC)
After dewaxing and washing, sections of mice liver underwent through antigen repair via microwave and were washed using PBS buffer. In addition, L02 cells (ethanol treatment vs. normal) were cultured on the sterile slide at a cell density of 5 × 10⁵ for 36 h in the incubator at 37°C and 5% CO2 circumstance. Next, slides were washed using PBS buffer and L02 cells on the slides were fixed via 4% paraformaldehyde for 30 min. Then, we used 3% H2O2 to quench the endogenous peroxidase for 20 min, cooled in water and sections and slides soaked in PBS buffer for 5 min. These sections and slides were incubated with primary antibodies, namely anti-rabbit CXCL1 antibody (diluted 1:100, Proteintech Group, 12335-1-AP, USA) and anti-rabbit CXCL6 antibody (dilute 1:100, Affinity, DF13470, China), for 1 h at 37°C. Then they were washed three times using PBS buffer, with each time five min. The horseradish peroxidase (HRP)-coupling goat-anti-rabbit second antibodies (dilute 1:200) were added in the sections and slides for co-incubation 50 min at 37°C. 3,3-Diaminobenzidine (DAB) was used to develop and optical microscope was employed to observe their staining. IHC was quantified by IOD value. The control group was consisted of three groups, and the experimental group was divided into five groups. Each group took three pictures and detected the picture three times at 400× magnification to make the average IOD value. Besides, the data analysis was implemented via Image-pro Plus software (Version 6.0).
2.9 Statistical analysis
All the data presented using mean ± SEM. The ethanol concentrations and stimulated time for establishing the early ALD model were determined based on two-way ANOVA analysis. The difference between two groups was performed using two-tailed Student t test. One-way ANOVA analysis was used to investigate the difference among more than three groups in a same test. P-value less than 0.05 denotes significantly statistical difference.
3. Results
Long-term ethanol will stimulate hepatocytes produce ROS, inflammatory cytokines, and chemokines, which establish the malignant pro-inflammatory cycle and propel the aggravation of liver inflammation and liver fibrosis. The object of this study was to discover core immune-related differential genes (IRDGs) based on the integrated bioinformatic analysis. Subsequently, mice and hepatocellular models of early ALD were established, and expression of Cxcl1 and Cxcl6 were observed in the experimental and control groups.
3.1 Identification of CEGs and IRDGs
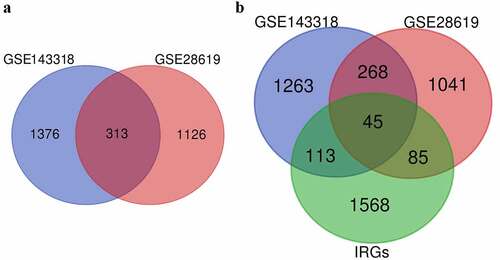
A total of 1439 DEGs (Table S1) and 1689 DEGs (Table S1) were separately obtained in the GSE28619 dataset and GSE143318 dataset. The volcano plot showed the DEGs in GSE28619 dataset (). The hierarchical clustering heatmap of 45 IRDGs in GSE28619 dataset were presented in (). The overlapping genes, serving as CEGs (Table S1), were identified via a Venn diagram (), with the number of 313. Subsequently, 45 IRDGs (Table S1) were screened out according to the intersection genes () in CEGs and IRGs gene lists.
Figure 1. (a) The volcano plot of DEGs in GSE28619 dataset and (b) the hierarchical clustering heatmap of IRDGs. DEGs: differentially expressed genes; IRDGs: immune-related differential genes.
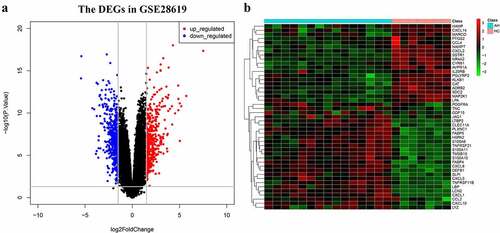
Figure 2. Identification of (a) CEGs and (b) IRDGs. CEGs: consistently expressed genes; IRDGs: immune-related differential genes.
3.2 Functional enrichment analyses
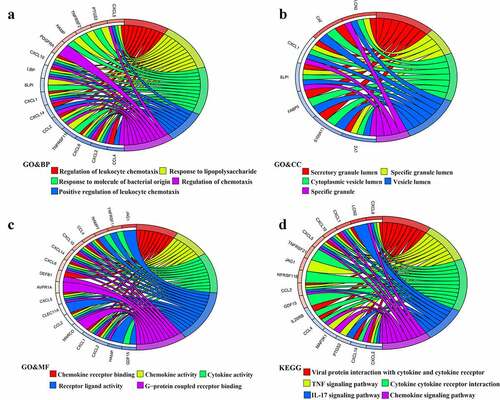
For further exploring the potential biological functions of 45 IRDGs, we performed GO term and KEGG pathway functional enrichment analyses. The results denoted that IRDGs were mainly enriched in following GO terms: regulation of leukocyte chemotaxis, response to lipopolysaccharide, positive regulation of leukocyte chemotaxis (BP category, ), secretory granule lumen, specific granule lumen (CC category, ), chemokine receptor binding, chemokine activity, cytokine activity, receptor ligand activity (MF category, ). KEGG pathway functional analysis revealed that cytokine−cytokine receptor interaction pathway and chemokine signaling pathway were the most crucial pathways ().
Figure 3. Functional enrichment analyses in 45 IRDGs. The GO enrichment analysis in (a) GO&BP; (b) GO&CC; (c) GO&MF; and (d) KEGG pathway enrichment analysis.IRDGs: immune-related differential genes; GO: gene ontology; BP: biological process; CC: cellular component; MF: molecular function; KEGG: Kyoto Encyclopedia of Genes and Genomes.
3.3 PPI network and core genes
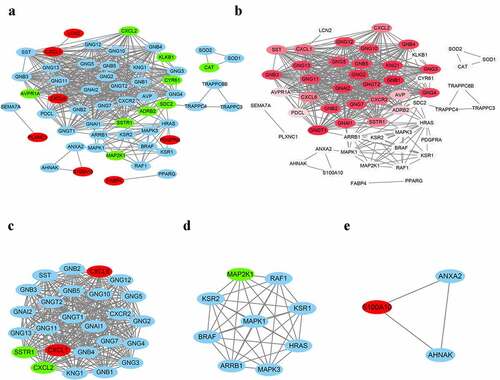
The PPI network was constructed via the Cytoscape software based on STRING database. The interactions of IRDGs are presented in , with nodes of 56 and edges of 443. Subsequently, the threshold (15.82) of degree of PPI network was calculated by the CentiScaPe 2.2 plug-in and the color of nodes gradually deepened with the increasing of degree (). The clusters, that is, the key sub-networks, of whole network were identified using the MCODE plug-in, where a total of three clusters were obtained (). Next, we screened out the DEGs with degree more than 15.82 as well as clustering in pivotal sub-networks, considered to be core genes. Ultimately, Cxcl1 and Cxcl6 were regarded as the core genes participating in the formation of the AH.
Figure 4. PPI network and key Clusters. (a) The PPI network with nodes of 56 and edges of 443. (b) The PPI network is visualized based on the value of degree calculated by the CentiScaPe 2.2 plug-in, the higher of the degree is, the darker of nodes’ color. (c) Cluster 1 with nodes, edges, and score of 25, 300 and 25; (d) Cluster 2 with nodes, edges, and score of 9, 36 and 9; (e) Cluster 3 with nodes, edges, and score of 3, 3 and 3. The red presents the upregulated DEGs, the green shows the downregulated DEGs, and blue indicates that these genes do not belong to DEGs. PPI: protein-protein interaction network; DEGs: differentially expressed genes.
3.4 Mice model of the early ALD
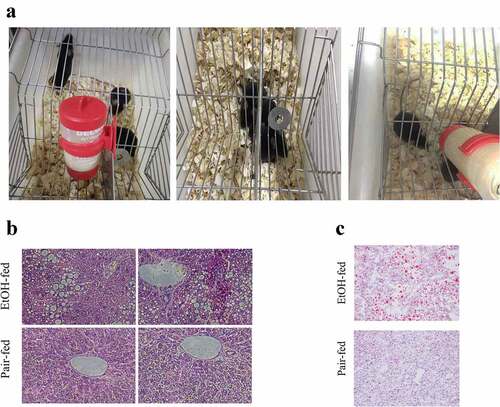
We completed the construction of an early ALD’s mice model via Lieber Decarli Ethanol feeding (). HE staining of mice liver tissues revealed that in the ethanol-fed groups, liver lobules structurally disordered, hepatic cords arranged disorderly, liver cells represented obvious steatosis, accompanied by the formation of transparent fatty vacuoles, as well as inflammatory cells infiltration also were observed in the hepatocytes’ space. While in the mice’s liver tissues from the pair-fed groups, we found that the central veins of the liver lobules were normal, the liver cords arranged neatly and hepatocytes did not undergo fatty degeneration (). Subsequently, Oil red O staining demonstrated that obvious red lipid droplets formed in the mice’s liver tissues induced by ethanol, whereas there was no significant steatosis formation in the pair-fed groups, namely, lipid droplets were not observed ().
Figure 5. Establishment of the mice model of early ALD. (a) Mice feeding; (b) HE staining of liver tissues of mice; (c) Oil red O staining for fresh liver tissues of mice. ALD: alcoholic liver disease.
3.5 Hepatocellular model of the early ALD
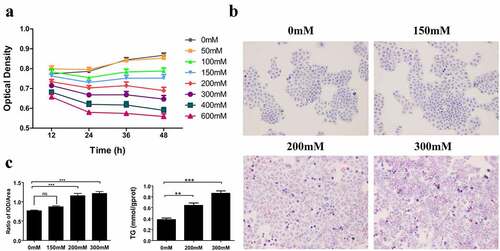
After accomplishing the CCK-8 assay, the ethanol concentrations of 150 mM, 200 mM, and 300 mM were treated L02 hepatocytes for 36 h, whose difference was statistically significant via two-way ANOVA analysis (). Next, we chose these three concentrations for establishing the hepatocellular model of early ALD. The Oil red O staining for cell slides demonstrated that 200 mM and 300 mM ethanol stimulated hepatocytes for 36 h, in the presence of obvious lipid droplets stained with red, compared with normal hepatocytes (, P < 0.05). Subsequently, intracellular triglyceride level was detected via biochemical assay, and the lipid was found to be significantly accumulated in L02 cells with the treatment of 200 mM and 300 mM ethanol (, p < 0.05).
Figure 6. Cell culture and construction of a hepatocellular model of early ALD. (a) CCK-8 assay presents the optimal concentration of ethanol and time of stimulus for L02 hepatocytes. (b) The oil red O staining shows the formation of lipid droplets in normal hepatocytes, 150 mM, 200 mM, and 300 mM ethanol-induced L02 cells, with red presenting the lipid droplets. (c) The IOD/Area from the Oil red O staining reveals the relative expression of lipid in hepatocytes and the triglyceride level detection via biochemical assay presents the absolute expression of lipid. ALD: alcoholic liver disease; IOD: integrated option density.
3.6 Alcohol promoting the expression of Cxcl1 and Cxcl6 in models
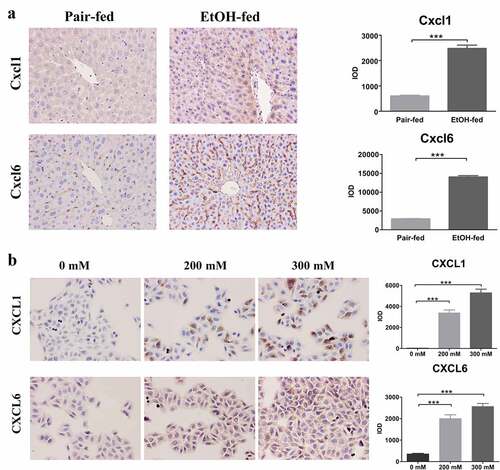
After 0 mM, 200 mM, and 300 mM ethanol stimulating the L02 cells for 36 h, the total RNA was extracted from L02 hepatocytes. The concentration and purity of RNA were examined on the apparatus of NanoDrop™ One/OneC Ultra Trace Ultraviolet Spectrophotometer (Thermo Scientific, USA), showing the ratio of OD260/280 fluctuating approximately 1.8–2.1. The mRNA of Cxcl1 and Cxcl6 were upregulated in ethanol-fed group, more than 2.48 and 1.34 times than pair-fed group, respectively (P < 0.001, ). Similarly, the results of quantitative PCR have demonstrated that Cxcl1 and Cxcl6 mRNA were obviously over-expressed in the L02 cells with 200 mM ethanol treatment than normal hepatocytes, with increasing by 208% and 172%, respectively (P < 0.05, ). While in the hepatocytes with 300 mM ethanol treatment for 36 h, the Cxcl1 and Cxcl6 mRNA level were 4.30 times and 3.63 times that of expression levels of normal L02 cells, respectively (P < 0.05, ). Via IHC staining, mice feeding with Lieber Decarli Ethanol presented higher positive particles of Cxcl1 and Cxcl6, which were separately expressed in cytoplasm and intercellular substance of hepatocytes or small vessels of liver tissues, with IOD values showing statistically significant difference (). In the cell slides with ICC staining, the CXCL1 and CXCL6 protein were located with the cytoplasm of hepatocytes and intercellular substance, respectively (). The alcohol-induced hepatocytes had a mass of positive granule, compared with the normal hepatocytes. According to the value of IOD calculated by Image-Pro Plus 6.0 software, CXCL1 and CXCL6 were significantly escalated inL02 cells with 200 mM and 300 mM ethanol treatment for 36 h (P < 0.05, ).
Figure 7. The mRNA expression of CXCL1 and CXCL6in mice and hepatocellular models. CXCL1: C-X-C Motif Chemokine Ligand 1; CXCL6:C-X-C Motif Chemokine Ligand 6.
Figure 8. The proteins levels of CXCL1 and CXCL6 in (a) mice and (b) hepatocellular models of early ALD. CXCL1:C-X-C Motif Chemokine Ligand 1; CXCL6:C-X-C Motif Chemokine Ligand 6; ALD: alcoholic liver disease.
4. Discussion
ALD is a class of hepatic diseases caused by long-term chronic drinking, including liver steatosis, alcoholic steatohepatitis, progressive liver fibrosis, cirrhosis, acute AH with or without cirrhosis, etc. [Citation1]. Given that the early symptoms of ALD is reclusive, it is high time to identify the early ALD patients from the population with drinking. The individuals with long-term ethanol stimulus will produce ROS, inflammatory cytokines, and chemokines, which establish the malignant pro-inflammatory cycle and propel the aggravation of liver inflammation and liver fibrosis. Based on the integrated bioinformatic analysis, we have determined Cxcl1 and Cxcl6 genes as core genes. To verify whether they were differentially expressed in early ALD, we constructed a mice model of early ALD via feeding with Lieber Decarli Ethanol and a hepatocellular model using ethanol. First, CCK-8 assay was used to decide the optimal concentration and treatment time of ethanol for L02 hepatocytes. Second, we found that 200 mM and 300 mM ethanol stimulated L02 cells for 36 h, which can promote the formation of steatosis in hepatocytes, which were considered to be a hepatocellular model of early ALD. Of note, the present study demonstrated that Cxcl1 and Cxcl6 were over-expressed in the mice and hepatocellular models of early ALD, which was worthy of further analysis.
Indeed, the chemokine signaling pathway serves a role in the AH. Chemokines are a class of highly conserved small molecule secreted proteins, which are divided into four categories: CC, CXC, C, and CX3C based on the different positions of the two cysteine residues at the N-terminal of the conservation [Citation34]. Dominguez et al. indicated that the expressions of C-X-C subfamily members IL-8, Gro-alpha, Cxcl5, Cxcl6, Cxcl10, and platelet factor 4 were over-expressed in liver tissue samples from AH patients, compared with healthy control groups, and higher expression levels of IL-8, Cxcl5, Gro-gamma and Cxcl6 were significantly associated with poor prognosis [Citation33]. Besides, Roh et al. revealed that hepatocytes and hepatic stellate cells produced a large amount of Cxcl1 in the ethanol-fed mice. Then Cxcl1, interacting with Cxcr2, facilitated the neutrophil infiltration into liver in the ethanol-stimulated mice, causing the progression of alcohol-mediated hepatic damage [Citation35]. We have identified the core IRDGs, that is, Cxcl1 and Cxcl6, in the AH via integrated bioinformatics analysis.
C-X-C Motif Chemokine Ligand 1 and C-X-C Motif Chemokine Ligand 6 belong to the family of chemokine ligands, both locating in chromosome 4q13.3 and functioning as a chemotactic role for neutrophils. The AH is characterized by neutrophil infiltration in hepatocytes, which was determined by selectively upregulating the C-X-C chemokine synthesis [Citation36]. Liu et al. discovered Endothelial cells upregulate Cxcl1 and other chemokines in response to TNFα given exogenously or secreted by Kupffer cells, resulting in immune cell infiltration by releasing soluble factors, such as chemokines [Citation37]. Meanwhile, some researches revealed that AH was related to the translocation of pathogen-associated molecular patterns (PAMPs), the elevation of lipocalin-2 (Lcn2) and Cxcl1, where it has been confirmed that PAMPs directly induced the upregulation of Lcn2 and Cxcl1 [Citation38]. Also, Chen et al. used α-Galcer to induce the formation of mouse’s hepatitis, and found that the absence of Cxcl5 enhanced the expression of Cxcl1 and activated the Cxcl1-Cxcr2 axis in neutrophils, leading to the infiltration of neutrophils in mice liver and causing the damage to liver [Citation39]. Additionally, Wieser et al. indicated that ALD was driven by Cxcr1/2-dependent activation of neutrophils and inhibition of CXCR1/2 G protein-coupled receptor or were capable of reducing Cxcl1 levels, neutrophil infiltration and triglyceride accumulation in liver [Citation40]. Furthermore, a previous study demonstrated the over-expressed Cxcl6 promoted hepatocytes proliferation via the CXCR1-NFκB signal pathway and inhibited the secretion of collagen I during the progression of chronic viral hepatitis B [Citation32]. Also, the dysregulated Cxcl6 was closely pertinent to the activation of lymphocytes infiltrating the liver in the first stage of hepatic fibrosis caused by hepatitis C [Citation41]. Besides, CXC chemokines, such as Cxcl6 and Cxcl3, were significantly highly expressed in the ulcerative colitis (UC) patients, which promoted the severe infiltration of neutrophils and participated in the formation of UC [Citation42]. Under the circumstance of hypoxia, the Cxcl2, Cxcl3, Cxcl5, Cxcl6, and Cxcl8 genes, which encode chemotactic proteins of neutrophils, appeared to be upregulated, with the ability of reprogramming mature dendritic cells (mDC) into the pro-inflammatory DCs, thereby affecting its capability to regulate the transport and activation of leukocytes in the pathological sites and exert impact on the pathogenesis of chronic inflammatory diseases [Citation43]. And previous a study has demonstrated that the neutrophils became the main inflammatory agents via production of pro-inflammatory mediators and release of ROS and a wide range of cytokines [Citation44]. Intriguingly, a recent study has demonstrated that the defects of IL33/ST2 pathways in neutrophils of severe alcoholic hepatitis (SAH) resulted in the lower migration of neutrophils [Citation45]. The specific mechanism involving in Cxcl1 and Cxcl6 in relation to neutrophils will be explored in the next step.
Last but not the least, the limitations also need to be attached more importance. Considering the difficulty in clinical diagnosis for early ALD and nonspecific symptoms of early-stage patients, the collection of clinical samples were impeded. Thus, the role of the two core IRDGs in the diagnosis and treatment of early ALD still needs to be confirmed in further experiments.
5. Conclusions
In present study, integrated bioinformatics analysis based on GSE28619 and GSE143318 datasets revealed that Cxcl1 and Cxcl6 genes, encoding neutrophil chemotactic proteins, considered to be core IRDGs of the ALD, which were significantly escalated in the mice and hepatocellular models of early ALD. The mechanism of ALD progression can attribute to Cxcl1 and Cxcl6 genes facilitating immune cells infiltration and aggravating the inflammatory damage to liver. Therefore, Cxcl1 and Cxcl6 genes can act as potential biomarkers of early ALD. However, the specific functions of Cxcl1 and Cxcl6 will deserve to be further investigated in the subsequent work.
Author’s contributions
Yao Jiang and Yuge Xi designed the study, performed data acquisition and drafted the manuscript. Yao Jiang and Zhihua Zuo cultured the L02 cells. Zhihua Zuo and Chuyi Zeng explored the experimental condition of qRT-PCR test. Yao Jiang and Yuge Xi performed CCK-8 assay, Yao Jiang and Yiqin Li constructed the mice model of early ALD and accomplished qRT-PCR tests. Yiqin Li, Chuyi Zeng,Jia Fan and Dan Zhang performed IHC and ICC staining tests. Yao Jiang, Yuge Xi and Yiqin Li used the microscope to analyze the results. Yongcan Guo and Hualin Tao interpreted the data, carefully revised the manuscript and provided the funding support and edited the manuscript. All authors read and approved the final manuscript.
Ethical approval (research involving human participants and/or animals)
The present study was approved by the Ethics Committee of the Affiliated Hospital of Southwest Medical University, with number of 201,809,121.
Informed consent
Formal consent is not required in the present study.
Disclosure statement
No potential conflict of interest was reported by the author(s).
Additional information
Funding
References
- Grissa D, Nytoft Rasmussen D, Krag A, et al. Alcoholic liver disease: a registry view on comorbidities and disease prediction. PLoS Comput Biol. 2020;16(9):e1008244. Epub 2020/ 09/23 PubMed PMID: 32960884; PubMed Central PMCID: PMCPMC7531835.
- Ricci C, Schutte AE, Schutte R, et al. Trends in alcohol consumption in relation to cause-specific and all-cause mortality in the United States: a report from the NHANES linked to the US mortality registry. Am J Clin Nutr. 2020;111(3):580–589. Epub 2020/ 01/25. PubMed PMID: 31978218.
- White AM, Castle IP, Hingson RW, et al. Using Death Certificates to Explore Changes in Alcohol-Related Mortality in the United States, 1999 to 2017. Alcohol Clin Exp Res. 2020;44(1):178–187. Epub 2020/ 01/09. PubMed PMID: 31912524.
- Wang S, Toy M, Hang Pham TT, et al. Causes and trends in liver disease and hepatocellular carcinoma among men and women who received liver transplants in the U.S., 2010-2019. PLoS One. 2020;15(9):e0239393. Epub 2020/ 09/19. PubMed PMID: 32946502; PubMed Central PMCID: PMCPMC7500679.
- Kubes P, Mehal WZ. Sterile inflammation in the liver. Gastroenterology. 2012;143(5):1158–1172. Epub 2012/ 09/18. PubMed PMID: 22982943.
- Kwon HJ, Won YS, Park O, et al. Aldehyde dehydrogenase 2 deficiency ameliorates alcoholic fatty liver but worsens liver inflammation and fibrosis in mice. Hepatology. 2014;60(1):146–157. Epub 2014/ 02/05. PubMed PMID: 24492981; PubMed Central PMCID: PMCPMC4077916.
- Setshedi M, Wands JR, Monte SM. Acetaldehyde adducts in alcoholic liver disease. Oxid Med Cell Longev. 2010;3(3):178–185. Epub 2010/ 08/19. PubMed PMID: 20716942; PubMed Central PMCID: PMCPMC2952076.
- Seitz HK, Stickel F. Molecular mechanisms of alcohol-mediated carcinogenesis. Nat Rev Cancer. 2007;7(8):599–612. Epub 2007/ 07/25. PubMed PMID: 17646865.
- Wang HJ, Gao B, Zakhari S, et al. Inflammation in alcoholic liver disease. Annu Rev Nutr. 2012;32(1):343–368. Epub 2012/ 04/25. PubMed PMID: 22524187; PubMed Central PMCID: PMCPMC3670145.
- Gala KS, Vatsalya V. Emerging Noninvasive Biomarkers, and Medical Management Strategies for Alcoholic Hepatitis: present Understanding and Scope. Cells. 2020;9(3). Epub 2020/ 02/29. PubMed PMID: 32106390; PubMed Central PMCID: PMCPMC7140524.
- Qiang W, Dai Y, Sun G, et al. Development of a prognostic index of colon adenocarcinoma based on immunogenomic landscape analysis. Ann Transl Med. 2020;8(6):284. Epub 2020/ 05/02. PubMed PMID: 32355728; PubMed Central PMCID: PMCPMC7186653.
- Guo JN, Li MQ, Deng SH, et al. Prognostic Immune-Related Analysis Based on Differentially Expressed Genes in Left- and Right-Sided Colon Adenocarcinoma. Front Oncol. 2021;11:640196. Epub 2021/ 03/26. PubMed PMID: 33763372; PubMed Central PMCID: PMCPMC7982460.
- Sun YL, Zhang Y, Guo YC, et al. A Prognostic Model Based on the Immune-related Genes in Colon Adenocarcinoma. Int J Med Sci. 2020;17(13):1879–1896. Epub 2020/ 08/14. PubMed PMID: 32788867; PubMed Central PMCID: PMCPMC7415395.
- Li R, Liu X, Zhou XJ, et al. Identification of a Prognostic Model Based on Immune-Related Genes of Lung Squamous Cell Carcinoma. Front Oncol. 2020;10:1588. Epub 2020/ 10/06. PubMed PMID: 33014809; PubMed Central PMCID: PMCPMC7493716.
- Ji C, Wang Y, Wang Y, et al. Immune-related genes play an important role in the prognosis of patients with testicular germ cell tumor. Ann Transl Med. 2020;8(14):866. Epub 2020/ 08/15. PubMed PMID: 32793710; PubMed Central PMCID: PMCPMC7396763.
- Zhang S, Zeng Z, Liu Y, et al. Prognostic landscape of tumor-infiltrating immune cells and immune-related genes in the tumor microenvironment of gastric cancer. Aging (Albany NY). 2020;12(18):17958–17975. Epub 2020/ 09/25. PubMed PMID: 32969836; PubMed Central PMCID: PMCPMC7585095.
- Xing Q, Liu S, Jiang S, et al. Prognostic model of 10 immune-related genes and identification of small molecule drugs in bladder urothelial carcinoma (BLCA). Transl Androl Urol. 2020;9(5):2054–2070. Epub 2020/ 11/20. PubMed PMID: 33209669; PubMed Central PMCID: PMCPMC7658175.
- Huang H, Tang Y, Li P, et al. Significance of TP53 and immune-related genes to prostate cancer. Transl Androl Urol. 2021;10(4):1754–1768. Epub 2021/ 05/11. PubMed PMID: 33968663; PubMed Central PMCID: PMCPMC8100849.
- Jiang AM, Ren MD, Liu N, et al. Tumor Mutation Burden, Immune Cell Infiltration, and Construction of Immune-Related Genes Prognostic Model in Head and Neck Cancer. Int J Med Sci. 2021;18(1):226–238. Epub 2021/ 01/05. PubMed PMID: 33390791; PubMed Central PMCID: PMCPMC7738958.
- Zampieri BL, Biselli-Périco JM, de Souza JE, et al. Altered expression of immune-related genes in children with Down syndrome. PLoS One. 2014;9(9):e107218. Epub 2014/ 09/16. PubMed PMID: 25222269; PubMed Central PMCID: PMCPMC4164533.
- Wang Y, Li Z, Song G, et al. Potential of Immune-Related Genes as Biomarkers for Diagnosis and Subtype Classification of Preeclampsia. Front Genet. 2020;11:579709. Epub 2020/ 12/19. PubMed PMID: 33335538; PubMed Central PMCID: PMCPMC7737719.
- Daskalakis NP, Xu C, Bader HN, et al. Intergenerational trauma is associated with expression alterations in glucocorticoid- and immune-related genes. Neuropsychopharmacology. 2021;46(4):763–773. Epub 2020/ 11/12. PubMed PMID: 33173192; PubMed Central PMCID: PMCPMC8027026.
- Gautier L, Cope L, Bolstad BM, et al. affy–analysis of Affymetrix GeneChip data at the probe level. Bioinformatics. 2004;20(3):307–315. Epub 2004/ 02/13. PubMed PMID: 14960456.
- Zeng C, Xing W, Liu Y. Identification of UGP2 as a progression marker that promotes cell growth and motility in human glioma. J Cell Biochem. 2019;120(8):12489–12499. Epub 2019/ 03/01. PubMed PMID: 30816613.
- Gao X, Wang X, Zhang S. Bioinformatics identification of crucial genes and pathways associated with hepatocellular carcinoma. Biosci Rep. 2018;38(6). Epub 2018/ 10/21. PubMed PMID: 30341252; PubMed Central PMCID: PMCPMC6239270.
- Cao MD, Song YC, Yang ZM, et al. Identification of Osteosarcoma Metastasis-Associated Gene Biomarkers and Potentially Targeted Drugs Based on Bioinformatic and Experimental Analysis. Onco Targets Ther. 2020;13:8095–8107. Epub 20200814. PubMed PMID: 32884293; PubMed Central PMCID: PMCPMC7434575.
- Yu G, Wang LG, Han Y, et al. clusterProfiler: an R package for comparing biological themes among gene clusters. Omics. 2012;16(5):284–287. Epub 2012/ 03/30. PubMed PMID: 22455463; PubMed Central PMCID: PMCPMC3339379.
- Walter W, Sanchez-Cabo F, Ricote M. GOplot: an R package for visually combining expression data with functional analysis. Bioinformatics. 2015;31(17):2912–2914. Epub 2015/ 05/13. PubMed PMID: 25964631.
- Jeanquartier F, Jean-Quartier C, Holzinger A. Integrated web visualizations for protein-protein interaction databases. BMC Bioinformatics. 2015;16:195. Epub 2015/ 06/17. PubMed PMID: 26077899; PubMed Central PMCID: PMCPMC4466863.
- Liangpunsakul SR,RA, Crabb DW. Activation of carbohydrate response element binding protein (ChREBP) by ethanol. J Investig Med. 2013;61(2):270–277.
- Zheng L, Lv GC, Sheng J, et al. Effect of miRNA-10b in regulating cellular steatosis level by targeting PPAR-alpha expression, a novel mechanism for the pathogenesis of NAFLD. J Gastroenterol Hepatol. 2010;25(1):156–163. Epub 2009/ 09/29. PubMed PMID: 19780876.
- Li ZZ,Q, Zhang Q, Xu M, et al. CXCL6 promotes human hepatocyte proliferation through the CXCR1–NFκB pathway and inhibits collagen I secretion by hepatic stellate cells. Biochem Cell Biol. 2016;94(3):229–235.
- Dominguez M, Miquel R, Colmenero J, et al. Hepatic expression of CXC chemokines predicts portal hypertension and survival in patients with alcoholic hepatitis. Gastroenterology. 2009;136(5):1639–1650. Epub 2009/ 02/12. PubMed PMID: 19208360.
- Nagarsheth N, Wicha MS, Zou W. Chemokines in the cancer microenvironment and their relevance in cancer immunotherapy. Nat Rev Immunol. 2017;17(9):559–572. Epub 2017/ 05/31. PubMed PMID: 28555670; PubMed Central PMCID: PMCPMC5731833.
- Roh YS, Zhang B, Loomba R, et al. TLR2 and TLR9 contribute to alcohol-mediated liver injury through induction of CXCL1 and neutrophil infiltration. Am J Physiol Gastrointest Liver Physiol. 2015;309(1):G30–41. Epub 2015/ 05/02. PubMed PMID: 25930080; PubMed Central PMCID: PMCPMC4491507.
- Maltby JW,S, Bird G, Sheron N. Chemokine levels in human liver homogenates Associations between GRO alpha and histopathological evidence of alcoholic hepatitis. Hepatology. 1996;24(5):1156–1160.
- Liu M, Cao S, He L, et al. Super enhancer regulation of cytokine-induced chemokine production in alcoholic hepatitis. Nat Commun. 2021;12(1):4560. Epub 20210727. PubMed PMID: 34315876; PubMed Central PMCID: PMCPMC8316465.
- Zhong W, Wei X, Hao L, et al. Paneth Cell Dysfunction Mediates Alcohol-related Steatohepatitis Through Promoting Bacterial Translocation in Mice: role of Zinc Deficiency. Hepatology. 2020;71(5):1575–1591. Epub 2019/ 09/15. PubMed PMID: 31520476; PubMed Central PMCID: PMCPMC7069794.
- Chen L, Gu J, Qian Y, et al. Deletion of C-C Motif Chemokine Ligand 5 Worsens Invariant Natural Killer T-Cell-Mediated Hepatitis via Compensatory Up-regulation of CXCR2-Related Chemokine Activity. Cell Mol Gastroenterol Hepatol. 2019;7(3):623–639. Epub 2019/ 01/11. PubMed PMID: 30630119; PubMed Central PMCID: PMCPMC6434496.
- Wieser V, Adolph TE, Enrich B, et al. Reversal of murine alcoholic steatohepatitis by pepducin-based functional blockade of interleukin-8 receptors. Gut. 2017;66(5):930–938. Epub 2016/ 02/10. PubMed PMID: 26858343; PubMed Central PMCID: PMCPMC5531226.
- Bieche I, Asselah T, Laurendeau I, et al. Molecular profiling of early stage liver fibrosis in patients with chronic hepatitis C virus infection. Virology. 2005;332(1):130–144. Epub 2005/ 01/22. PubMed PMID: 15661146.
- Boshagh MA, Foroutan P, Moloudi MR, et al. ELR positive CXCL chemokines are highly expressed in an animal model of ulcerative colitis. J Inflamm Res. 2019;12:167–174. Epub 2019/ 08/17. PubMed PMID: 31417300; PubMed Central PMCID: PMCPMC6599894.
- Blengio F, Raggi F, Pierobon D, et al. The hypoxic environment reprograms the cytokine/chemokine expression profile of human mature dendritic cells. Immunobiology. 2013;218(1):76–89. Epub 2012/ 04/03. PubMed PMID: 22465745.
- Das S, Maras JS, Hussain MS, et al. Hyperoxidized albumin modulates neutrophils to induce oxidative stress and inflammation in severe alcoholic hepatitis. Hepatology. 2017;65(2):631–646. Epub 2016/ 10/25. PubMed PMID: 27775820.
- Artru F, Bou Saleh M, Maggiotto F, et al. IL-33/ST2 pathway regulates neutrophil migration and predicts outcome in patients with severe alcoholic hepatitis. J Hepatol. 2020;72(6):1052–1061. Epub 2020/ 01/19. PubMed PMID: 31953139.