
ABSTRACT
Programmed death ligand 1 (PD-L1) plays an essential role in the development or progression of hepatocellular carcinoma (HCC). MicroRNAs (miRNAs) are small RNA molecules that regulate gene expression during normal and pathophysiological events. Here, we explored the functions and detailed mechanisms of miR-378a-3p and PD-L1 in HCC progression. First, miR-378a-3p was selected by analyzing miRNA levels in two HCC Gene Expression Omnibus datasets. We found that miR-378a-3p levels exhibited a downward trend in HCC and were negatively correlated with PD-L1 levels. Additionally, a dual luciferase assay predicted that miR-378a-3p directly targets PD-L1. Moreover, the transfection of miR-378a-3p mimics into Li-7 and HuH-7 cells effectively decreased the PD-L1 mRNA and protein expression levels, and inhibited Treg differentiation in co-culture models by modulating the expression levels of certain cytokines. Furthermore, the overexpression of miR-378a-3p hindered cell proliferation and migration but facilitated apoptosis by repressing STAT3 signaling in HCC cells. In conclusion, miR-378a-3p appears to inhibit HCC tumorigenesis by regulating PD-L1 and STAT3 levels. Thus, miR-378a-3p may be a potential target for HCC therapy.
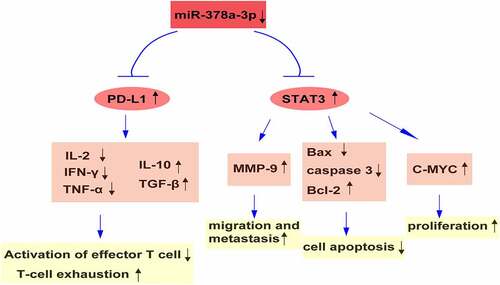
Graphical abstract
1. Introduction
Hepatocellular carcinoma (HCC) is a malignancy exhibiting a high death rate and a year-to-year upward incidence trend globally [Citation1]. Its primary risk factors include co-infection with hepatitis B and C viruses, cirrhosis triggered by excessive alcohol consumption, and nonalcoholic hepatopathy [Citation2–4]. Marked progress in surgical techniques has prolonged survival, but the death and incidence rates of HCC remain equally high due to deficiencies in diagnosis and effective treatment schemes at the early stage. Moreover, surgically resected HCC is prone to relapse [Citation5–7]. Accordingly, the pathogenic mechanism of HCC needs to be understood at the molecular level. This will enable the identification of diagnostic biomarkers and suitable therapeutic targets for the early stage of the disease and facilitate progress in the development of effective treatment schemes.
MicroRNAs (miRNAs) are endogenous non-coding RNAs. They are 22–25 nucleotides [Citation8] and possess the ability to target sequences in the 3’-untranslated region (3’-UTR) of protein-coding genes. This allows them to control gene expression through cleavage and by repressing translation and triggering gross variations in protein content [Citation9,Citation10]. In addition, miRNAs play indispensable regulatory roles in a myriad of cellular processes, such as cell cycle, proliferation, and apoptosis, as well as the growth, progression, and survival of regulatory T cells [Citation11–13]. Furthermore, miRNA expression anomalies have been found in many human cancers [Citation14–16], including HCC [Citation17]. In particular, the expression of miR-378a-3p, a tumor-suppressing miRNA, displays anomalies in cervical cancer [Citation18], prostate cancer [Citation19], and breast cancer [Citation20]. Moreover, Qian et al. reported that miR-378a-3p is a presumptive biological hallmark for HCC diagnosis and prognosis, based on a rational computer-assisted model of biomarker discovery [Citation21]. Nonetheless, the mechanism whereby miR-378a-3p influences HCC remains unclear.
Here, our aims were to investigate whether miR-378a-3p plays an important role in modulating HCC progression and, if affirmative, to reveal the underlying molecular mechanisms. We explored the roles and possible mechanism of miR-378a-3p/programmed death ligand 1 (PD-L1) in the progression of HCC to provide new insights for the clinical diagnosis and treatment of HCC.
2. Materials and methods
2.1. Tissue sampling
Forty-eight patients with HCC who were not undergoing chemoradiotherapy and were admitted to the Southern Medical University from 2017 to 2019 were selected for the study, and their fresh HCC and non-cancer tissues were collected and frozen. The tissue samples were stored in liquid nitrogen prior to RNA extraction, and experienced pathologists recorded their clinicopathological features. All patients provided written informed consent and the study was approved by the Ethics Committee of the Second School of Clinical Medicine, Southern Medical University. No identifying information has been included in the manuscript.
2.2. Cell culture
The cell lines HuH-7 and Li-7 were provided by the American Type Culture Collection (Manassas, VA, USA) and the Cell Bank of the Chinese Academy of Science (Shanghai, China), respectively. Both cell lines were authenticated using short tandem repeat profiling. We used high-glucose (25 mM) Dulbecco’s modified Eagle’s medium (Gibco, Shanghai, China) with 1% penicillin-streptomycin and 10% fetal bovine serum (Sigma, St. Louis, MO, USA) to culture HCC cells, which were stored in a humid incubator (5% CO2).
2.3. miRNA transfection
GenePharma (Shanghai, China) provided miR-378a-3p mimics at different concentrations (10, 20, and 40 pmol) and an miRNA negative control (miR-NC) conjugated with FITC. Detailed sequences are displayed in . Transfection into Li-7 and HuH-7 cells (1 × 10⁶ cells/mL) was conducted using a Gene Pulser electroporation system (Bio-Rad, Hercules, CA, USA) with 0.2 cm-gap cuvettes at 160 V and a constant time of 12.5 ms. The transfection results were assessed by reverse transcription-quantitative polymerase chain reaction (RT-qPCR).
Table 1. Sequences of primers for qRT-PCR and transfection
2.4. RT-qPCR
RT-qPCR was performed to measure gene expression levels The TRIzol reagent (GeneAll, Seoul, Republic of Korea) was used for total RNA isolation as specified by the manufacturer’s instructions. The concentration and purity of the obtained RNA were measured using a NanoDrop spectrophotometer (Thermo Fisher Scientific, Shanghai, China) based on the A260 and A280 values, followed by electrophoresis on 1% agarose gels to assess their integrity.
Complementary DNA (cDNA) was obtained via reverse transcription of total RNA (1 mg) using the ReverTra Ace® qPCR RT kit (cat. no. FSQ‑101; Toyobo Life Science) as specified by the manufacturer’s instructions. Stem-loop primers were used for the synthesis of cDNA from miRNA. Thereafter, the BioFACT 2X Real-Time PCR Master Mix was employed to quantitate target gene expression levels in a StepOnePlus Real-Time PCR System (Thermo Fisher Scientific). The reaction procedure was as follows: 95°C for 3 min, followed by 40 cycles of 95°C for 12s and 60°C for 40s. Gene expression was calculated by the 2−ΔΔCq method [Citation22]. U6 and GAPDH were used as internal controls, and miR-378a-3p expression levels were normalized to U6 levels, while target gene levels were normalized to GAPDH levels. Genepharma (Shanghai, China) provided all primers, whose detailed sequences are displayed in .
2.5. Dual luciferase experiment
We performed a luciferase reporter assay to probe into the direct miR-378a-3p-PD-L1 mRNA interplay. In detail, amplification of the PD-L1 3’-UTR from HuH-7 cell cDNA was performed using specific primer sequences (1,243 nucleotides) from the 3’-UTR fragments. The 5’ and 3’ ends of the primers were added with appropriate restriction sites to allow cloning into the psi-CHECK-2 vector (Promega, Madison, WI, USA). Subsequently, HEK293T cells were co-transfected with 200 ng of PD-L1 cloning vectors and 40 pmol of miR-378a-3p mimics, or with the cloning vectors and a scrambled miRNA (negative control) using the Gene Pulser electroporation system as specified by the manufacturer’s guidelines. After 48 h of culturing, we adopted the Dual-Glo Luciferase Assay System (Promega) to lyse cells for the determination of luciferase activity using a Cytation 5 cell imaging reader (Biotek, Winooski, VY, USA). Firefly luciferase activity (internal control for transfection) was utilized for data normalization.
2.6. Western blotting (WB)
As specified by the manufacturer’s protocol, we sequestered cellular proteins using radioimmunoprecipitation assay lysis buffer (Santa Cruz Biotechnology, Dallas, TX, USA) to examine their expression levels. A total of 25 μg of protein per lane was sequestered using sodium dodecyl sulfate-polyacrylamide gel electrophoresis (12%). Subsequently, we adopted the semi-dry blotting method to transfer the proteins onto polyvinylidene fluoride membranes (Roche Diagnostics GmbH, Basel, Switzerland). Then, the membranes were blocked with skim milk powder under shaking for 1 h at room temperature., The membranes were incubated with primary antibodies targeting MMP9 (1/1000, ab76003; Abcam, Shanghai, China), c-MYC (1/1000, ab32072, Abcam), BAX (1/1000, ab32503, Abcam), BCL-2 (1/1000, ab32124, Abcam), cleaved caspase 3 (1/100, ab2302, Abcam), pro-caspase 3 (1/1000, ab32150, Abcam), beta-actin (1/2000, ab8227, Abcam), STAT3 (1/1000, ab68153, Abcam), phospho-STAT3 (pSTAT3, 1/1000, ab76315, Abcam), and PD-L1 (1:2000, sc-293425, Santa Cruz Biotechnology), at 4°C overnight. After rinsing, the membranes were incubated with a moderate amount of secondary antibody (A0208 or A0216; Beyotime, Nantong, China) at room temperature conjugated with horseradish peroxidase. We utilized an electrochemiluminescence system (Roche) for band visualization and a WB imaging system (Sabz Biomedicals, Tehran, Iran) for image capture. Lastly, we used the ImageJ software (National Institutes of Health, Bethesda, MD, USA) for the semi-quantitative assessment of STAT3, pSTAT3, PD-L1, and β-actin (control) protein levels.
2.7. 5-ethynyl-2 deoxyuridine (EdU) assay
As specified by the manufacturer’s protocol, Click-iT® EdU Imaging Kits (Invitrogen, Carlsbad, CA, USA) were employed to assess the role of miR-378a-3p in HCC cell proliferation. Cells (8 × 10³ cells/well) were cultured in 96-well plates and incubated with 10 μL of EdU reagent for 3 h. Subsequently, cells were fixed with 4% formaldehyde for 20 min at room temperature, followed by rinsing with phosphate-buffered saline (PBS). The cells were then incubated in 0.5% Triton X-100 (Sigma, Shanghai, China) at room temperature. Nucleus staining was performed using 1 mL of 4’,6-diamidino-2-phenylindole solution (Sigma); the solution was added to each well and the cells were incubated for 25 min in the dark at room temperature. Then, the staining solution was removed by washing with PBS three times. Finally, pictures of the stained cells were taken, and the cells were quantified under a fluorescence microscope (CKX41-F32FL; Olympus, Beijing, China).
2.8. Apoptosis detection
We carried out an annexin V/propidium iodide (PI) assay to evaluate the effect of miR-378a-3p mimic transfection on apoptosis. To this end, cells (2.5 × 10⁶) undergoing miR-378a-3p mimic transfection were inoculated into six-well plates for 48 h. Subsequently, cells were collected, rinsed with PBS, and stained using an annexin V/PI kit (BD Biosciences, San Jose, CA, USA) as per the manufacturer’s instructions. A MACSQuant10 flow cytometer (Miltenyi Biotec, Bergisch Gladbach, Germany) was used to detect apoptotic cells, and data analysis was conducted using the FlowJo 7.6 software (TreeStar, Ashland, OR, USA).
2.9. Wound-healing assay
The impact of miR-378a-3p inhibition on HCC cell migration was examined using a wound-healing assay. First, the cells were transfected with miR-378a-3p mimics prior to inoculation into 24-well plates (3 × 10⁵ cells/well) and incubated for 24 h. After incubation, a sterile pipette tip was used to scratch the cell monolayer, followed by medium replacement. Images of the cells migrating into the gap area were captured at 0 and 24 h after scratching using an inverted XDS-3 microscope (Optika, Bergamo, Italy). Four fields of view (100x) were selected stochastically, and the cell–cell distance at the invading fronts was measured.
2.10. Invasion assays
An invasion assay was used to corroborate the utility of miR-378a-3p as a marker of metastatic HCC cell phenotypes. Initially, 8 μm transwells (24-well) were coated with 200 mg/mL Matrigel. HuH-7 or Li-7 cells (0.1 × 10⁶ cells in 100 mL of serum-free medium) transfected with miR-378a-3p mimics were added to the upper Matrigel chamber. The lower chamber was filled with RPMI-1640 containing 20% FBS. After 48 h of cell culture, the cells infiltrating the pores were visualized by Giemsa staining, and an inverted microscope was used for cell quantification in five randomly selected fields of view.
2.11. Co-culture of HCC and T cells
The peripheral blood mononuclear cells were isolated from the whole blood of healthy donors containing heparin anticoagulant through Ficoll-Hypaque (Lymphodex; Inno-train, Kronberg, Germany) density gradient separation. Subsequently, the cells were centrifuged at 400 × g for 30 min, and T cells were isolated by negative immune depletion of CD14+, CD15+, CD16+, CD19+, CD34+, CD36+, CD38+, CD56+, CD123+, and CD235a+ (glycophorin A) cells using a magnetic-activated cell sorting kit (Miltenyi Biotec). Next, cells were separated using 5 μg/mL phytohemagglutinin and then stimulated for 24 h prior to joint culture with miRNA-transfected Li-7 and HuH-7 cells. Following 48 h of co-culture at a 1:1 ratio, the suspended T cells were labeled with anti-human CD25 antibodies (302609; BioLegend, San Diego, CA, USA) conjugated with APC following the manufacturer’s instructions. After fixation, permeabilization, and staining with Brilliant Violet 421™-conjugated anti-human FOXP3 (320123; Biolegend), we examined the purity of FOXP3/CD25 Tregs and performed RT-PCR to determine the expression profiles of cytokines, such as TGF-β, IL-10, IFN-γ, TNF-α, and IL-2.
2.12. Statistical analysis
Data were analyzed using SPSS 20.0 (Chicago, Illinois, USA) or GraphPad Prism 6.0 (GraphPad, San Diego, CA, USA). All values were displayed as mean ± standard deviation. For data with homogeneous variance in a normal distribution, two-tailed Student’s t-test (two groups) or one-way ANOVA followed by a Bonferroni post hoc test (three or more groups) were used. For data with non-normal distribution or heterogeneous variance, nonparametric Mann–Whitney U (two groups) or Kruskal–Wallis tests followed by a Bonferroni post hoc test were conducted. The correlation between miR-378a-3p and PD-L1 levels was assessed by Pearson correlation analysis. The data presented in were analyzed by Fisher’s exact test. Statistical significance was set at P < 0.05.
Table 2. The relationship of miR‐378a‐3p expression with HCC clinicopathological features
3. Results
In this study, we aimed to investigate whether miR-378a-3p plays an important role in modulating HCC progression and to reveal the underlying molecular mechanisms via PD-L1. Through qRT-PCR detection, we found that miR-378a-3p levels exhibited a downward trend in HCC and were negatively correlated with PD-L1 levels. In vitro experiments indicated miR-378a-3p-PD-L1 axis regulated the differentiation of CD25+ Foxp3+ Treg cells. Furthermore, the overexpression of miR-378a-3p hindered cell proliferation and migration but facilitated apoptosis by repressing STAT3 signaling in HCC cells. To sum up, it appears that miR-378a-3p inhibits HCC tumorigenesis by regulating PD-L1 and STAT3.
3.1. miR-378a-3p is expressed at low levels in HCC tissues
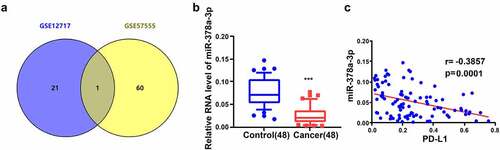
To investigate whether miR-378a-3p plays an important role in HCC progression, we first combined and compared the Gene Expression Omnibus (GEO) HCC datasets, GSE12717 and GSE57555, to examine the expression of miR-378a-3p in HCC. We found that miR-378a-3p expression was low in HCC ()). Moreover, RT-qPCR experiments showed that HCC tissues from 48 patients with HCC had lower miR-378a-3p expression levels than adjacent non-tumor tissues ()). Furthermore, the mRNA expression levels of PD-L1, an immune checkpoint, displayed an inverse relationship with the expression levels of miR-378a-3p in HCC tissues ()).
Figure 1. miR-378a-3p is lowly expressed in HCC tissues. (A) HCC GEO datasets (GSE12717 and GSE57555) were analyzed and one lowly expressed gene was identified from the intersection. (B) qRT-PCR analysis of miR-378a-3p expression in 48 pairs of HCC and normal tissues obtained from HCC patients. (C) Negative correlation between miR-378a-3p and PD-L1 expression in HCC samples. ***P < 0.001.
Based on the average expression level of miR-378a-3p, 48 pairs of tissue specimens fell into high and low miR-378a-3p expression groups. In addition, the miR-378a-3p expression levels were inversely correlated with tumor size and vascular invasion (P < 0.05, ).
3.2. PD-L1 is a direct target of miR-378a-3p
First, we investigated the inhibitory effect of miR-378a-3p on the expression ofPD-L1, via bioinformatics analyses, and predicted binding sites of the miRNA within the 3’-UTR based on data from the starBase (http://starbase.sysu.edu.cn/) and miRDB (http://mirdb.org/) databases ()). Second, we searched for evidence of the miR-378a-3p-PD-L1 interaction using a dual luciferase assay. Luciferase activity decreased in HEK293T cells following joint transfection with miR-378a-3p mimics and wild-type PD-L1; however, luciferase activity was not affected by joint transfection with miR-378a-3p mimics and mutant PD-L1 ()). This indicated that miR-378a-3p directly targets PD-L1 mRNA.
Figure 2. PD-L1 solved as the direct target of miR-378a-3p. (A) Schematic miR-378a-3p putative target sites in 3’UTRs of PD-L1. (B) Dual luciferase reporter assays. (C) The expression level of miR-378a-3p was evaluated using qRT-PCR in HCC cells after transfection. (D) qRT-PCR, (E) Western blot, and (F) flow cytometry were used to evaluate the expression level of PD-L1 after transfection. Data were shown as mean ± SD from three independent experiments. *P < 0.05, **P < 0.01, and ***P < 0.001.
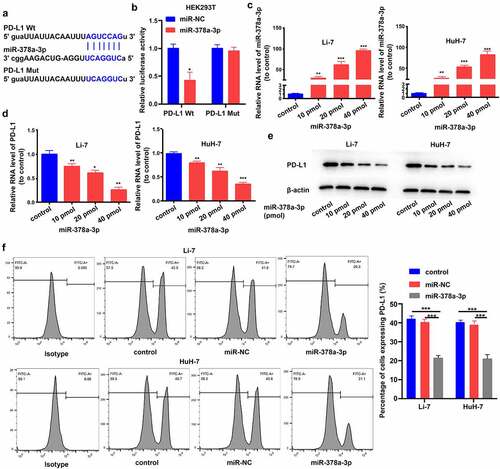
Then, Li-7 and HuH-7 cells were transfected with miR-378a-3p mimics (10, 20, and 40 pmol) to further explore the modulation of PD-L1 expression by miR-378a-3p and the role of miR-378a-3p in HCC tumor formation. RT-qPCR analysis showed that transfection with miR-378a-3p mimics effectively upregulated miR-378a-3p in a dose-dependent manner ()). Additionally, PD-L1 mRNA and protein levels were compared between cells transfected with miR-NC and those transfected with miR-378a-3p mimics, and the results corroborated that miR-378a-3p suppresses PD-L1 expression in HCC cells (). In subsequent experiments, 40 pmol was taken as the appropriate dose for transfection of miRNA mimics because the strongest effect was seen at this dose. Flow cytometry showed that 40 pmol miR-378a-3p markedly decreased PD-L1 expression levels on the cell surface ()).
3.3. miR-378a-3p overexpression reduces HCC cell viability and promotes apoptosis
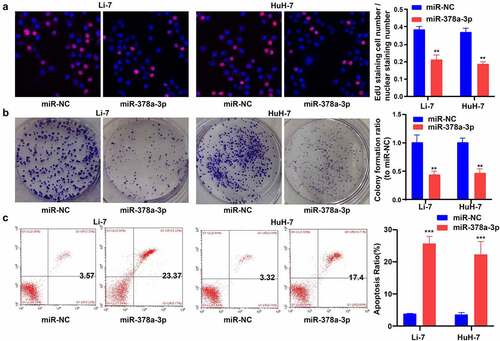
Next, EdU and colony-formation assays were performed to examine the impact of miR-378a-3p expression on the growth of HCC cells. Compared with cells transfected with miR-NC, Li-7 and HuH-7 cells transfected with miR-378a-3p mimics showed decreased viability ()). In addition, miR-378a-3p mimic transfection negatively affected the colony-forming capacity of Li-7 and HuH-7 cells ()). Furthermore, the annexin V/PI assay revealed that transfection with the miR-378a-3p mimics effectively increased the rate of apoptosis in Li-7 and HuH-7 cells ()).
Figure 3. miR-378a-3p overexpression reduced HCC cell viability and promoted cell apoptosis. (A) EdU assay showed that miR-378a-3p reduced HCC cell viability. (B) Colony formation assay showed that miR-378a-3p inhibited HCC cell to form colonies. (C) miR-378a-3p transfection effectively induced apoptosis in HCC cell. Data were shown as mean ± SD from three independent experiments. **P < 0.01, and ***P < 0.001.
c-MYC is an indispensable regulator of cell growth and proliferation. Compared with miR-NC, the miR-378a-3p mimics reduced the mRNA and protein levels of c-MYC in Li-7 and HuH-7 cells, suggesting that this may be the mechanism by which miR-378a-3p controls HCC cell proliferation ().
Figure 4. The potential molecular mechanisms of the regulation of miR-378a-3p to the cell viability and apoptosis of HCC cells. (A) C-MYC, as a major gene involving in cell growth, was detected with qRT-PCR. (B) C-MYC was detected with Western blot. (C, D) The levels of major genes related to apoptosis were evaluated using qRT-PCR and Western blot. Data were shown as mean ± SD from three independent experiments. **P < 0.01.
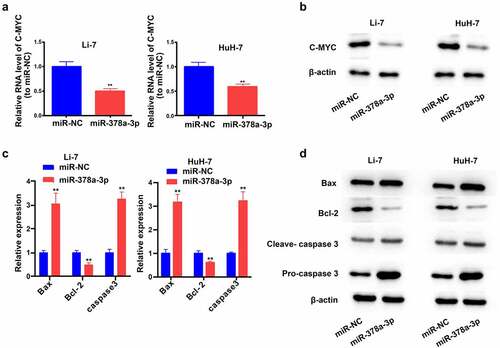
We then assessed the levels of the main genes related to apoptosis pathways (). WB and RT-qPCR results revealed that the overexpression of miR-378a-3p reduced the protein and RNA levels of BCL-2 (a pro-survival gene) in Li-7 and HuH-7 cells, while increasing those of BAX (a pro-apoptotic gene) and caspase 3.
3.4. miR-378a-3p impedes HCC cell invasion and migration
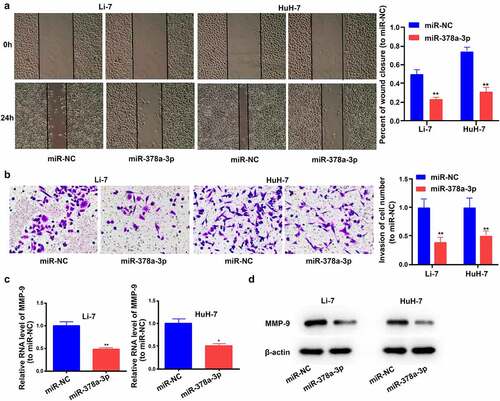
The efficacy of HCC therapy is lower in patients with metastatic HCC. Therefore, we next examined the impact of miR-378a-3p on the migration and invasion of Li-7 and HuH-7 cells. Wound-healing experiments showed that the overexpression of miR-378a-3p markedly decreased the number of migratory HCC cells in the gap area ()) and significantly decreased the number of invading Li-7 and HuH-7 cells ()). Next, we investigated the potential mechanisms by examining the expression levels of MMP-9 (a crucial matrix metalloproteinase in HCC cell metastasis) [Citation23–25]. The transfection of miR-378a-3p mimics decreased MMP-9 mRNA and protein expression levels in Li-7 and HuH-7 cells. Collectively, these results suggest that miR-378a-3p may have an anti-metastatic effect via the downregulation of MMP-9 expression levels ().
Figure 5. miR-378a-3p overexpression reduced HCC cell invasion and migration. (A) A wound healing assay was performed to investigate cell migration. (B) Transwell assay was employed to investigate cell invasion status. (C) The mRNA level of MMP-9 was detected in HCC cells using qRT-PCR. (D) The protein level of MMP-9 was detected in HCC cells. Data were shown as mean ± SD from three independent experiments. *P < 0.05 and **P < 0.01.
3.5. miR-378a-3p overexpression leads to the downregulation of STAT3
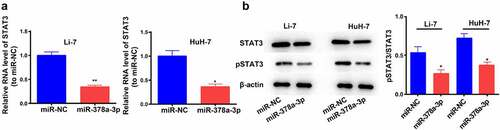
STAT3 binds to miR-378a-3p in breast cancer [Citation26]. Moreover, several studies have shown that STAT3 exerts a significant impact on the initiation and development of HCC [Citation27–29]. Therefore, we determined its expression levels and found that miR-378a-3p overexpression reduced STAT3 mRNA expression levels ()). WB analysis showed that miR-378a-3p overexpression effectively decreased the protein levels of STAT3 and p-STAT3 in Li-7 and HuH-7 cells, indicating that miR-378a-3p probably blocks the formation of HCC tumors by controlling the STAT3 signaling pathway ()).
Figure 6. miR-378a-3p overexpression led to down-regulation of STAT3. (A) qRT-PCR and (B) Western blotting were used to evaluate the expression level of STAT3 in HCC cells after transfection. Data were shown as mean ± SD from three independent experiments. *P < 0.05 and **P < 0.01.
3.6. miR-378a-3p regulates the differentiation of CD25+ Foxp3+ Treg cells
Next, HCC/T cell co-culture assays were performed to investigate the involvement of miR-378a-3p in Treg development. Following transfection of miR-378a-3p mimics, we sequestered T cells from the mononuclear population of peripheral blood. Then, we labeled these cells with antibodies against CD25 cell surface molecules using antibodies against CD25 and Foxp3 conjugated with APC and Brilliant Violet 421™, respectively. There were 2.73% of CD25+ Foxp3+ Treg cells (most of the inhibitory T cells) in the T cell non-activation group, and 2.15% in the T cell activation group ()). In addition, the flow cytometry results showed that, unlike with miR-NC transfection, this proportion dropped down following the transfection of miR-378a-3p mimics into Li-7 and HuH-7 cells in the co-culture model, suggesting that miR-378a-3p probably impedes HCC cell immune escape by suppressing Treg differentiation ().
Figure 7. miR-378a-3p modulated the cell differentiation of CD25+ Foxp3+ Treg. (A) The percentage of CD4+CD25+ Foxp3+ Tregs in the CD4+ population was detected using FACS. (B, C) Up-regulation of miR-378a-3p lead to a decrease in Treg induction compared to the negative controls. (D) Detecting cytokine levels with qRT-PCR in co-culture medium. Data were shown as mean ± SD from three independent experiments. *P < 0.05 and **P < 0.01.
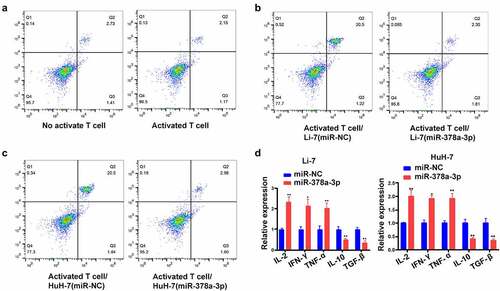
Subsequently, we performed RT-qPCR analysis to determine changes in cytokine levels in the co-culture models following transfection of miR-378a-3p mimics. We found that miR-378a-3p mimics upregulated the IL-2, TNF-α, and IFN-γ mRNA, while TGF-β and IL-10 were markedly downregulated following miR-378a-3p mimic transfection into HCC cells. Thus, it can be concluded that miR-378a-3p probably targets PD-L1 in HCC cells to prevent the differentiation of T cells into the Treg phenotype ()).
4. Discussion
miRNAs are indispensable regulators that are able to negatively regulate target gene expression by inhibiting translation and/or initiating mRNA decay [Citation30]. The regulatory functions of miRNAs in the invasion and proliferation of HCC cells have recently been validated. For example, miR-612 regulates the invasion of HCC via HADHA-mediated lipid reprogramming [Citation31]. Further, PD-L1 is crucial for the immune escape of HCC [Citation32]. Nonetheless, the role of the miRNA/PD-L1 axis in HCC remains unknown. Thus, the present study aimed to investigate whether the miRNA/PD-L1 axis plays a role in HCC development and immune escape.
PD-L1, also called B7-H1, belongs to the B7 superfamily [Citation33,Citation34]. Immune cells, macrophages, B cells, dendritic cells, and T cells express many members of the B7 family, and their expression levels are increased after activation of the cells [Citation32,Citation35]. PD-L1 also inhibits immune reactions through peripheral T-cell tolerance via interplay with the proteins on the surface of macrophages and T cells. Non-tumor tissues can avoid immunological damage through immunosuppression via the PD-1/PD-L1 pathway [Citation36,Citation37]. However, a myriad of human cancers, including HCC, display anomalies in the regulation of PD-L1 expression [Citation38], which influences tumor formation by maintaining the suppression of adaptive immune reactions and anti-tumor immunity [Citation39–41].
In this study, we integrated two HCC GEO datasets, GSE12717 and GSE57555, to identify pivotal miRNA biomarkers of HCC. miR-378a-3p levels displayed a marked decrease in HCC tissues. Using bioinformatics tools, we determined that the PD-L1 3’-UTR is a target of miR-378a-3p, which is indicative of its likely function in the immune escape of tumor cells. Subsequently, in vitro experiments showed that miR-378a-3p decreased HCC cell viability, invasion, and migration, and promoted apoptosis through the inhibition of STAT3 phosphorylation. Bioinformatics prediction with miRDB (http://mirdb.org/) revealed that TRIM44 is a potential target gene of miR-378a-3p. Importantly, TRIM44 is closely related to the phosphorylation of STAT3 [Citation42,Citation43]. Hence, we speculate that miR-378a-3p might affect the phosphorylation of STAT3 by regulating TRIM44.
Furthermore, a co-culture model of T cells and HCC cells showed that miR-378a-3p may be disadvantageous to Treg induction and HCC immune inhibition, considering the decrease in the number of Tregs in the model after transfection of miR-378a-3p mimics. The percentage and activity of Tregs are enhanced in human cancers, and this favors the immune escape of tumor cells by inhibiting the ability of effector T cells to resist tumors [Citation44,Citation45]. Furthermore, previous reports have shown that PD-L1 expression levels are related to the upregulation of Tregs in the tumor environment [Citation46,Citation47]. Concurrently, the involvement of PD-L1 in Treg development and the enhancement of Treg immune-inhibiting capacity has been speculated. Here, we further demonstrated that miR-378a-3p mimic transfection into HCC cells in the co-culture model resulted in the downregulation of IL-10 and TGF-β and the upregulation of IFN-γ, IL-2, and TNF-α, thus reflecting the activity of effector T cells [Citation48,Citation49]. It can be concluded that miR-378a-3p has an inhibitory effect on T cell immune escape of HCC cells via PD-L1 decrement. We explored the roles of miR-378a-3p/PD-L1 in the progress of HCC and their possible mechanism to provide new insights for the clinical diagnosis and treatment of HCC.
Nevertheless, there were certain limitations to the present study that should be considered. The lack of in vivo evidence is the main limitation, and this will be addressed in future studies. The clinical value of miR-378a-3p in HCC also requires further investigation.
5. Conclusions
To our knowledge, this is the first study uncovering the role of the miR-378a-3p/PD-L1 axis in HCC. As shown in the graphical abstract, miR-378a-3p suppressed PD-L1 expression but promoted a T cell-controlled anticancer response in HCC cells. In addition, miR-378a-3p markedly suppressed proliferation, migration, invasion, and other phenotypes in HCC cells by suppressing STAT3 signaling activity and modulating its downstream targets. These results suggest that miR-378a-3p hinders HCC progression. Hence, since blocking the PD-L1 pathway is a potential scheme for HCC therapy, miR-378a-3p may be a promising novel target for the development of treatments targeting PD-L1-mediated immune response evasion.
Patient consent for publication
No identifying information was included in the manuscript.
Authors’ contributions
YL and TZ performed the experiments and generated the data. WZ made substantial contributions to the conception and design of the present study. XC, DL, and MZ conducted data analysis and the interpretation of the data. All authors contributed to the drafting and revision of the manuscript. All authors read, revised, and approved the final manuscript and agreed to be accountable for all aspects of the research in ensuring that the accuracy or integrity of any part of the work are appropriately investigated and resolved.
Disclosure statement
No potential conflict of interest was reported by the author(s).
Data availability statement
The datasets used and/or analyzed during the current study are available from the corresponding author on reasonable request.
Additional information
Funding
References
- Tang YH, He GL, Huang SZ, et al. The long noncoding RNA AK002107 negatively modulates miR-140-5p and targets TGFBR1 to induce epithelial-mesenchymal transition in hepatocellular carcinoma. Mol Oncol. 2019;13(5):1296–1310.
- Teng CF, Wu HC, Su IJ, et al. Hepatitis B virus Pre-S mutants as biomarkers and targets for the development and recurrence of hepatocellular carcinoma. Viruses. 2020;12(9). DOI:10.3390/v12090945
- Tseng CH, Hsu YC, Chen TH, et al. Hepatocellular carcinoma incidence with tenofovir versus entecavir in chronic hepatitis B: a systematic review and meta-analysis. Lancet Gastroenterol Hepatol. 2020;5(12):1039–1052.
- Romano A, Angeli P, Piovesan S, et al. Newly diagnosed hepatocellular carcinoma in patients with advanced hepatitis C treated with DAAs: a prospective population study. J Hepatol. 2018;69(2):345–352.
- Forner A, Reig M, Bruix J. Hepatocellular carcinoma. Lancet. 2018;391(10127):1301–1314.
- Cho HJ, Kim B, Kim HJ, et al. Liver stiffness measured by MR elastography is a predictor of early HCC recurrence after treatment. Eur Radiol. 2020;30(8):4182–4192.
- Gao X, Zhan M, Wang L, et al. Timing of DAA initiation after curative treatment and its relationship with the recurrence of HCV-related HCC. J Hepatocell Carcinoma. 2020;7:347–360.
- Zhao Y, Wang Z, Zhang W, et al. MicroRNAs play an essential role in autophagy regulation in various disease phenotypes. Biofactors. 2019;45(6):844–856.
- Galagali H, Kim JK. The multifaceted roles of microRNAs in differentiation. Curr Opin Cell Biol. 2020;67:118–140.
- Wang X, Chen H, Bai J, et al. MicroRNA: an important regulator in acute myeloid leukemia. Cell Biol Int. 2017;41(9):936–945.
- Norouzi M, Yasamineh S, Montazeri M, et al. Recent advances on nanomaterials-based fluorimetric approaches for microRNAs detection. Mater Sci Eng C Mater Biol Appl. 2019;104:110007.
- Emamgolizadeh Gurt Tapeh B, Mosayyebi B, Samei M, et al. microRNAs involved in T-cell development, selection, activation, and hemostasis. J Cell Physiol. 2020;235(11):8461–8471.
- Emming S, Chirichella M, Monticelli S. MicroRNAs as modulators of T cell functions in cancer. Cancer Lett. 2018;430:172–178.
- Shirjang S, Mansoori B, Asghari S, et al. MicroRNAs in cancer cell death pathways: apoptosis and necroptosis. Free Radic Biol Med. 2019;139:1–15.
- Staicu CE, Predescu DV, Rusu CM, et al. Role of microRNAs as Clinical Cancer Biomarkers for Ovarian Cancer: a Short Overview. Cells. 2020;9(1). DOI:10.3390/cells9010169
- Anauate AC, Leal MF, Calcagno DQ, et al. The complex network between MYC oncogene and microRNAs in gastric cancer: an overview. Int J Mol Sci. 2020;21(5). DOI:10.3390/ijms21051782
- Gupta M, Akhtar J, Sarwat M. MicroRNAs: regulators of immunological reactions in hepatocellular carcinoma. Semin Cell Dev Biol. 2021. DOI:10.1016/j.semcdb.2021.05.025
- Zhang L, Wu ZA. MicroRNA-378a-3p downregulation as a novel biomarker with poor clinical outcomes in cervical cancer. Biomed Environ Sci. 2021;34(3):213–221.
- Mao Y, Li W, Hua B, et al. Circular RNA_PDHX promotes the proliferation and invasion of prostate cancer by sponging MiR-378a-3p. Front Cell Dev Biol. 2020;8:602707.
- Rong D, Dong Q, Qu H, et al. m(6)A-induced LINC00958 promotes breast cancer tumorigenesis via the miR-378a-3p/YY1 axis. Cell Death Discov. 2021;7(1):27.
- Qian F, Wang J, Wang Y, et al. MiR-378a-3p as a putative biomarker for hepatocellular carcinoma diagnosis and prognosis: computational screening with experimental validation. Clin Transl Med. 2021;11(2):e307.
- Livak KJ, Schmittgen TD. Analysis of relative gene expression data using real-time quantitative PCR and the 2(-Delta Delta C(T)) method. Methods. 2001;25(4):402–408.
- Thieringer FR, Maass T, Anthon B, et al. Liver-specific overexpression of matrix metalloproteinase 9 (MMP-9) in transgenic mice accelerates development of hepatocellular carcinoma. Mol Carcinog. 2012;51(6):439–448.
- Lu L, Zhang Q, Wu K, et al. Hepatitis C virus NS3 protein enhances cancer cell invasion by activating matrix metalloproteinase-9 and cyclooxygenase-2 through ERK/p38/NF-kappaB signal cascade. Cancer Lett. 2015;356(2 Pt B):470–478.
- Ordonez R, Carbajo-Pescador S, Prieto-Dominguez N, et al. Inhibition of matrix metalloproteinase-9 and nuclear factor kappa B contribute to melatonin prevention of motility and invasiveness in HepG2 liver cancer cells. J Pineal Res. 2014;56(1):20–30.
- Yang Q, Zhao S, Shi Z, et al. Chemotherapy-elicited exosomal miR-378a-3p and miR-378d promote breast cancer stemness and chemoresistance via the activation of EZH2/STAT3 signaling. J Exp Clin Cancer Res. 2021;40(1):120.
- Huang H, Bu YZ, Zhang XY, et al. LINC01433 promotes hepatocellular carcinoma progression via modulating the miR-1301/STAT3 axis. J Cell Physiol. 2019;234(5):6116–6124.
- Zhu M, Shi X, Gong Z, et al. Cantharidin treatment inhibits hepatocellular carcinoma development by regulating the JAK2/STAT3 and PI3K/Akt pathways in an EphB4-dependent manner. Pharmacol Res. 2020;158:104868.
- Wu S, Ye S, Lin X, et al. Small hepatitis B virus surface antigen promotes malignant progression of hepatocellular carcinoma via endoplasmic reticulum stress-induced FGF19/JAK2/STAT3 signaling. Cancer Lett. 2021;499:175–187.
- Fabian MR, Sonenberg N. The mechanics of miRNA-mediated gene silencing: a look under the hood of miRISC. Nat Struct Mol Biol. 2012;19(6):586–593.
- Liu Y, Lu LL, Wen D, et al. MiR-612 regulates invadopodia of hepatocellular carcinoma by HADHA-mediated lipid reprogramming. J Hematol Oncol. 2020;13(1):12.
- Ke MY, Xu T, Fang Y, et al. Liver fibrosis promotes immune escape in hepatocellular carcinoma via GOLM1-mediated PD-L1 upregulation. Cancer Lett. 2021;513:14–25.
- Zhang W, Liu Y, Yan Z, et al. IL-6 promotes PD-L1 expression in monocytes and macrophages by decreasing protein tyrosine phosphatase receptor type O expression in human hepatocellular carcinoma. J Immunother Cancer. 2020;8(1). DOI:10.1136/jitc-2019-000285
- Arkenau HT, Martin-Liberal J, Calvo E, et al. Ramucirumab plus pembrolizumab in patients with previously treated advanced or metastatic biliary tract cancer: nonrandomized, open-label, phase I trial (JVDF). Oncologist. 2018;23(12):1407–e136.
- Sun TX, Li MY, Zhang ZH, et al. Usnic acid suppresses cervical cancer cell proliferation by inhibiting PD-L1 expression and enhancing T-lymphocyte tumor-killing activity. Phytother Res. 2021. DOI:10.1002/ptr.7103
- Verdura S, Cuyas E, Cortada E, et al. Resveratrol targets PD-L1 glycosylation and dimerization to enhance antitumor T-cell immunity. Aging (Albany NY). 2020;12(1):8–34.
- Zhang YF, Zhang ZH, Li MY, et al. Britannin stabilizes T cell activity and inhibits proliferation and angiogenesis by targeting PD-L1 via abrogation of the crosstalk between Myc and HIF-1alpha in cancer. Phytomedicine. 2021;81:153425.
- Pena-Asensio J, Calvo H, Torralba M, et al. Anti-PD-1/PD-L1 based combination immunotherapy to boost antigen-specific CD8(+) T cell response in hepatocellular carcinoma. Cancers (Basel). 2021;13(8). DOI:10.3390/cancers13081922
- Sasaki S, Nishikawa J, Sakai K, et al. EBV-associated gastric cancer evades T-cell immunity by PD-1/PD-L1 interactions. Gastric Cancer. 2019;22(3):486–496.
- Cortellini A, Buti S, Bersanelli M, et al. Evaluating the role of FAMIly history of cancer and diagnosis of multiple neoplasms in cancer patients receiving PD-1/PD-L1 checkpoint inhibitors: the multicenter FAMI-L1 study. Oncoimmunology. 2020;9(1):1710389.
- Komura N, Mabuchi S, Shimura K, et al. The role of myeloid-derived suppressor cells in increasing cancer stem-like cells and promoting PD-L1 expression in epithelial ovarian cancer. Cancer Immunol Immunother. 2020;69(12):2477–2499.
- Chen L, Yi C, Li W, et al. Inhibition of SPATS2 suppresses proliferation and invasion of hepatocellular carcinoma cells through TRIM44-STAT3 signaling pathway. J Cancer. 2021;12(1):89–98.
- Xiong D, Jin C, Ye X, et al. TRIM44 promotes human esophageal cancer progression via the AKT/mTOR pathway. Cancer Sci. 2018;109(10):3080–3092.
- Whiteside TL. What are regulatory T cells (Treg) regulating in cancer and why? Semin Cancer Biol. 2012;22(4):327–334.
- Jie HB, Gildener-Leapman N, Li J, et al. Intratumoral regulatory T cells upregulate immunosuppressive molecules in head and neck cancer patients. Br J Cancer. 2013;109(10):2629–2635.
- Schuler PJ, Schilling B, Harasymczuk M, et al. Phenotypic and functional characteristics of CD4+ CD39+ FOXP3+ and CD4+ CD39+ FOXP3neg T-cell subsets in cancer patients. Eur J Immunol. 2012;42(7):1876–1885.
- Tauriello DVF, Palomo-Ponce S, Stork D, et al. TGFbeta drives immune evasion in genetically reconstituted colon cancer metastasis. Nature. 2018;554(7693):538–543.
- Galeano Nino JL, Tay SS, Tearle JLE, et al. The Lifeact-EGFP mouse is a translationally controlled fluorescent reporter of T cell activation. J Cell Sci. 2020;133(5). DOI:10.1242/jcs.238014
- Snyder LD, Chan C, Kwon D, et al. Polyfunctional T-cell signatures to predict protection from cytomegalovirus after lung transplantation. Am J Respir Crit Care Med. 2016;193(1):78–85.