
ABSTRACT
Bile acids, the main organic solutes in bile, have been established to play an important role at physiological concentrations in gastrointestinal metabolism. However, under pathological conditions, such as cholestatic disease, cholestasis can damage hepatocytes/biliary epithelial cells leading to apoptosis or necrosis. Clinically, pancreatic head cancer usually presents with obstructive jaundice and increased serum bile acid levels, suggesting that pancreatic cancer is intricately correlated with a high bile acid environment in the human body. An increasing body of evidence suggests that bile acids are toxic to normal human and colon cancer cells. Nonetheless, the effect of bile acids on the occurrence and development of pancreatic cancer remains a matter of debate. In the present study, to explore the direct effects of high serum concentrations of bile acids on pancreatic cancer and the possible related mechanisms, human pancreatic cancer (PANC-1) cells were subject to different concentrations of bile acid mixtures to assess cell viability and the migration and invasion ability. Besides, we found that a high bile acid environment could inhibit the proliferation and migration of pancreatic cancer cells through ROS(Reactive oxygen species) induction and the EMT(epithelial-mesenchymal transition) pathway, thereby promoting the apoptosis of pancreatic cancer cells.
Abbreviations BAs: Bile Acids; EMT: epithelial-mesenchymal transition; FBS: fatal bovine serum;CCK-8: Cell-Counting-Kit-8; ROS: reactive oxygen species; CA: cholic acid; CDCA: chenodeoxycholic acid; GCDCA: Glycochenodeoxycholic acid; PVDF: Poly vinylidene fluoride
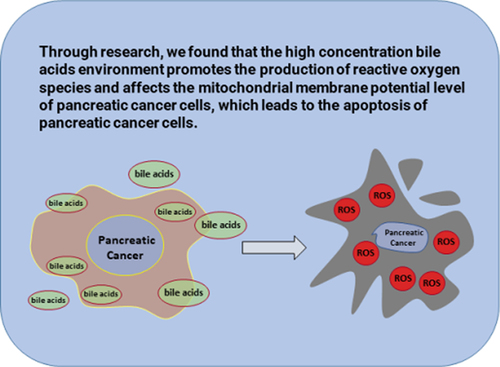
Graphical abstract
Introduction
Pancreatic cancer is a malignant digestive tract tumor, which is difficult to diagnose and treat. Its morbidity and mortality have increased significantly in recent years, with an estimated 5-year survival rate of less than 1%. Pancreatic cancer has been established as one of the malignant tumors with the worst prognosis [Citation1]. For prevention, early detection and effective treatment, a better understanding of the pathogenesis and disease pathophysiology is essential. Pancreatic cancer risk factors include drinking, smoking, diet (high fat, red meat), obesity, diabetes, gallstones, long bile ducts and pancreatic ducts, chronic pancreatitis, and hypertriglyceridemia [Citation2]. It is worth noting that 60% of pancreatic cancers involve the head of the pancreas close to the biliary tract, often presenting with extrahepatic cholestasis [Citation3–5]. Accordingly, we hypothesized that a high bile acid environment is closely related to pancreatic cancer progression
Bile acids mainly consist of water, electrolytes, and organic molecules such as bile salts, cholesterol, phospholipids and proteins [Citation6]. Bile acids are hydrolyzed by bile acid hydrolase from intestinal bacteria (such as Bacteroides, Clostridium and Enterococcus) [Citation7] and reabsorbed through the enterohepatic circulation (the heptametric circulation of bile). Interestingly, bile acids were first identified as carcinogens in the 1940s. In this regard, bile acids, especially secondary bile acids, have been reported to play an important role in the carcinogenesis of gastrointestinal [Citation4] and breast cancers [Citation8,Citation9]. However, its anti-tumor effects have also been reported. The biological effects of bile acids on cancer progression are reportedly dependent on their concentration, molecular structure (coupled and uncoupled, primary and secondary), and cellular environment [Citation10]. At present, the effect of a high bile acid environment on pancreatic cancer remains unclear, warranting further studies.
To clarify the biological alterations of pancreatic cancer cells in a high bile acid environment, a human pancreatic cancer cell line PANC-1 was subject to different concentrations of bile acids. The invasion and migration ability of pancreatic cancer cells, the cell viability, and changes in the EMT(epithelial-mesenchymal transition) process of pancreatic cancer cells were assessed. We found that changes in the mitochondrial membrane potential of pancreatic cancer cells and the production of reactive oxygen species inside the pancreatic cancer cells could lead to apoptosis. Further experiments were conducted to explore the mechanisms underlying this phenomenon.
Materials and methods
Experimental materials
The PANC-1 cell line was obtained from the Shanghai Institute of Biological Sciences, Chinese Academy of Sciences. DMEM-high glucose medium and FBS(Fatal-bovine serun)were obtained from Zhejiang Tian hang Biotechnology Co, Ltd. The BCA(Bicinchoninic acid) protein concentration kit, SDS-PAGE(Sodium dodecyl sulfate Polyacrylamide gel electrophoresis) protein loading buffer and SDS-PAGE gel preparation kit were purchased from Shanghai Binetian Biotechnology Co, Ltd. Finally, the JC-1 kit, cell apoptosis kit, and reactive oxygen detection kit were obtained from Jiangsu KGI Biotechnology Co, Ltd.
Cell culture
The human pancreatic cancer cell line PANC-1 was used in this study. The cells were initially cultured in a 75 cm2 vial with a cell concentration of 2.0x10³/ml. The DMEM medium contained 10% fetal bovine serum and conventional antibiotics [Citation11]. DCA(Deoxycholate citrate agar), CDCA(Chenodeoxycholic acid), and GCDCA(Gly-cochenodeoxycholic acid) were dissolved in 1% DMSO solution. The PANC-1 cells were divided into a control group, 20 µmol/l cholic acid concentration group, 25 µmol/l cholic acid concentration group, and 30 µmol/l cholic acid concentration group [Citation12]. PANC-1 cells were starved for 24 h, and bile acids of different concentrations were added and cultured for 24 hours. All cells were incubated at 37°C in a humidified atmosphere of 5% CO2 in the air.
Cell scratch assay
Cells in the logarithmic phase were used for the cell scratch experiment. The microscopic lines were observed at 0, 6, 12, and 24 hours, the width of the scratch was measured, and pictures were taken. Image J software was used to calculate the mean value of the distance between cells.
CCK8 assay
PANC-1 cells in the logarithmic growth were digested with trypsin to prepare a cell suspension seeded in a 96-well plate at a density of 7000 cells/well. The plates were planted at 37°C and 5% CO2 for 24 hours. 0 µmol/l, 20 µmol/l, 25 µmol/l, 30 µmol/l cholic acid were added to the medium mixture. Five multiple wells were set up and cultured for 24 h and 48 h. The old medium was discarded in a 96-well plate after the corresponding time, then 100 µl of serum-free medium and 10 μl of CCK-8(Cell counting kit-8) solution were added to each well. The two liquids were mixed in the dark and incubated. 2 hours after adding the CCK8 reagent, a microplate reader was used to detect the absorbance at a wavelength of 450 nm [Citation13]. The inhibitory rate was calculated as follows: Inhibitory rate = (experimental well absorbance-blank hole absorbance)/(control well absorbance-blank hole absorbance) x100%.
Transwell assay
PANC-1 cells in the logarithmic growth were cultured with 20 µmol/l concentrations of cholic acid for 24 hours and counted. The chambers were coated under pre-cooling conditions, then 100 µl cell suspension of each group was added to the chambers at a density of 5 × 10⁵ cells/ml. 20% FBS medium was added to the lower chamber of the small chamber. After incubating for a certain period, the cells were stained with crystal violet and observed under a microscope. When the cell migration ability was assessed, matrigel was not used to coat the basement membrane in the chamber, while the other steps were the same as for the invasion experiment.
qRT-PCR(quantitative real-time polymerase chain reaction) to detect the level of EMT-related proteins
PANC-1 cells in the logarithmic growth were cultured with different con-centrations of cholic acid to detect the expression of E-cadherin, N-cadherin, and Vimentin proteins related to EMT. The total RNA was extracted according to the instructions of the Trizol reagent. Then the RNA concentration and purity were assessed. Using the RT-PCR kit, the experimental results were calculated using the 2-ΔΔct method at 37°C, 15 min, 85°C, 5s, 4°C, and 1 min. The primer sequences used are shown in the table below.
Western-blot assay
The BCA Reagent test kit was used to quantify the protein expression levels of PANC-1 cells cultured with different bile acids concentrations. 40µg total protein was electrophoresed on 10.0% SDS PAGE electrophoresis solution at 300mA. 60min later, the protein was reduced and transferred to PVDF(Poly vinylidene fluoride) membrane, blocked at room temperature for 2h, and then added to a primary antibody diluent (1:1000). The mixture was incubated in a shaker overnight at 4°C. The secondary antibody dilution solution was added and incubated for 2 hours [Citation13]. The results were analyzed by Image J software.
Flow cytometry to detect cell apoptosis
The cells in the logarithmic growth phase were seeded in a 6-well plate. According to the experimental design, they were cultured in groups and then digested and collected with trypsin without EDTA(Ethylene Diamine Tetraacetic Acid),washed with PBS and fixed with 70% cold ethanol. After centrifugation and washing, the proportion of apoptotic cells was detected by the Annexin-V/Propidium Iodide kit.
JC-1 staining assay and ROS staining
JC-1 staining Assay: 1 mL of JC-1 dye was added to cells in the logarithmic growth phase and incubated at 37°C for 30 minutes. The supernatant was aspirated, and the cells were washed with JC-1 buffer twice. 2 mL of the cell culture medium was added, and the experimental results were observed under a laser confocal microscope. ROS staining Assay: 25µmol/l cholic acid was added to cells in the logarithmic growth phase and incubated for 6 hours, then 10µM of cell-permeant reagent 2’-7ʹdichlorofluorescin diacetate (DCFH-DA) was added to the medium and incubated at 37°C for 20 minutes. After incubation, add incomplete medium to wash off excess dye and the experimental results were observed under a laser confocal microscope.
Statistical analyses
SPSS 23.0 software was used for one-way analysis of variance, GraphPad Prism 8.0 software was used for figure drawings, and ImageJ software was used for grayscale analysis. All values were expressed as mean ± SD, and a P-value<0.05 was statistically significant.
Results
In this study,during the Transwell and CCK8 assays, we found that the cell viability and metastasis of PANC-1 cells were inhibited by high concentrations of bile acids, which may be attributed to changes in the EMT pathway in pancreatic cancer cells. To validate this hypothesis, we detected EMT pathway-related proteins. It is highly conceivable that our findings could have been induced by apoptosis. Accordingly, we analyzed the expression of apoptosis-related proteins. The mechanism of apoptosis, which may be induced by changes in mitochondrial membrane potential and the intracellular production of reactive oxygen species, was verified by JC-1 and ROS.
A high bile acid environment inhibits the proliferation of pancreatic cancer cells
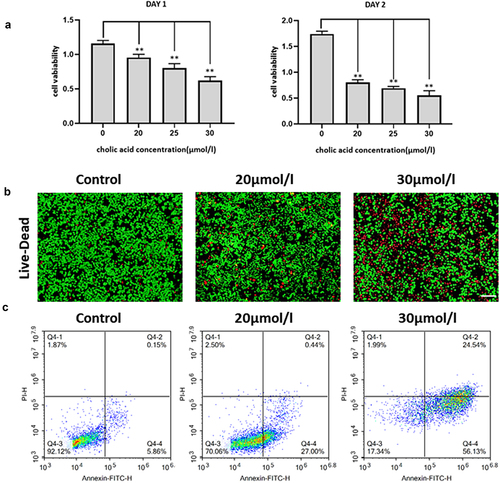
Treatment of PANC-1 cells with different concentrations of bile acids showed that the proliferation of pancreatic cancer cells was significantly inhibited (). The degree of inhibition positively correlated with the administration time and concentration, exhibiting a linear dose and time-dependent relationship. Moreover, the half-maximal inhibitory concentration (IC50) detected by the CCK8 assay was 33.15 µmol/l. Live-dead staining was conducted to validate our results (). Moreover, flow cytometry and Annexin-V/Propidium Iodide apoptosis kit were used to assess differences in the apoptosis rate with the control group. On day 1 of treatment with different con-centrations of bile acids, significant differences were found between the control group and the 20 µmol/l (P = 1.7166 × 10⁻⁵), 25 µmol/l (P = 6.167 × 10⁻⁷), and 30 µmol/l (P = 5.205 × 10⁻⁸) groups. On day 2 of treatment, significant differences were found with the 20 µmol/l (P = 2.58 × 10⁻¹¹), 25 µmol/l (P = 2.02 × 10⁻¹²) and 30 µmol/l (P = 6.73 × 10⁻¹¹) groups (.).
Figure 1. The effect of bile acid on the proliferation ability of PANC cells treated for 24h and 48h compared with the control group, *p<0.05, Figure 1B: The IC50 value calculated by CCK8 value is 33.15umol/l, which is verified by living and dead staining(Scale bar:200μm),Figure 1C: Results of Annexin-V/Propidium Iodide double staining experiment (FITC: Ex/ Em =488/525, PI: Ex/ Em =488/525).
A high bile acid environment inhibits the invasion and migration of pancreatic cancer cells
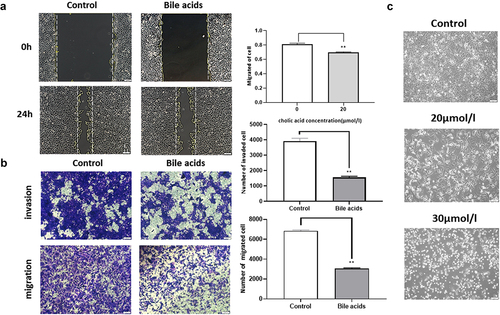
The PANC-1 cells were treated with bile acids at a concentration of 30 µmol/l; the change in cell migration and invasion ability was detected by cell scratch and transwell tests (). We found that the migration and invasion ability of the PANC-1 cells was reduced after the cells were treated with different concentrations of bile acids for 24 hours.The morphological changes of PANC-1 cells cultured with different concentrations of bile acids mixed with DMEM medium were photographed under an electron microscope. The results showed that with an increase in bile acid concentration, the morphology of human pancreatic cancer cells changed from a spindle shape to a round shape, while the nuclei shrank and ruptured ().
Figure 2. Cell scratch experiment test: Detect the effect of bile acids on cell migration and the sta-tistical results of the cell scratch experiment, compared with the control group **P<0.01(Scale bar:200μm), Figure 2B: Cell migration and invasion experiment: The experimental group was cult-ured with 20umol/l bile acid, and the control group was pancreatic cancer cells cultured in complete medium. The changes in cell migration ability were observed, compared with the control group **P<0.01(Scale bar:100μm), Figure 2C: Observation of the effect of different concentrations of bile acid on the morphology of pancreatic cancer cells under an electron microscope (A: blank group; B:20μmol/l bile acid; C 30μmol/l bile acid) (Scale bar:200μm)
A high bile acid environment effect the epithelial-mesenchymal transition of pancreatic cancer cells
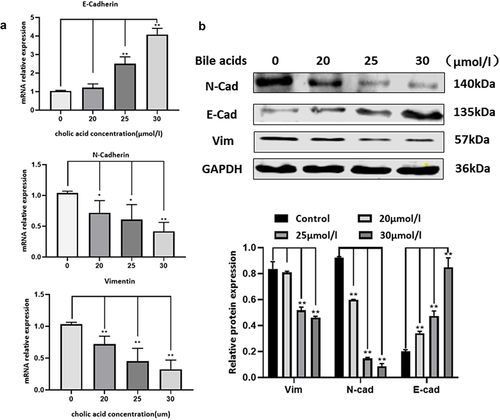
We quantified N-cadherin, E-cadherin, and Vimentin protein expression and changes in mRNA expression levels (). qRT-PCR results showed that com-pared with the control group, with increased bile acid concentration,E-cadherin (P = 0.2, P = 0.002, P = 9.2 × 10⁻⁵) mRNA expression increased, while mRNA levels of N-cadherin (P = 0.049, P = 0.036, P = 0.001819) and Vimentin (P = 0.012, P = 0.0076, P = 0.0011) decreased. Moreover, Western blot showed that compared with the control group, with increased bile acid concentration, E-cadherin (P = 0.000444, P = 8.18 × 10⁻⁵, P = 3.419 × 10⁻⁶) protein expression increased, while the protein levels of N-cadherin (P = 0.000225, P = 1.56 × 10⁻⁵, P = 5.23 × 10*−6) and Vimentin (P = 0.171, P = 0.00021, P = 9.49 × 10⁻⁵) decreased. Importantly, the protein expression levels positively correlated with bile acid concentrations.’
Figure 3. qRT-PCR detects the expression levels of E-cadherin, N-cadherin, and Vimentin protein mRNA. The bile acid concentrations are control, 20umol/l, 25umol/l, 30umol/l, compared with the control group: *p<0.05, **P<0.01, Figure 3B: The effect of bile acid on the changes of pancreatic cancer EMT-related proteins E-cadherin, N-cadherin and Vimentin. The bile acid concentrations are control, 20μmol/l, 25μmol/l, 30μmol/l, compared with the control group: *p<0.05, **P<0.01.
A high bile acid environment induces apoptosis of pancreatic cancer cells through ROS pathway
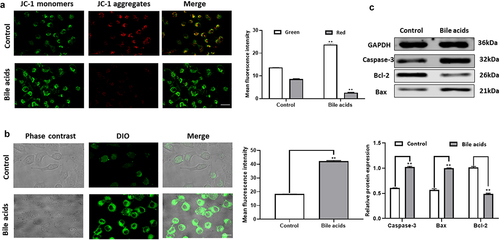
In normal cells, when the membrane potential is normal, JC-1 enters the mitochondria through the mitochondrial membrane, and forms a red fluorescence-emitting polymer due to the increased concentration. In apoptotic cells, the mitochondrial transmembrane potential is deJed, JC-1 is released from the mitochondria, the concentration is reduced, and reversed to the monomeric form that emits green fluorescence. Therefore, the change of mitochondrial membrane potential can be detected qualitatively (shift of cell population) and quantitatively (fluorescence intensity of cell population) by detecting green and red fluorescence.In the present study, we found that when pancreatic cancer cells were cultured with high concentrations of bile acids, the mitochondrial membrane potential level of pancreatic cancer cells decreased. The result is shown in . We use confocal microscopy to detect. The fluorescence excitation wavelength of JC-1 monomer is 490nm, and the emission wavelength is 530nm; the fluorescence excitation wavelength of JC-1 polymer is 525nm, and the emission wavelength is 590nm. Through the DCFH-DA probe, we found that a large amount of ROS was generated in pancreatic cancer cells under the action of bile acids, and the intensity of green fluorescence (Ex/Em=488/525nm)) was proportional to the intracellular level of reactive oxygen species. Compared with the control group, the ROS level in pancreatic cancer cells was significantly increased in response to the high bile acid environment (). The above findings indicated that the apoptosis of pancreatic cancer cells in the bile acid group might decrease the mitochondrial membrane potential level and ROS synthesis. We quantified the protein expression of apoptotic proteins Bcl-2, Bax and Caspase-3 in pancreatic cancer cells. In contrast with the control group, the expression of Bcl-2 protein was downregulated, and the expression of Bax and Caspase-3 was upregulated in response to the high bile acid environment ().
Figure 4. JC-1 staining to detect mitochondrial membrane potential level experimental results(JC-1 monomer: Ex/ Em =490/530nm, JC-1 Polymer: Ex/ Em =525/590nm), Figure 4B: Intracellular ROS level detection results (Ex/Em=488/525nm, Scale bar:20μm), Figure 4C: Changes of apoptosis-related proteins Bcl-2, Bax, and Caspase-3 in pancreatic cancer cells compared with the Control group **P<0.01.
Discussion
It is widely acknowledged that bile acids are important components of bile and play an important role in fat metabolism. When the bile acid concentration is under physiological conditions, it can play an active role in the metabolic process of the human liver, however, under pathological conditions, cholestasis can cause necrosis of hepatocytes and bile duct epithelial cells [Citation14–19]. Human primary bile acids: Deoxycholate citrate agar and Chenodeoxycholic acid are produced in liver cells and are combined with glycine or taurine before they are secreted into the bile duct to form secondary bile acids: Glycochenodeoxycholic acid and lithocholic acid, which are reabsorbed through the enterohepatic circulation. The above process provides the basis for understanding the pathophysiology of extrahepatic cholestasis, especially for pancreatic cancer. According to a study by Garner CM et al., high concentrations of bile acids exert toxic effects on human vascular endothelial cells [Citation20]. In this regard, Shekels LL et al. showed that the cytotoxicity of bile acids is related to the relative hyd-rophobicity of bile acids [Citation21]. Moreover, study by Yi Lu et al. showed that the hydrop-hobic and hydrophilic properties of bile acids might damage cells by solubilizing cell membranes, impairing mitochondrial function, increasing the generation of oxygen free radicals, etc., causing membrane lipid peroxidation and attacking nucleic acids [Citation22–25]. In the present study, we expounded the mechanisms underlying damage induced by high concentrations of bile acids on pancreatic cancer cells. We substantiated that increased bile acid concentrations were paralleled by an increase in the extent of injury to pancreatic cancer cells.
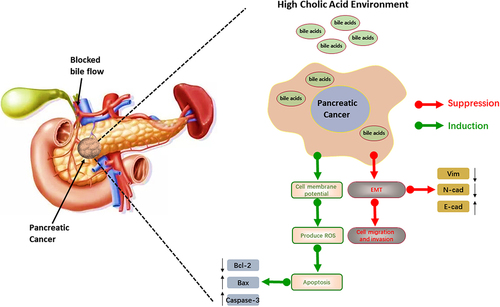
This study showed that a high concentration of bile acids could significantly inhibit the growth of pancreatic cancer cells, influenced by factors including time and bile acid concentration. After culturing in a medium with bile acids, the integrity and stability of the cell membrane or organelle membrane of pancreatic cancer cells were disrupted, leading to changes in the structure and function of the cell. The transwell and cell scratch assays demonstrated that high concentrations of bile acids could inhibit the proliferation, invasion and migration of pancreatic cancer cells. The results of the live-dead and CCK8 assays suggested that the viability and proliferative activity of pancreatic cancer cells were reduced. The Western blot results showed that the expression of N-cadherin and Vim was increased, E-cadherin decreased, and the EMT pathway was altered in pancreatic cancer cells. The decrease in Bcl-2 protein levels and the increase in Bax and Caspase-3 protein levels indicated that pancreatic cancer cells exhibited apoptosis. The results of the ROS assay and JC-1 staining showed that cell apoptosis might be induced by reactive oxygen species. Interestingly, these results suggest that bile acids in the serum of pancreatic cancer patients could directly inhibit pancreatic cancer, and the possible mechanism is shown in . These studies showed that a high concentration of bile acids could inhibit the proliferation and migration of pancreatic cancer cells via ROS induction and the EMT pathway.
Figure 5. The results of the ROS assay and JC-1 staining showed that cell apoptosis might be induced by reactive oxygen species. Interestingly, these results suggest that bile acids in the serum of pancreatic cancer patients could directly inhibit pancreatic cancer, and the possible mechanism.
Importantly, our future studies will assess the effects of different BAs on the growth and survival of pancreatic cancer. This phenomenon is likely to be related to the ability of taurine or glycine to couple with primary BAs. We will also explore how high concentrations of bile acids regulate the apoptosis of pancreatic cancer cells and validate the relationship between the cytotoxicity of bile acids and pancreatic cancer progression. In addition, the influence of diet, microbiota [Citation26] and other factors on the bile acid profile of this patient population should also be assessed to explore the cytotoxic effect of bile acid itself more comprehensively and objectively [Citation27–31].
Conclusion
This study demonstrated the cytotoxic characteristics of bile acid that can be harnessed to affect the proliferative ability of pancreatic cancer cells. Bile acid can inhibit the invasion and migration ability of pancreatic cancer cells by altering the EMT process of pancreatic cancer cells. Moreover, a high concentration of bile acids can affect the membrane potential level of pancreatic cancer cells and increase reactive oxygen species synthesis, leading to cell apoptosis.
Authors’ contributions
ZSP and ZJW designed the experiments; ZSP, CB, YK conducted experiments; ZSP, XMM, YSY analyzed data; ZSP, ZL and ZJW wrote the manuscript. All authors read and approved the final manuscript.
Consent for publication
Written consent was obtained from all participants.
Ethics approval and consent to participate
This study was approved by Biomedical Research Ethics Committee of Anhui Medical University.
Disclosure statement
No potential conflict of interest was reported by the author(s).
Additional information
Funding
References
- Siegel RL, Miller KD, Jemal A. Cancer statistics, 2020. CA Cancer J Clin. 2020;70:7e30.
- Yadav D, Lowenfels AB. The epidemiology of pancreatitis and pancreatic cancer. Gastroenterology. 2013;144(6):1252–1261.
- Winter JM, Maitra A, Yeo CJ. Genetics and pathology of pancreatic cancer. HPB (Oxford). 2006;8(5):324–336. PMID: 18333084.
- Bernstein H, Bernstein C, Payne CM, et al. Bile acids as carcinogens in human gastrointestinal cancers. Mutat Res. 2005;589(1):47–65. PMID: 15652226.
- Nagathihalli NS, Beesetty Y, Lee W, et al. Novel mechanistic insights into ectodomain shedding of EGFR Ligands Amphiregulin and TGF-α: impact on gastrointestinal cancers driven by secondary bile acids. Cancer Res. 2014;74(7):2062–2072.
- De aguiar vallim T, Tarling EJ, Edwards PA. Pleiotropic roles of bile acids in metabolism. Cell Metab. 2013;17(5):657–669.
- Ridlon JM, Harris SC, Bhowmik S, et al. Consequences of bile salt biotransformations by intestinal bacteria. Gut Microbes. 2016;7(1):22e39].
- Feng H-Y, Chen Y-C. Role of bile acids in carcinogenesis of pancreatic cancer: an old topic with new perspective. World J Gastroenterol. 2016;22(33):7463–7477.
- Yee S-B, Song YS, Jeong SH, et al. A novel chenodeoxycholic derivative HS-1200 enhances radiation-induced apoptosis in MCF-7 cells. Oncol Rep. 2007;17(4):919–923. PMID: 17342337.
- Shrader HR, Miller AM, Tomanek-Chalkley A, et al. Effect of bacterial contamination in bile on pancreatic cancer cell survival. Surgery. 2021;169(3):617–622.
- Hong X, Li Z-X, Hou J, et al. Effects of ER-resident and secreted AGR2 on cell proliferation, migration, invasion, and survival in PANC-1 pancreatic cancer cells. BMC Cancer. 2021;21(1):33.
- Joshi S, Cruz E, Rachagani S, et al. Bile acids-mediated overexpression of MUC4 via FAK-dependent c-Jun activation in pancreatic cancer. Mol Oncol. 2016;10(7):1063–1077.
- Xu X, Chen B, Zhu S, et al. Hyperglycemia promotes Snail-induced epithelial–mesenchymal transition of gastric cancer via activating ENO1 expression. Cancer Cell Int. 2019;19(1):344.
- Uibo R, Kisand K, Yang C-Y, et al. Primary biliary cirrhosis: a multi-faced interactive disease involving genetics, environment and the immune response. APMIS. 2012;120(11):857–871.
- Arin MJ. The molecular basis of human keratin disorders [J]. Hum Genet. 2009;125(4):355–357.
- Zhang B, Hu M, Zhang P, et al. BAFF promotes regulatory T-cell apoptosis and blocks cytokine production by activating B cells in primary biliary cirrhosis[J]. Braz J Med Biol Res. 2013;46(5):433–439.
- Flores A, Mayo MJ. Primary biliary cirrhosis in 2014 [J]. Curr Opin Gastroenterol. 2014;30(3):245–252.
- Momah N, Lindor KD. Primary biliary cirrhosis in adults [J]. Expert Rev Gastroenterol Hepatol. 2014;8(4):427–433.
- Rong G-H, Yang G-X, Ando Y, et al. Human intrahepatic biliary epithelial cells engulf blebs from their apoptotic peers [J]. Clin Exp Immunol. 2013;172(1):95–103.
- Berg PA. The role of the innate immune recognition system in the pathogenesis of primary biliary cirrhosis: a conceptual view [J]. Liver International. 2011;31(7):920–931.
- Costarelli V. Bile acids as possible human carcinogens: new tricks from an old dog. International Journal of Food Sciences and Nutrition. 2009;60(sup6):116–125.
- Adachi T, Tajima Y, Kuroki T, et al. Bile-reflux into the pancreatic ducts is associated with the devel-opment of intraductal papillary carcinoma in hamsters. J Surg Res. 2006. 136(1):106–111.
- Ajouz H, Mukherji D, Shamseddine A. Secondary bile acids: an underrecognized cause of colon cancer. World Journal of Surgical Oncology. 2014;12(1):164–169.
- Chiang JYL. Bile acids: regulation of synthesis. J Lipid Res. 2009. 50(10):1955–1966.
- Perez MJ, Briz O. Bile-acid-induced cell injury and protection. World J Gastroenterol. 2009;15(14):1677–1689.
- Kockerling F. (2018). Antibiotic prophylaxis in laparoendoscopic hernia surgery. Int J Abdom Wall Hernia Surg, 1(1), 9. doi: 10.4103/ijawhs.ijawhs_4_18
- Bilgiç Ç, Keske S, and Sobutay, E, et al. Surgical site infections after pancreaticoduodenectomy: preoperative biliary system interventions and antimicrobial prophylaxis.Int. J Infect Dis. 2020;95:148e152.
- Sano S, Sugiura T, Kawamura I, et al. Third-generation cephalosporin for antimicrobial prophylaxis in pancreatoduodenectomy in patients with internal preoperative biliary drainage. Surgery. 2019;165:559e564.
- Urdaneta V, Casadesús J. Interactions between bacteria and bile salts in the gastrointestinal and hepatobiliary tracts.Front Med (Lausanne). Frontiers in Medicine. 2017;4:163.
- Rees DO, Crick PJ, Jenkins GJ, et al. Comparison of the composition of bile acids in bile of patients with adenocarcinoma of the pancreas and benign disease. J Steroid Biochem Mol Biol. 2017;174:290–295.
- Nha L, Sund M, Vinci A. Prognostic and predictive markers in pancreatic ade-nocarcinoma, Dig. Liver Dis. 2016. 48(3):223–230.