
ABSTRACT
In recent years, the beneficial effects of silibinin (SIL) on nonalcoholic fatty liver disease (NAFLD) have attracted widespread attention. We tried to study the intervention effect of SIL on NAFLD, and explore the potential mechanisms and targets of SIL on NAFLD improvement. Thirty-three male C57BL6/J mice were divided into three groups, and, respectively, fed a normal diet (ND), a high-fat diet (HFD) or a HFD given SIL treatment (HFD+SIL). Biochemical indexes and histopathological changes of mice in each group were detected. In addition, quantitative proteomics analysis based on tandem mass tag (TMT) labeling coupled with liquid chromatography-tandem mass spectrometry (LC-MS/MS) and bioinformatics analysis was performed on protein changes in the livers. SIL could reduce the weight of mice, reduce liver lipid deposition, and improve glucose metabolism. Through comparison among the three experimental groups, a total of 30 overlapping proteins were found. These identified proteins were closely linked to liver lipid metabolism and energy homeostasis. Moreover, some drug targets were found, namely perilipin-2, phosphatidate phosphatase LPIN1, farnesyl pyrophosphate synthase, and glutathione S-transferase A1. In conclusions, high-fat diet increases the expressions of proteins implicated in lipid synthesis and transport in the liver, which can result in disorders of liver lipid metabolism. SIL can decrease liver lipid deposition and increase insulin sensitivity by regulating the expressions of these proteins. It not only improves the disorder of lipid metabolism in vivo, but also improves the disorder of glucose metabolism.
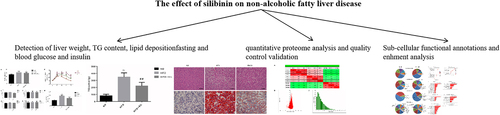
Graphical Abstract
Introduction
Nonalcoholic fatty liver disease (NAFLD) is characterized by liver cell steatosis and liver lipid deposition, and alcohol and other clear liver damage factors are excluded [Citation1]. With the improvement of living standards, changes in dietary structure and the wide application of imaging technologies such as ultrasound, the incidence and diagnosis rate of NAFLD is increasing. Now it has been the most common chronic liver disease [Citation2]. The cause of NAFLD is still not yet fully clear. As early as 1998, the classic ‘two-hit’ hypothesis was proposed [Citation3–5]. First of all, liver fat accumulation caused by hepatic steatosis, insulin resistance, and lipid metabolism disorders is the ‘first hit’ to NAFLD. On this basis, it may spontaneously trigger the ‘second hit’, such as oxidative stress and lipid peroxidation, which can aggravate continuous damage and inflammation of hepatocytes [Citation6]. In recent years, the ‘multiple-hits’ hypothesis has gradually become dominant, that is, in addition to the above mechanisms, it also includes dietary factors, adipokines, autophagy, epigenetics, and intestinal microbial disorders [Citation7].
Milk thistle (silybum marianum) is a natural herb that originated in Southern Europe and North Africa and has been utilized to treat liver diseases. The flavonoid compound silymarin extracted from the seeds of milk thistle has been confirmed to be its primary active component. Silymarin mainly includes silibinin (SIL), isosilybin, silydianin, and silychristin [Citation8]. Among them, SIL has the most content and the strongest biological activity, which is the object of our research. SIL, one of the most well-known and potent hepatoprotective flavonolignanes, improves all biochemical and pathological parameters, confirming its hepatoprotective and antioxidant potential [Citation9]. Increasing clinical studies have shown that SIL has a beneficial therapeutic effect in the application of NAFLD, which can significantly reduce liver enzyme indicators, such as the levels of alanine aminotransferase (ALT), aspartate aminotransferase (AST), and γ-glutamyl transpeptidase (γ-GT), and blood lipid indicators, such as the levels of plasma total cholesterol (TC), triglycerides (TG), and low-density lipoprotein (LDL) [Citation10–13]. At the same time, animal studies have also confirmed that SIL has the characteristics and advantages of multi-channel and comprehensive treatment for improving NAFLD. Experiments in rats confirmed that SIL can inhibit liver lipid deposition and increase fatty acid oxidation, thereby improving liver lipid metabolism [Citation14–18]. SIL can also effectively improve the insulin sensitivity of NAFLD rats, and its mechanism may be associated with the inhibition of gluconeogenesis [Citation18]. It is proved that SIL can improve NAFLD by promoting glucose metabolism. In addition, SIL has potent antioxidant activity [Citation19]. It can inhibit lipid peroxidation and eliminate free radical activity [Citation20,Citation21], which shows a positive pharmacological effect on improving the ‘second hit’ of NAFLD.
Previous study has demonstrated the role of long non-coding RNA, miRNA, and mRNA in NAFLD. It is noted that proteomics is attracting more and more attention [Citation22]. Proteomics is a science that explores the protein composition and changes of cells, tissues, and even organisms. In the past, tissue proteome analysis was first used to study the mechanisms of drugs treatment of diseases [Citation23,Citation24]. Thereafter, the surface-enhanced laser desorption/ionization (SELDI) protein-chip biomarker system was used to analyze serum proteomes of cancer patients to obtain tumor-specific proteins [Citation25]. Today, tandem mass tag (TMT) is a robust proteomics tool with higher specificity, selectivity, and sensitivity, and has been widely utilized in the field of quantitative proteomics [Citation26,Citation27]. TMT combined with liquid chromatography-tandem mass spectrometry (LC-MS/MS) approach can accurately quantify the proteins in multiple biological samples (up to 10-plex) at the same time, thereby discovering protein biomarkers of diseases [Citation28].
There is no valid therapy for preventing and treating NAFLD other than weight loss through diet control and reasonable exercise, and the recommended therapies are difficult to follow and maintain [Citation29]. Thus, it is urgent to develop better specifically targeted drugs for preventing and treating NAFLD. In addition, the beneficial effects of SIL on NAFLD have attracted widespread attention. In view of this, our study was to establish NAFLD mouse model by feeding C57BL6/J mice with the high-fat diet. The combination of TMT and LC-MS/MS was applied to study the potential mechanisms and targets of SIL on NAFLD improvement, which provides a potential mechanism and new ideas for SIL treatment of NAFLD.
Materials and methods
Animal treatment and sample collection
Thirty-three male C57BL6/J mice (7 weeks old) were purchased from Beijing Vital River Laboratory Animal Technology Co., Ltd. and housed in the barrier system of animal experiment in the Clinical Research Center of Hebei Provincial People”s Hospital. All mice were randomly divided into two groups: 11 mice in the control group (ND, normal diet, 70% of calories (kcal/g) from carbohydrate, 10% of calories (kcal/g) from fat and 20% of calories (kcal/g) from protein, total calories of 348 kcal/100 g), and 22 mice in the high fat group (HFD, 20% of calories (kcal/g) from carbohydrate, 60% of calories (kcal/g) from fat and 20% of calories (kcal/g) from protein, total calories of 524 kcal/100 g). The feed was purchased from Changzhou SYSE Bio-Tec Co., Ltd. Each group of mice was fed with equal calorie daily and ingested water freely. Fasting weight was measured weekly. Food intake was recorded daily. After 4 weeks, the HFD group was subdivided into the HFD group (n = 11) and the HFD+SIL group (n = 11). The HFD+SIL group was administered SIL intragastrically in liquid form at the dose rate of 54 mg/kg every day. According to the pharmacological test method, the adult (human) dose was converted to the mouse dose [Citation30]. The adult (human) dose was 1 mg/kg. The calculation formula of the mouse dose was as follows: 1 mg/kg × 70 kg (estimated adult weight) × 0.0026/0.2 kg = 9.1 mg/kg. The equivalent dose of mice calculated by BSA was 9.1 times that of humans. The adult dose of SIL was provided by Tasly Pharmaceutical Co. Ltd. ND and the HFD groups were intragastrically administered with the same volume of normal saline. After 4 weeks of drug intervention, the blood glucose values at each time point of 0, 15, 30, 60, and 120 min were measured by intraperitoneal glucose tolerance test (IPGTT) and the area under the glucose curve (AUC) was calculated.
The mice were fasted overnight, weighed, and anesthetized with 1% pentobarbital sodium (60 mg/kg). Blood was collected from the eyeball and centrifuged at 3000 × g for 20 minutes at 4°C. Serum was collected and stored at −80°C. After taking blood from the eyeball, the liver was quickly taken out to record the weight. Several pieces of liver tissue were taken and frozen and stored at −80°C for further analysis. All experiments were followed by the guidelines for the Care and Use of Laboratory Animals and approved by the Hebei General Hospital Ethics Committee (No. 202,032). All following methods were referred from previous study [Citation31].
IPGTT and AUC
The value of blood glucose was determined from the blood collected from tip of the tail used. After fasting for 12 h, the mice were injected intraperitoneally with 50% glucose at the rate of 2 g/kg. The values of fasting blood glucose were determined before the glucose administration. After injecting glucose, blood glucose values of the tail tip were detected at 15, 30, 60, and 120 min, and the AUC was calculated.
Hepatic tissue histology
Hepatic histopathological changes were observed by hematoxylin and eosin (H&E) and oil red O staining of liver tissue. Liver tissues were fixed in 4% neutral formaldehyde solution and sectioned after paraffin embedding for H&E staining. Liver tissues were frozen and sectioned (8 μm for each section). After air-drying for 30 minutes, the sections were fixed in 10% neutral formaldehyde for 10–15 minutes and washed. Photomicrographs were taken with a light microscope. In order to quantify lipid accumulation, oil red O was eluted with isopropanol, and the optical densities (OD) of the solutions at 520 nm were measured through the spectrophotometer.
Measurement of serum fasting insulin
Serum fasting insulin levels were determined by antibody sandwich ELISA according to the instructions provided by the mouse insulin ELISA kit (ALPCO, USA). We set standard wells and sample wells on the enzyme-labeled plate, and, respectively, added 5 μL of standard and 5 μL of samples to the bottom of the plate. 75 μL of enzyme-labeled antibody working solution was added to each well. The plate was covered with a sealer, and then the samples were incubated with shaking for 120 minutes at room temperature. We washed each well with 350 μL of wash solution and removed the remaining liquid from all wells. According to this wash process, the plate was repeatedly washed six times. 100 μL of chromogenic substrate solution was added to each well. The plate was covered with a sealer, and then the samples were incubated with shaking for 30 minutes at room temperature. 100 μL of stop solution was added to each well to stop the reaction. After removing any drop of water and fingerprint on the bottom of the plate, we immediately ran the microplate reader and conducted measurement at 450 nm. Finally, the standard curve was made according to the different concentrations of the standard, and the insulin level of the sample was calculated.
Measurement of liver triglyceride (TG)
Serum TG levels in mice were measured with a commercially available kit (Applygen Technologies Inc., Beijing, China) and performed with fully automatic blood biochemical analyzer (Sysmex Shanghai Ltd., Shanghai, China). In brief, 50 mg liver tissue was effectively homogenized in 1 mL lysis buffer to extract lipids. After standing for 10 minutes, the appropriate amount of supernatant was transferred to a 1.5 mL centrifuge tube and centrifuged at room temperature. The obtained supernatant could be used for content measurement of liver TG. A BCA protein assay kit (Applygen Technologies Inc., Beijing, China) was used to determine the protein concentration.
Protein digestion and peptide TMT labeling
The liver tissue was taken out from −80°C. An appropriate amount of tissue samples (about 55 mg) was weighed into a mortar pre-cooled with liquid nitrogen. The liver tissues of mice were grinded with liquid nitrogen, added with lysis buffer (8 M of urea, 1% of protease inhibitor and 2 mm of EDTA), treated with a high intensity ultrasonic processor, and centrifuged. After quantification of the extracted protein samples, 500 μg of protein was taken from each sample for trypsin digestion. The protein sample was then diluted to urea concentration less than 2 mol/L. Trypsin was added at 1:50 trypsin-to-protein mass ratio for overnight digestion, and 1:100 trypsin-to-protein mass ratio for 4 h-digestion. The peptide was labeled with TMT kit. This project used 10 plex TMT labeling reagent.
LC-MS/MS analysis
The tryptic peptides were dissolved in solvent A containing 0.1% of formic acid and 2% of acetonitrile. They were subjected to HPLC fractionation using the Agilent 300Extend C18 column. Briefly, peptides were separated and combined into nine fractions, and the combined fractions were separated on an EASY-nLC 1200 UPLC system (Thermo Fisher Scientific Inc., USA). Solvent B contained 0.1% formic acid and 90% acetonitrile. Liquid phase gradient setting: 0 ~ 38 min, 8%–23% of B; 38 ~ 52 min, 23% −35% of B; 52 ~ 56 min, 35% −80% of B; 56 ~ 60 min, 80% of B. The flow rate was maintained at 450 nL/min.
MS/MS of peptides were performed using Q ExactiveTM HF-X (Thermo Fisher Scientific Inc., USA). The parameters were set as follows: the ion source voltage was 2.0 kV; the first-stage mass spectrometry scan range was 350–1600 m/z and the scan resolution was 120,000; the second-stage mass spectrometry scan range was fixed at 100 m/z and the scan resolution was 30,000; all scans were detected and analyzed in the Orbitrap (Thermo Fisher Scientific Inc., USA); the automatic gain control (AGC) was 1E5; the signal threshold was 83,000 ions/s; the maximum injection time was 60 ms; the dynamic exclusion time was 30s.
Database search
Mass spectral data were extracted through Maxquant version 1.5.2.8. Tandem mass spectra were searched against the SwissProt Mouse database. Cleavage enzyme was set with Trypsin/P. The mass tolerance for precursor ions was set as 20 ppm in the first search and 5 ppm in Main search, and the mass tolerance for fragment ions was set as 0.02 Da.
Subcellular localization
The proteins in eukaryotic cells are classified according to differences in the membrane structure to which they bind. Wolfpsort is the prediction software for subcellular localization.
GO annotation
Gene Ontology (GO) annotation was obtained from the UniProt-GOA database and differential proteins were classified by GO annotation into three categories: biological process, cellular compartment, and molecular function.
Kyoto Encyclopedia of Genes and Genomes (KEGG) enrichment analysis
Protein pathway annotation was obtained from the KEGG database and all pathways were classified according to the KEGG website. A two-tailed Fisher’s exact test was used to analyze the enrichment of differentially expressed proteins.
Western blotting
Protein expression levels of perilipin-2 (PLIN2), phosphatidate phosphatase (LPIN1), farnesyl pyrophosphate synthase (FDPS), and glutathione S-transferase A1 (GSTA1) in mice liver tissue were detected by Western blotting. Briefly, the protein was extracted from 100 mg liver tissue samples and quantified through the BCA Protein Concentration Determination Kit. The configured 10% of SDS-PAGE gel was used for electrophoretic separation of the protein. The gel (containing the protein of interest obtained after electrophoresis) was transferred to polyvinylidene difluoride (PVDF) membrane, and then blocked with 5% of TBST nonfat dry milk at room temperature for 2–4 h. The membrane was sequentially incubated with the primary antibody (Wuhan Sewell Biological Technology Co., LTD) at 4°C overnight and with horseradish peroxidase-conjugated goat anti-rabbit IgG (Wuhan Sewell Biological Technology Co., LTD) at room temperature for 1.5 h. The protein band was detected using Enhanced ChemoLuminescence (ECL) and visualized on autoradiography films. ImageJ was utilized to analyze the results and read the band gray value. The normalization process was performed by dividing the gray value of the target protein by the gray value of the internal parameter. Each lane represents a single mouse. Densitometry data are presented as mean ±standard deviation (SD). Three biological replicas were performed in each experiment.
Statistical analysis
All data were analyzed using SPSS 21.0 software and GraphPad Prism 5.0 software. The experimental data were described by the mean ± SD. One-way analysis of variance and Bonferroni test was used to analyze the differences among multiple comparison groups. A P < 0.05 was considered statistically significant.
Results
Herein, biochemical indexes and histopathological changes of mice in each group were detected. In addition, quantitative proteomics analysis based on TMT labeling coupled with LC-MS/MS and bioinformatics analysis was performed on protein changes in the livers.
Comparison of body weight, liver weight, food intake, fasting blood glucose and fasting insulin
The body weight of mice in the HFD group was higher than that in the ND group (P < 0.05). The body weight of the HFD+SIL group was significantly lower than that in the HFD group (P < 0.05) (). There were no significant difference in liver weight, average daily caloric intake, fasting blood glucose and fasting insulin among the three groups ().
Figure 1. Comparison of body weight (a), liver weight (b), food intake (c), fasting blood glucose (d), fasting insulin (e), IPGTT (f) and AUC (g) of mice in each group.
Comparison of IPGTT and AUC
The levels of blood glucose in the HFD group at 15, 30, 60, and 120 min were significantly higher than those in the ND group. The AUC was significantly increased (P < 0.05). The blood glucose levels in the HFD+SIL group at 15, 30, 60, and 120 min were significantly lower than those in the HFD group. The AUC was significantly reduced (P < 0.05) ().
Comparison of liver TG content in mice of each group
The liver TG content was significantly increased in the HFD group compared with the ND group (P < 0.01). The liver TG content in the HFD+SIL group was reduced significantly in comparison with that in the HFD group (P < 0.01) ().
Figure 2. Comparison of liver TG content in mice of each group (a) and the effects of SIL on liver lipid deposition in HFD mice by H&E and oil red O staining (×400) (b).
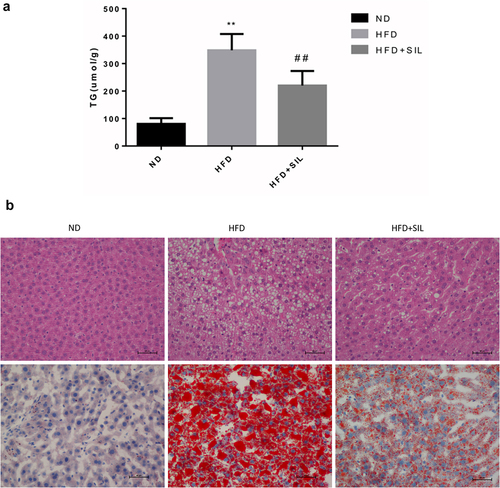
Effects of SIL on liver lipid deposition in HFD mice
Firstly, H&E staining was performed. The liver tissue structure in the ND group was intact, the hepatocytes were neatly arranged, the hepatic lobules were regular, the cytoplasm was uniform, and no obvious inflammatory cells and steatosis were observed. In the HFD group, the hepatic lobule structure was disordered, the hepatocytes were swollen, a large number of lipid droplets and vacuoles were observed in the cytoplasm of the hepatocytes, and the balloon-like changes were obvious. There were huge numbers of inflammatory cells infiltration in the portal area and lobules. In the HFD+SIL group, the inflammatory cells infiltration of hepatocytes was reduced, and the degree of steatosis was significantly reduced (). Secondly, oil red O staining was carried out. No significant lipid droplets were found in the ND group. Large numbers of lipid droplets and a significant decrease in lipid droplets was found in the HFD group and the HFD+SIL group, respectively ().
Identification and quantitative analysis of protein based on TMT
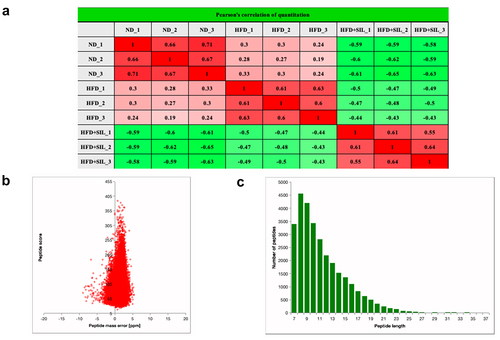
Quantitative proteomics analysis based on TMT was utilized to explore protein changes in mice liver tissue among the ND group, HFD group and HFD+SIL group. The quantitative repeatability of the experimental protein was evaluated by Pearson’s correlation coefficient statistical analysis method (). Totally, 324,969 secondary spectra were obtained by mass spectrometry. The available effective spectrum number was 53,238. 29,758 peptides (28,765 unique peptides) and 4,565 proteins (4,198 quantified proteins) were identified by spectral analysis (). Most of the spectra had a first-order mass error of less than 10 ppm, indicating that the mass spectrometer’s mass accuracy is normal (). Most of the peptides were distributed between 7 and 20 amino acids (), indicating that our samples conform to the general rule.
Table 1. Summary of MS/MS spectrum database search analysis
Figure 3. Experimental strategies for quantitative proteome analysis and quality control validation. (a) Pair wise Pearson’s correlation coefficients; (b) Average peptide mass error; (c) Length distribution of all identified peptides.
Identification of differentially expressed proteins (DEPs)
When P < 0.05, those proteins with a > 1.2-fold or <1/1.2-fold change in expression between HFD and ND, HFD+SIL, and HFD were called DEPs. Based on the above screening criteria, we analyzed the protein expressions of the three comparison groups. In the HFD/ND group, there were 215 DEPs (98 up-regulated and 117 down-regulated proteins). In the HFD+SIL/HFD group, there were 121 DEPs (97 up-regulated and 24 down-regulated proteins). We found that 30 significantly dysregulated proteins were overlapped among the three comparison groups (). All DEPs were annotated and functionally classified by sub-cellular localizations, GO terms, KEGG pathways, and other data.
Table 2. List of proteins involved in sugar and lipid metabolism with at least 1.2-fold altered expression due to HFD and/or HFD+SIL
Sub-cellular localization classification and Gene Ontology (GO) category of DEPs
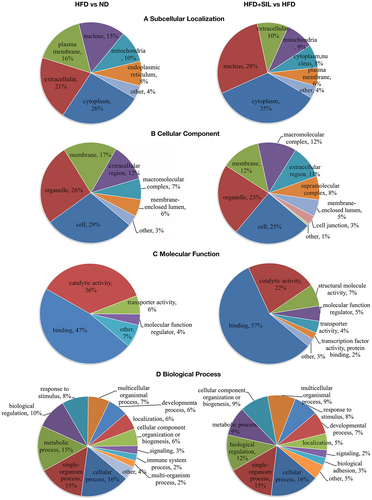
In order to analyze the final selected DEPs and determine their distribution and functions in the HFD versus ND comparison group and the HFD+SIL versus HFD comparison group, sub-cellular localization, and GO category (second level) were performed (). Sub-cellular localization showed that, both in the HFD versus ND comparison group and in the HFD+SIL versus HFD comparison group, the DEPs were mainly located in the cytoplasm, extracellular, nucleus, plasma membrane, and mitochondria (). Cell component (CC) analysis showed that, both in the HFD versus ND comparison group and in the HFD+SIL versus HFD comparison group, the DEPs were mainly distributed in organelles, and secondly distributed in membrane, extracellular regions, and macromolecular complexes (). Molecular function (MF) analysis showed that, both in the HFD versus ND comparison group and in the HFD+SIL versus HFD comparison group, the DEPs mainly had binding and catalytic functions (). Biological process (BP) analysis showed that, both in the HFD versus ND comparison group and in the HFD+SIL versus HFD comparison group, the DEPs mainly participated in the same processes, including cellular process, single-organism process, metabolic process, and biological regulation ().
Figure 4. Sub-cellular functional annotations and GO analysis of identified proteins. (a) Sub-cellular localization of identified proteins; (b) GO annotation in terms of cellular component; (c) GO annotation in terms of molecular function; (d) GO annotation in terms of biological process.
KEGG enrichment analysis of DEPs
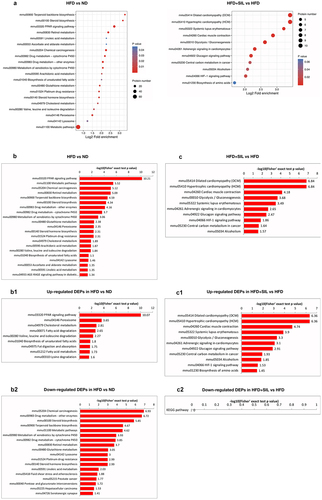
First, the significant enriched KEGG pathway of differential proteins (P < 0.05) was presented by bubble plot that showed the results of the top 20 classifications (). We mapped the DEPs information to the KEGG database to obtain its enriched pathway, and at the same time made an intuitive statistical graph based on the statistical significance of the enrichment. B and C showed significant rankings of KEGG pathway enrichment of DEPs between the groups. In HFD versus ND, DEPs were abundantly enriched in ‘PPAR signaling pathway’, ‘metabolic pathways’, ‘chemical carcinogenesis’, ‘retinol metabolism’, ‘terpenoid backbone biosynthesis’, ‘steroid biosynthesis’, ‘drug metabolism-other enzymes’, ‘drug metabolism-cytochrome P450’, ‘metabolism of xenobiotics by cytochrome P450’, ‘glutathione metabolism’, and ‘peroxisome’ (). In HFD+SIL versus HFD, DEPs were abundantly enriched in ‘dilated cardiomyopathy (DCM)’, ‘hypertrophic cardiomyopathy (HCM)’, ‘cardiac muscle contraction’, ‘glycolysis/gluconeogenesis’, ‘systemic lupus erythematosus’, ‘adrenergic signaling in cardiomyocytes’, ‘glucagon signaling pathway’, ‘HIF-1 signaling pathway’, ‘central carbon metabolism in cancer’ and ‘alcoholism’ (). These DEPs were mostly concentrated in lipid metabolism and energy homeostasis.
Figure 5. KEGG enrichment analysis of DEPs. (a) KEGG pathway enrichment; (b) Significance rankings of KEGG pathway enrichment in HFD versus ND; The pathway of up-regulated DEPs in HFD versus ND; The pathway of down-regulated DEPs in HFD versus ND; (c) Significance rankings of KEGG pathway enrichment in HFD+SIL versus HFD; The pathway of up-regulated DEPs in HFD+SIL versus HFD; The pathway of down-regulated DEPs in HFD+SIL versus HFD.
Protein validation
In order to verify the expressions of differential proteins in proteomics analysis, Western blotting was performed (). Results showed that expressions of PLIN2 (P < 0.05) and LPIN1 (P < 0.01) were significantly increased in the HFD group, while the expression of FDPS was significantly decreased (P < 0.01). After SIL treatment, the expression of these proteins was reversed (P < 0.05). The expression of GSTA1 (P < 0.05) was significantly decreased in the HFD group. The expression of GSTA1 was not significantly different between the HFD+SIL group and the HFD group (P > 0.05). The above results were basically consistent with the consequences of proteomics analysis, indicating the reliability of the proteomics analysis.
Figure 6. The relative protein expression of PLIN2, LPIN1, FDPS and GSTA1 in liver. *P < 0.05 and **P < 0.01 vs ND, #P < 0.05 and ##P < 0.01 vs HFD.
Discussion
Previous animal experiments have shown that SIL can improve fatty liver (induced by high-fat diet) by regulating liver glucose metabolism [Citation14,Citation18,Citation31]. In addition, it can also improve liver lipid metabolism by inhibiting liver lipid deposition and increasing fatty acid oxidation [Citation14,Citation15,Citation18]. In our study, we successfully established a high-fat diet-induced NAFLD mice model. These high-fat diet mice represented a state of excess energy, which can result in obesity, liver steatosis, and impaired glucose tolerance. The results of our experiment indicated that SIL can inhibit diet-induced weight gain without affecting food intake, reduce liver lipid deposition, and regulate glucose metabolism, which was in line with the results of previous studies. This indicated that SIL played important roles in suppressing the ‘first hit’ of NAFLD.
In the liver tissues of ND-fed mice or HFD-fed mice with or without SIL treatment, we identified 30 overlapping DEPs by using quantitative proteomics, which were either up-regulated or down-regulated. The results of enrichment analysis found that these DEPs were closely related to lipid metabolism and energy homeostasis. In this study, four of the 30 overlapping proteins identified for detailed discussion, including PLIN2, LPIN1, FDPS, and GSTA1 ().
In our current study, we found that HFD up-regulated the expressions of PLIN2 and LPIN1 in the liver, and this phenomenon was reversed after SIL treatment. PLIN2, a lipid droplet protein, is predominantly expressed in the liver and regulates the storage and hydrolysis of neutral lipids (TG and cholesterol esters) [Citation32,Citation33]. Intrahepatic lipid droplets play essential roles in maintaining cellular lipid homeostasis and are the histological basis for judging liver steatosis [Citation34,Citation35]. Published studies on cultured cells and NAFLD animal models have proved that PLIN2 has effects on both lipid and glucose homeostasis [Citation36–41]. Increased expression of PLIN2 in the liver can lead to hepatic steatosis and glucose intolerance, and specific knockout of PLIN2 in the liver can reduce hepatic steatosis under high-fat diet feeding and improve systemic IR. Hepatic steatosis is caused by disorders of de novo fat lipogenesis, fatty acid and oxidation, and triglyceride lipolysis [Citation42–44]. PLIN2 is closely linked to TG lipolysis. After PLIN2 is down-regulated, on the one hand, it is difficult to have sufficient lipid droplet-related proteins in the liver to assist TG to form lipid droplets and store them in cells. On the other hand, lipid droplets may be more easily exposed to TG hydrolase, making TG easier to hydrolyze. SIL can regulate TG lipolysis and glucose homeostasis in HFD mice. Our results were consistent with previous studies, suggesting that PLIN2 may be a potential target for the treatment of NAFLD.
LPIN1 is a protein that can bidirectionally regulate lipid metabolism. In the cytoplasm, it is a phosphatidic acid phosphatase (PAP) to regulate the synthesis of TG [Citation45]. In the nucleus, it is transcriptional co-activator in association with hepatic PPAR γ coactivator-1α (PGC-1α) and PPAR α to regulate the expression of fatty acid oxidation genes [Citation46]. In the liver of diet-induced obesity and insulin-resistant mice, the expression of LPIN1 is increased, which is related to the activation of its transcription by TORC2 [Citation47]. TORC2 has been certificated to regulate the transcription of hepatic gluconeogenesis genes [Citation48]. Adenovirus-mediated knockdown of LPIN1 expression in the liver of db/db mice can not only reduce liver TG levels to regulate lipid metabolism, but also reduce the expression of key gluconeogenesis genes and the phosphorylation level of PKC3 to regulate glucose metabolism. Our results were consistent with the above study. In the liver of HFD group mice, the expression of LPIN1 was increased. After SIL treatment, LPIN1 was up-regulated in the liver. On the contrary, another study found that the expression of LPIN1 in the liver of UCP-DTA mice that showed insulin resistance was decreased, while adenovirus-mediated over expression of LPIN1 in the liver of UCP-DTA mice decreased liver TG levels and increased liver insulin sensitivity [Citation45]. In order to further study, the functional differences caused by liver LPIN1, Kajimoto et al. treated male C57BL/6 J mice with siLpin1 to specifically silence the expression of LPIN1 in the liver, which can prevent LPIN1 over expression or gene knockout from having secondary effects on other tissues [Citation49]. It was found that the silencing of LPIN1 in the liver of mice reduced body weight, decreased liver TG levels, and decreased expressions of Mogat1 and Srebf1 that regulated glucose and lipid metabolism, but could not increase the insulin sensitivity of the mice. Therefore, LPIN1 protein has a major enzyme function in regulating liver lipid metabolism and energy homeostasis. However, the role of LPIN1 in glucose metabolism and insulin resistance is still controversial and needs further study.
KEGG enrichment analysis found that in HFD versus ND, proteins were abundantly enriched in the pathways of ‘drug metabolism-cytochrome P450’ and ‘metabolism of xenobiotics by cytochrome P450’. It has been proved that NAFLD can induce the expression of cytochrome P450 to consume large amounts of oxygen, thereby destroying the oxygen homeostasis in the liver [Citation50]. Hypoxia enhances liver lipid accumulation and liver inflammation by inhibiting the activity of the mitochondrial respiratory chain, which in turn aggravates NAFLD [Citation51,Citation52]. Therefore, liver hypoxia is both the cause and the consequence of NAFLD, thus forming a vicious circle. Under hypoxic conditions, the liver activates the expression of hypoxia-inducible factor-1 (HIF-1). HIF-1 is responsible for activating genes related to glycolysis, regulating the expression of lactate dehydrogenase, glycolytic enzymes, and other related enzymes [Citation53]. In addition, HIF-1 also directly regulates the LPIN 1 gene. It enhances the PAP activity of LPIN1 to stimulate liver TG accumulation, which is one of the main changes to adapt to hypoxia. In contrast, HIF-1 inhibitors can down-regulate the expression of LPIN1 to prevent hypoxia-induced TG synthesis [Citation54]. Our results also found that in HFD+SIL versus HFD, the enriched pathways of DEPs were closely related to ‘glycolysis’ and ‘HIF-1 signaling pathway’. It may suggest that SIL can inhibit HIF-1 to down-regulate hypoxia-induced LPIN1 expression and reduce LPIN1-dependent TG deposition.
Our results also showed that the expression of liver FDPS was remarkably down-regulated in the HFD group of mice, but this could be reversed by SIL treatment. FDPS, one of the key enzymes in the mevalonate pathway, catalyzes the synthesis of farnesyl pyrophosphate (FPP). First, it is found that FPP can effectively inhibit liver TG accumulation, indicating that the mevalonate pathway may be associated with the regulation of liver lipid metabolism [Citation55]. Then, the molecular mechanism of FPP action was studied. On the one hand, FPP promoted the farnesylation of LKB1 (liver kinase B1), thereby activating the LKB1/AMPK (AMP-activated protein kinase) signaling pathway and inhibiting fatty acid synthesis [Citation56]. On the other hand, FPP activated the FXR (farnesoid × receptor)/SHP (supramolecular hyperbranched polymer) signaling pathway, thereby inhibiting the activation of SREBP-1 and de novo lipogenesis (DNL) [Citation57]. The level of FPP plays important roles in regulating lipid metabolism in the liver. If the level of FPP can be targeted to increase, this is of great significance for the treatment of NAFLD. According to our study results, it was speculated that SIL used FDPS as a target to regulate the content of FPP in vivo, thereby effectively reducing liver lipid deposition. Of course, much further deeper analysis of the hypothesis is further needed.
Glutathione-S-transferases (GSTs) are a group of enzymes with antioxidant and detoxifying functions and mainly present in the liver [Citation58]. GSTs catalyze the detoxification of electrophilic xenobiotics and inactivate a variety of endogenous oxidation by-products, which play a vital role in the antioxidant defense mechanism [Citation59,Citation60]. GSTA1, a member of the GSTs gene family, catalyzes the reduction of lipid peroxides [Citation61,Citation62]. Our proteomics results found that compared with ND mice, the expression of GSTA1 in the liver tissue of HFD mice was significantly reduced, resulting in decreased liver antioxidant capacity and disordered lipid metabolism. The expression of GSTA1 was also down-regulated after the administration of SIL in mice. However, compared with HFD versus ND, the expression of GSTA1 in HFD+SIL versus HFD was reduced to a smaller extent. At the same time, the result of Western blotting indicated that the down-regulation was not statistically significant. The reason for this phenomenon may be that chronic oxidative stress induced by a high-fat diet plays essential roles in the formation and progression of NAFLD, causing sustained liver damage in mice. Secondly, insufficient drug intervention time, dosage, and utilization may cause SIL not to reverse the down-regulation of GSTA1 expression by HFD in this experiment. Therefore, it cannot be ruled out SIL may still have a certain antioxidant effect. SIL regulates the JNK signaling pathway to improve liver oxidative stress [Citation63]. In addition, the expression of GSTA1 was involved in the JNK signaling pathway. When the JNK signaling pathway was activated, the expression of GSTA1 was decreased. After blocking the JNK signaling pathway, the expression of GSTA1 was increased, reducing the degree of liver damage [Citation64]. We speculate that SIL may affect oxidative stress through GSTA1. In the further study, much further deeper analysis of the hypothesis is needed.
Notably, KEGG enrichment analysis found that DEPs were associated with ‘dilated cardiomyopathy (DCM)’, ‘hypertrophic cardiomyo-pathy (HCM)’ and ‘cardiac muscle contraction’. Certain studies on obese animal models have revealed that a high-fat diet could cause excessive fat tissue in the body, and too much fat will not only be deposited ectopically in the liver, but also ectopically deposited in the heart [Citation65,Citation66]. As obesity increases, changes in myocardial structure and function occur. Some studies defined it as obese cardiomyopathy, which was related to obesity but not related to known diseases such as hypertension and coronary heart disease, as obese cardiomyopathy [Citation67,Citation68]. Its pathogenesis was mainly associated with insulin resistance, lipid damage, inflammation, impaired endothelial function, and changes in cardiac hemodynamics [Citation69,Citation70]. By exerting its antioxidant activity, SIL has a preventive and protective effect on atherosclerosis and cardiotoxicity caused by oxidative stress [Citation71]. In this study, the proteomics expression profile also identified some proteins associated with cardiovascular disease, including MYBPC, MYL, TPM, and MYH. We speculate that SIL may protect the heart by regulating the expression of these proteins. Further, much deeper analysis of the hypothesis is needed.
However, there are limitations to our study. Firstly, various obese mouse models are further needed to determine the effectiveness of SIL. Secondly, it is needed to screen for any changes in serum insulting levels, cytokine/cytokine/inflammatory profile to better elucidate the mechanism of SIL in vivo. Thirdly, exploration of SIL in prevent/cure NAFLD in the obese person is an interesting study in the further research. Fourthly, further deeper analysis that SIL used FDPS as a target to regulate the content of FPP in vivo (effectively reducing liver lipid deposition), SIL affects oxidative stress through GSTA1 and SIL protects the heart by regulating the expression of some proteins is further needed.
Conclusion
SIL can inhibit or even reverse lipid synthesis by down-regulating expressions of PLIN2 and LPIN1 and up-regulating the expression of FDPS. The level of GSTA1 in the liver was still down-regulated after SIL treatment, indicating that SIL can attenuate HFD-induced oxidative stress to a certain extent. Techniques of TMT labeling coupled with LC-MS/MS analysis confirmed the beneficial effects of SIL on NAFLD, including reducing liver lipid deposition, improving lipid and glucose metabolism, and mitigating oxidative stress. Proteins (PLIN2, LPIN1, FDPS, and GSTA1) related to these protective effects may become drug targets for SIL to treat NAFLD.
Disclosure statement
No potential conflict of interest was reported by the author(s).
Data availability statement
All data are available in the article.
Additional information
Funding
References
- Leamy AK, Egnatchik RA, Young JD. Molecular mechanisms and the role of saturated fatty acids in the progression of non-alcoholic fatty liver disease. Prog Lipid Res. 2013;52:165–174.
- Yu Y, Cai J, She Z, et al. Insights into the Epidemiology, Pathogenesis, and Therapeutics of Nonalcoholic Fatty Liver Diseases. Adv Sci (Weinheim, Baden-Wurttemberg, Germany). 2019;6(4):1801585.
- Gentile CL, Pagliassotti MJ. The role of fatty acids in the development and progression of nonalcoholic fatty liver disease. J Nutr Biochem. 2008;19(9):567–576.
- Utzschneider KM, Kahn SE. Review: the role of insulin resistance in nonalcoholic fatty liver disease. J Clin Endocrinol Metab. 2006;91(12):4753–4761.
- Day CP, James OFW. Steatohepatitis: a tale of two “hits”? Gastroenterology. 1998;114(4):842–845.
- Browning JD, Horton JD. Molecular mediators of hepatic steatosis and liver injury. J Clin Invest. 2004;114(2):147–152.
- Arab JP, Arrese M, Trauner M. Recent Insights into the Pathogenesis of nonalcoholic fatty liver disease. Annual Review of Pathology: Mechanisms of Disease. 2018;13(1):321–350.
- Tittel G, Wagner H. Hochleistungsflüssigchromatographische trennung von silymarinen und deren bestimmung im rohextrakt von silybum marianum gaertn. Journal of Chromatography A. 1977;135(2):499–501.
- Raghu R, Karthikeyan S. Zidovudine and isoniazid induced liver toxicity and oxidative stress: evaluation of mitigating properties of silibinin. Environ Toxicol Pharmacol. 2016;46:217–226.
- Stiuso P, Scognamiglio I, Murolo M, et al. Serum oxidative stress markers and lipidomic profile to detect NASH patients responsive to an antioxidant treatment: a pilot study. Oxid Med Cell Longev. 2014;2014:169216.
- Loguercio C, Andreone P, Brisc C, et al. Silybin combined with phosphatidylcholine and vitamin E in patients with nonalcoholic fatty liver disease: a randomized controlled trial. Free Radic Biol Med. 2012;52:1658–1665.
- Federico A, Trappoliere M, Tuccillo C, et al. A new silybin-vitamin E-phospholipid complex improves insulin resistance and liver damage in patients with non-alcoholic fatty liver disease: preliminary observations. Gut. 2006;55:901–902.
- Huseini HF, Larijani B, Heshmat R, et al. The efficacy of Silybum marianum (L.) Gaertn. (silymarin) in the treatment of type II diabetes: a randomized, double-blind, placebo-controlled, clinical trial. Phytother Res. 2006;20:1036–1039.
- Alsaggar M, Bdour S, Ababneh Q, et al. Silibinin attenuates adipose tissue inflammation and reverses obesity and its complications in diet-induced obesity model in mice. BMC Pharmacol Toxicol. 2020;21:8.
- Cui CX, Deng JN, Yan L, et al. Silibinin Capsules improves high fat diet-induced nonalcoholic fatty liver disease in hamsters through modifying hepatic de novo lipogenesis and fatty acid oxidation. J Ethnopharmacol. 2017;208:24–35.
- Grattagliano I, et al. A silybin-phospholipids complex counteracts rat fatty liver degeneration and mitochondrial oxidative changes. World J Gastroenterol. 2013;19(20):3007–3017.
- Haddad Y, Vallerand D, Brault A, et al. Antioxidant and hepatoprotective effects of silibinin in a rat model of nonalcoholic steatohepatitis. Evid Based Complement Alternat Med. 2011;2011: nep164.
- Yao J, Zhi M, Gao X, et al. Effect and the probable mechanisms of silibinin in regulating insulin resistance in the liver of rats with non-alcoholic fatty liver. Braz J Med Biol Res = Rev Bras Pesqui Med Biol. 2013;46(3):270–277.
- Loguercio C. Silybin and the liver: from basic research to clinical practice. World J Gastroenterol. 2011;17(18):2288–2301.
- Salamone F, Galvano F, Cappello F, et al. Silibinin modulates lipid homeostasis and inhibits nuclear factor kappa B activation in experimental nonalcoholic steatohepatitis. Transl Res. 2012;159(6):477–486.
- Yao J, Zhi M, Minhu C. Effect of silybin on high-fat-induced fatty liver in rats. Braz J Med Biol Res = Rev Bras Pesqui Med Biol. 2011;44(7):652–659.
- Chen X, Ma H, Gao Y, et al. Long non-coding RNA AC012668 suppresses non-alcoholic fatty liver disease by competing for microRNA miR-380-5p with lipoprotein-related protein LRP2. Bioengineered. 2021;12(1):6738–6747.
- Anderson NL, Esquer-Blasco R, Richardson F, et al. The effects of peroxisome proliferators on protein abundances in mouse liver. Toxicol Appl Pharmacol. 1996;137(1):75–89.
- Arce A, Aicher L, Wahl D, et al. Changes in the liver protein pattern of female Wistar rats treated with the hypoglycemic agent SDZ PGU 693. Life Sci. 1998;63(25):2243–2250.
- Poon TCW, Yip -T-T, Chan ATC, et al. Comprehensive proteomic profiling identifies serum proteomic signatures for detection of hepatocellular carcinoma and its subtypes. Clin Chem. 2003;49(5):752–760.
- Cheng Y, Hou T, Ping J, et al. Quantitative succinylome analysis in the liver of non-alcoholic fatty liver disease rat model. Proteome Sci. 2016;14(1):3.
- Guo H, Guo H, and Zhang L, et al. Dynamic TMT-based quantitative proteomics analysis of critical initiation process of totipotency during cotton somatic embryogenesis transdifferentiation. Int J Mol Sci. 2019;20(7): 1691.
- Erdjument-Bromage H, Huang FK, Neubert TA. Sample Preparation for Relative Quantitation of Proteins Using Tandem Mass Tags (TMT) and Mass Spectrometry (MS). Methods Mol Biol. 2018;1741:135–149.
- Zou B, Ge -Z-Z, Zhang Y, et al. Persimmon tannin accounts for hypolipidemic effects of persimmon through activating of AMPK and suppressing NF-κB activation and inflammatory responses in high-fat diet rats. Food Funct 2014;5(7):1536–1546.
- Nair A, Morsy MA, Jacob S. Dose translation between laboratory animals and human in preclinical and clinical phases of drug development. Drug Development Research. 2018;79(8):373–382.
- Wang F, Chen S, Ren L, et al. The effect of silibinin on protein expression profile in white adipose tissue of obese mice. Front Pharmacol. 2020;11:55.
- Greenberg AS, Coleman RA, Kraemer FB, et al. The role of lipid droplets in metabolic disease in rodents and humans. J Clin Invest. 2011;121(6):2102–2110.
- Brasaemle DL. Thematic review series: adipocyte biology. The perilipin family of structural lipid droplet proteins: stabilization of lipid droplets and control of lipolysis. J Lipid Res. 2007;48(12):2547–2559.
- Brasaemle DL, Wolins NE. Packaging of fat: an evolving model of lipid droplet assembly and expansion. J Biol Chem. 2012;287(4):2273–2279.
- Gross DA, Zhan C, Silver DL. Direct binding of triglyceride to fat storage-inducing transmembrane proteins 1 and 2 is important for lipid droplet formation. Proc Natl Acad Sci U S A. 2011;108(49):19581–19586.
- Carr RM, Peralta G, Yin X, et al. Absence of perilipin 2 prevents hepatic steatosis, glucose intolerance and ceramide accumulation in alcohol-fed mice. PLoS One. 2014;9(5):e97118.
- Varela GM, Antwi DA, Dhir R, et al. Inhibition of ADRP prevents diet-induced insulin resistance. American Journal of Physiology-Gastrointestinal and Liver Physiology. 2008;295(3):G621–8.
- Dalen KT, Ulven SM, Arntsen BM, et al. PPARα activators and fasting induce the expression of adipose differentiation-related protein in liver. J Lipid Res. 2006;47(5):931–943.
- Imai Y, Boyle S, Varela GM, et al. Effects of perilipin 2 antisense oligonucleotide treatment on hepatic lipid metabolism and gene expression. Physiol Genomics. 2012;44(22):1125–1131.
- Chang BH-J, Li L, Paul A, et al. Protection against fatty liver but normal adipogenesis in mice lacking adipose differentiation-related protein. Mol Cell Biol. 2006;26(3):1063–1076.
- Imai Y, Varela GM, Jackson MB, et al. Reduction of hepatosteatosis and lipid levels by an adipose differentiation-related protein antisense oligonucleotide. Gastroenterology. 2007;132(5):1947–1954.
- Ishii K-A, Takamura T. [Non-alcoholic fatty liver disease (NAFLD) /non-alcoholic steatohepatitis (NASH) and nutrition]. Clin Calcium. 2016;26(3):363–367. CliCa1603363367.
- Ress C. Mechanisms of intrahepatic triglyceride accumulation. World J Gastroenterol. 2016;22(4):1664–1673.
- Kohjima M, Enjoji M, Higuchi N, et al. Re-evaluation of fatty acid metabolism-related gene expression in nonalcoholic fatty liver disease. Int J Mol Med. 2007;20(3):351–358.
- Chen Z, Gropler MC, Norris J, et al. Alterations in Hepatic metabolism in fld mice reveal a role for lipin 1 in regulating VLDL-triacylglyceride secretion. Arterioscler Thromb Vasc Biol. 2008;28(10):1738–1744.
- Finck BN, Gropler MC, Chen Z, et al. Lipin 1 is an inducible amplifier of the hepatic PGC-1α/PPARα regulatory pathway. Cell Metab. 2006;4(3):199–210.
- Ryu D, Oh K-J, Jo H-Y, et al. TORC2 regulates hepatic insulin signaling via a mammalian phosphatidic acid phosphatase, LIPIN1. Cell Metab. 2009;9(3):240–251.
- Koo S-H, Satoh H, Herzig S, et al. PGC-1 promotes insulin resistance in liver through PPAR-α-dependent induction of TRB-3. Nat Med. 2004;10(5):530–534.
- Kajimoto K, Suemitsu E, Sato Y, et al. Liver-Specific Silencing of Lipin1 Reduces Fat Mass as Well as Hepatic Triglyceride Biosynthesis in Mice. Biol Pharm Bull. 2016;39(10):1653–1661.
- Leung T-M, Nieto N. CYP2E1 and oxidant stress in alcoholic and non-alcoholic fatty liver disease. J Hepatol. 2013;58(2):395–398.
- Mantena SK, Vaughn DP, Andringa KK, et al. High fat diet induces dysregulation of hepatic oxygen gradients and mitochondrial function in vivo. Biochem J. 2009;417(1):183–193.
- Drager LF, Li J, Reinke C, et al. Intermittent hypoxia exacerbates metabolic effects of diet-induced obesity. Obesity (Silver Spring,MD). 2011;19(11):2167–2174.
- Majmundar AJ, Wong WJ, Simon MC. Hypoxia-inducible factors and the response to hypoxic stress. Mol Cell. 2010;40(2):294–309.
- Mylonis I, Sembongi H, Befani C, et al. Hypoxia causes triglyceride accumulation by HIF-1-mediated stimulation of lipin 1 expression. J Cell Sci. 2012;125(Pt 14):3485–3493.
- Nishimoto T, Amano Y, Tozawa R, et al. Lipid-lowering properties of TAK-475, a squalene synthase inhibitor, in vivo and in vitro. Br J Pharmacol. 2003;139(5):911–918.
- Liu J, Jiang S, Zhao Y, et al. Geranylgeranyl diphosphate synthase (GGPPS) regulates non-alcoholic fatty liver disease (NAFLD)-fibrosis progression by determining hepatic glucose/fatty acid preference under high-fat diet conditions. The Journal of Pathology. 2018;246(3):277–288.
- Shimomura I, Bashmakov Y, Horton JD. Increased levels of nuclear SREBP-1c associated with fatty livers in two mouse models of diabetes mellitus. J Biol Chem. 1999;274(42):30028–30032.
- Iorio A, Piacentini S, Polimanti R, et al. Functional variability of glutathione S-transferases in Basque populations. Am J Hum Biol. 2014;26(3):361–366.
- Board PG, Menon D. Glutathione transferases, regulators of cellular metabolism and physiology. Biochim Biophys Acta. 2013;1830(5):3267–3288.
- Liu F-P, Ma X, Li -M-M, et al. Hepatoprotective effects of Solanum nigrum against ethanol-induced injury in primary hepatocytes and mice with analysis of glutathione S-transferase A1. J Chin Med Assoc. 2016;79(2):65–71.
- Ma X, Liu F, Li M, et al. Expression of glutathione S-transferase A1, a phase II drug-metabolizing enzyme in acute hepatic injury on mice. Exp Ther Med. 2017;14(4):3798–3804.
- Singhal SS, Singh SP, Singhal P, et al. Antioxidant role of glutathione S-transferases: 4-Hydroxynonenal, a key molecule in stress-mediated signaling. Toxicol Appl Pharmacol. 2015;289(3):361–370.
- Thompson KJ, Austin RG, Nazari SS. Altered fatty acid-binding protein 4 (FABP4) expression and function in human and animal models of hepatocellular carcinoma. Liver International: Official Journal of the International Association for the Study of the Liver. 2018;38(6):1074–1083.
- Guy CA, Hoogendoorn B, Smith SK, et al. Promoter polymorphisms in glutathione-S-transferase genes affect transcription. Pharmacogenetics. 2004;14(1):45–51.
- Sharma S, Adrogue JV, Golfman L, et al. Intramyocardial lipid accumulation in the failing human heart resembles the lipotoxic rat heart. The FASEB Journal. 2004;18(14):1692–1700.
- Unger RH. Minireview: weapons of lean body mass destruction: the role of ectopic lipids in the metabolic syndrome. Endocrinology. 2003;144(12):5159–5165.
- Nishida K, Otsu K. Inflammation and metabolic cardiomyopathy. Cardiovasc Res. 2017;113(4):389–398.
- Maack C, Murphy E. Metabolic cardiomyopathies: fighting the next epidemic. Cardiovasc Res. 2017;113(4):367–369.
- Goldberg IJ, Reue K, Abumrad NA, et al. Deciphering the role of lipid droplets in cardiovascular disease: a report from the 2017 national heart, lung, and blood institute workshop. Circulation. 2018;138(3):305–315.
- Peterson LR, Herrero P, Schechtman KB, et al. Effect of obesity and insulin resistance on myocardial substrate metabolism and efficiency in young women. Circulation. 2004;109(18):2191–2196.
- Taleb A, Ahmad KA, Ihsan AU, et al. Antioxidant effects and mechanism of silymarin in oxidative stress induced cardiovascular diseases. Biomed Pharmacothe. 2018;102:689–698.