
ABSTRACT
Hepatocellular carcinoma (HCC) is a principal histologic type of liver cancer with high mortality. Long non-coding RNAs (LncRNAs) exert a crucial role in the pathogenesis of human tumors. To date, the functions and mechanisms of lncRNA HAGLROS in HCC are rarely reported. In the current study, HAGLROS exhibited a higher level in HCC tissues and cells. HAGLROS expression was positively correlated with tumor size, TNM stage and poor clinical prognosis. Loss-of-function experiments showed that knockdown of HAGLROS significantly lowered cell proliferation, cell cycle progression, migration, invasion and epithelial to mesenchymal transition (EMT) but induced apoptosis in vitro. Consistently, tumor growth in the nude mice was effectively slowed by the depletion of HAGLROS. Mechanistically, HAGLROS could competitively bind to miR-26b-5p to prevent the suppression of miR-26b-5p on its downstream target gene Karyopherin α2 (KPNA2). Moreover, the inhibitory effects of HAGLROS knockdown on cell malignant behaviors were reversed due to the miR-26b-5p down-regulation or KPNA2 overexpression. It was interesting to note that HAGLROS inactivated p53 signaling through targeting miR-26b-5p/KPNA2. In conclusion, our results demonstrated that HAGLROS contributed to the malignant progression of HCC via serving as a sponge for miR-26b-5p to facilitate KPNA2 expression and inactivate p53 signaling. Targeting HAGLROS/miR-26b-5p/KPNA2 axis might be an alternative therapeutic strategy for HCC patients.
Graphical Abstract
Introduction
Primary liver cancer ranks seventh in cancer incidence and is the second leading cause of cancer deaths in the world [Citation1]. As the principal histologic type, hepatocellular carcinoma (HCC) accounts for almost 75% of all liver cancers [Citation2]. The incidence rates of HCC remain the highest in Asian countries, and China occupies more than half of all cases worldwide [Citation3]. There has been a shift of risk factors of HCC from chronic infection with HBV and HCV to obesity and diabetes in many regions [Citation4]. In recent years, increasing drugs gain approval for systemic treatment of patients with advanced HCC unsuitable for surgical resection, liver transplantation, and pharmaceutical interventions [Citation5]. In fact, HCC has a very poor prognosis due to the aggressive malignant nature, with a median survival time of 11 months and 5-year survival rate of 18% [Citation6,Citation7]. What is worse, the 5-year survival rate is merely 2% for HCC patients at distant stage [Citation6]. Thus, clarifying the mechanisms underlying HCC progression is required for developing more individualized therapy to improve patients’ outcome.
Long non-coding RNAs (LncRNAs) are a kind of transcripts consisting of over 200 nucleotides and lack protein coding potential. LncRNAs exert diverse biological functions in human diseases by regulating gene expression through controlling chromatin modification, transcription, translation and post-translational processes [Citation8]. LncRNAs are responsible for tumor growth and metastasis in a plethora of cancers via acting as enhancers, scaffolds or decoys by physically interacting with other RNA species or protein [Citation9,Citation10]. Increasing lncRNAs have been identified to be implicated in the initiation, progression, and metastasis of HCC [Citation11,Citation12]. For example, lncRNA EPB41L4A-AS2 up-regulates forkhead box L1 (FOXL1) expression via sponge-like binding with miR-301a-5p, thereby inhibiting the malignant phenotypes of HCC cells [Citation13]. LncRNA DARS-AS1 promotes HCC proliferation and metastasis by regulating miR-3200-5p/cytoskeleton associated protein 2 (CKAP2) to activate FAK/ERK pathway [Citation14]. However, only a fraction of lncRNAs have been functionally characterized up to now.
HAGLROS, a 699 bp lncRNA, has been reported as a cancerogenic factor in some types of solid tumors, such as gastric cancer [Citation15], non-small cell lung cancer (NSCLC) [Citation16], ovarian cancer [Citation17], osteosarcoma [Citation18]. Moreover, a previous document clarified that HAGLROS was up-regulated in HCC and promotes tumor progression via regulation proliferation, apoptosis and autophagy [Citation19]. However, its detailed molecular mechanisms need a deep investigation.
Accumulating evidence demonstrates that lncRNAs can serve as molecular sponges to sequester miRNAs from interaction with their downstream target mRNAs [Citation20]. Also, ceRNA regulatory networks are found to be related to various biological events, including cell growth, epithelial to mesenchymal transition (EMT), metastasis, and chemoresistance, in HCC [Citation21]. Thus, we assumed that HAGLROS exerted a role in HCC through a similar ceRNA mode. This study aims to elucidate the function of HAGLROS in HCC progression and its potential regulatory mechanism. Increased HAGLROS expression was confirmed in HCC tissues and cells. High HAGLROS expression was positively related to tumor size and TNM stage. HAGLROS acted as a sponge for miR-26b-5p to increase KPNA2 expression and inhibit p53 signaling, thereby promoting cell proliferation, migration, invasion and EMT in HCC. Our findings highlight the great possibilities of using HAGLROS as a target to prevent HCC growth and metastasis.
Materials and methods
Clinical specimens
A cohort of 62 tumor tissues and adjacent normal tissues (at least 5 cm away from the tumor margin) were collected from HCC patients who were undergoing radical resections at Henan Provincial People’s Hospital. No patients received preoperative therapy. This study was authorized by the Ethics Committee of Henan Provincial People’s Hospital (Zhengzhou University People’s Hospital) and conformed to the guidelines of Declaration of Helsinki. All participants provided the informed written consent.
Cell culture
Human HCC cells (Huh7, BEL-7405, HCCLM3 and MHCC97H) and immortalized hepatic cells LO2 were obtained from the Chinese Academy of Sciences Cell Bank (Shanghai, China). Cells were routinely cultured in DMEM containing 10% FBS (Gibco, Thermo Fisher Scientific, Waltham, MA, USA) and 1% penicillin/streptomycin (Sigma-Aldrich, St Louis, MO, USA) at 37°C with 5% CO2.
Cell transfection
Small interfering RNAs (siRNAs) against HAGLROS (siRNA-1, siRNA-2 and siRNA-3), control non-targeting siRNA (si-con) and KPNA2-overexpression vector (KPNA2) were designed by GenePharma (Shanghai, China). MiR-26b-5p mimic or inhibitor (miR-26b-5p or inh-miR-26b-5p) and their control nonsense sequences (miR-NC/inh-NC) were obtained from Vigene Biosciences (Shandong, China). The lentivirus harboring the short hairpin RNA sequences against HAGLROS (sh-HAGLROS) and negative control (sh-con) was provided by RiboBio (Guangzhou, China). Transfection was performed by using Lipofectamine 3000 reagent (Invitrogen, Carlsbad, CA, USA).
Quantitative real-time PCR (qRT-PCR)
Total RNA was extracted from HCC cells via TRIzol Reagent (Invitrogen, Carlsbad, CA, USA). The complementary DNA (cDNA) synthesis was performed with High-Capacity cDNA Reverse Transcription Kit (Thermo Fisher Scientific, Waltham, MA, USA) or All-in-One™ miRNA First-Strand cDNA Synthesis Kit (Genecopies, Rockville, MD, USA). Real-time PCR reactions were conducted on ABI Prism 7900HT sequence detection system (Applied Biosystems, Foster City, CA, USA) using Power SYBR Green Master Mix (Applied Biosystems). Glyceraldehyde-3-phosphate dehydrogenase (GAPDH) and U6 small nuclear RNA were used as endogenous controls. The fold changes of gene expression were determined using 2–ΔΔCT method [Citation22]. The primer sequences are presented in Supplemental material 1: Table S1.
CCK-8 assay
Cell Counting Kit-8 (CCK-8; Medchemexpress, Shanghai, China) was applied to detect the cell viability according to the manufacturer’s guideline. Transfected HCCLM3 and MHCC97H cells were seeded in 96-well plates. After 1, 2, 3 or 4 days, each well was added with 10 µl of CCK-8 solution, followed by 2.5 h of incubation. A microplate reader (Dynex Technologies, West Sussex, UK) was used to detect the optical density at 450 nm.
5-Ethynyl-2’-deoxyuridine (EdU) assay
HCC cell proliferation was determined using a Cell-LightTM EdU DNA cell proliferation kit (RiboBio, Guangzhou, China) based on the manufacturer’s instructions. Briefly, transfected HCCLM3 and MHCC97H cells were inoculated in 96-well plates and cultured for 48 h. Then, cells were incubated with 25 µM Edu solution for 2 h at 37°C, fixed with 4% paraformaldehyde for 30 min, permeabilized with 0.5% Triton X-100 for 10 min, and stained with 1 × Apollo reaction reagent for 30 min. A Leica DMi8 fluorescence microscope (Wetzlar, Germany) was used to visualize and capture the images. Five fields were randomly selected to calculate the percentage of EdU-positive cells.
Colony formation assay
Transfected HCCLM3 and MHCC97H cells were planted into six-well plates at a density of 500 cells per well. After 2-week incubation, cells were fixed with 10% formaldehyde and stained with 0.1% crystal violet. Visible colonies from five randomly selected fields were manually counted.
Cell cycle assay
HCCLM3 and MHCC97H cells were harvested, washed with cold PBS and fixed in pre-cold 70% ethanol at 4°C for 30 min. After centrifugation, cells were washed with PBS and resuspended in 500 μL PBS containing 50 μg/ml propidium iodide (PI), 0.2% Triton X-100, 0.1% sodium citrate and 100 μg/ml RNase A at room temperature for 30 min. Finally, cells were subjected to a FACSCalibur flow cytometry (BD Biosciences, San Jose, CA, USA) for determining cell cycle distribution.
Apoptosis assay
Cell apoptosis was evaluated by using Annexin V-FITC/PI apoptosis detection kit (BD Biosciences, Franklin Lakes, NJ, USA) in reference to the manufacturer’s protocol. Transfected HCCLM3 and MHCC97H cells were plated into 6-well plates for 48 h inoculation. Then, cells were collected, washed with PBS and resuspended in binding buffer. Next, cells were stained with 5 μL Annexin V-FITC and 10 μL PI at room temperature for 10 min. A FACSCalibur flow cytometer (BD Biosciences) was used to examine cell apoptosis rate.
Wound healing assay
HCCLM3 and MHCC97H cells were inoculated in 6-well plates at a density of 5 × 10⁵ cells per well. When cells reached nearly 90% confluence, a gap was created by using 200 μL pipette tips to scratch the cell monolayer. After eliminating the cell debris with PBS, fresh medium was added for 48 h of incubation. A light microscope was used to capture the images at 0 h and 48 h after the wound generation. The percentage of wound closure was determined using the following equation: (wound area at 0 h – wound area at 48 h)/wound area at 0 h × 100%.
Transwell invasion assay
To determine cell invasion, the 24-well transwell plates (Costar, Corning Inc., NY, USA) with 8 μm pore inserts were pre-coated with Matrigel matrix. HCCLM3 and MHCC97H cells in 200 μL serum-free medium were seeded into the apical chamber, while 500 μL medium with 10% FBS was added to the lower chamber. After 48 h of incubation, cells in the upper chamber were gently removed with a cotton swab. Cells that had invaded through the membrane were fixed with 4% formaldehyde and stained with 0.1% crystal violet. Cells from five randomly selected fields were counted under an optical microscope.
Western blot assay
Total protein was extracted from HCC cells by using RIPA lysis buffer (Beyotime Institute of Biotechnology, Shanghai, China). Protein content was measured with a BCA Protein Assay Kit (Beyotime Institute of Biotechnology). Equal amounts of protein (30 µg) were electrophoresed on 10% SDS-PAGE gels and transferred onto PVDF membranes. Then, the membranes were incubated with the primary antibodies against E-cadherin (Cat#14,472; 1:1,000 dilution), Vimentin (Cat#12,826; 1:1,000 dilution), KPNA2 (Cat#14,372; 1:1,000 dilution), p53 (Cat#48,818; 1:1,000 dilution), p21 (Cat#2947; 1:1,000 dilution), Bax (Cat#5023; 1:1,000 dilution), Cyclin D1 (Cat#2922; 1:1,000 dilution) and GAPDH (Cat#5174; 1:1000 dilution) overnight at 4°C, followed by probed with horseradish peroxidase-conjugated secondary antibody (Abcam, Cambridge, MA, USA; 1:2000; Cat#ab6721) for 2 h at room temperature. The immunoreactive bands were detected by ECLWestern Blotting Detection System (GE Healthcare, Chicago, IL, USA). All primary antibodies were purchased from Cell Signaling Technology (Danvers, MA, USA).
Subcellular fractionation assay
To confirm the cellular localization of HAGLROS, a Nuclear/Cytoplasmic Isolation Kit (Norgen Biotek Corporation, Thorold, ON, Canada) was used to isolate the cytoplasmic and nuclear RNA from HCC cells.
Dual-luciferase reporter assay
The wild-type sequences of HAGLROS or KPNA2-3ʹUTR containing miR-26b-5p targeting sites were amplified and inserted into the downstream of psiCHECK2 luciferase vector (Promega, Madison, WI, USA) to establish HAGLROS-wt (HAGLROS-wt1/wt2) and KPNA2-wt reporter. Meanwhile, the miR-26b-5p binding sequences on HAGLROS or KPNA2-3ʹUTR were mutated by a QuikChange Lightning Site-Directed Mutagenesis Kit (Agilent Technologies, Santa Clara, CA, USA) to generate HAGLROS-mut (HAGLROS-mut1/mut2) reporter. Then, HCCLM3 and MHCC97H cells were co-transfected with the constructed luciferase plasmids and miR-NC or miR-26b-5p by using Lipofectamine 3000 (Invitrogen). After 48 h, the luciferase activity was determined by using dual-luciferase reporter assay system (Promega) and normalized to the firefly luciferase.
RNA pull-down assay
HCCLM3 and MHCC97H cells were transfected with biotinylated RNAs (Biotin-miR-26b-5p or Biotin-NC) and incubated for 48 h at 37°C. Afterward, cell lysates were incubated with streptavidin-coated magnetic beads. The relative enrichment of HAGLROS was examined in biotin-coupled RNA complex by qRT-PCR.
Mice xenograft assay
Five-week-old male BALB/c nude mice were purchased from Beijing Vital River Laboratory Animal Technology Co., Ltd. (Beijing, China) and housed in sterilized cages. Mice were randomly divided into two groups with five mice in each group: sh-HAGLROS and sh-NC. Mice sh-HAGLROS and sh-NC groups were, respectively, subcutaneously injected with MHCC97H cells (8 × 10⁶) carrying sh-HAGLROS or sh-NC at the dorsal sides. Tumor length and width were measured and recorded every 3 days. Tumor volumes were calculated using the formula: V = (length × width2)/2. At 20 days after injection, mice were sacrificed, and tumors were removed for further experiments. All animal protocols were performed in accordance with the National Institutes of Health guide for the care and use of Laboratory animals and approved by the Animal Ethics Committee of Henan Provincial People’s Hospital.
Immunohistochemistry (IHC)
Tumor tissues from mice were fixed with 4% paraformaldehyde and embedded in paraffin. Paraffin-embedded xenograft tissues were cut into 4-μm-thick section, deparaffinized and incubated with antibody against KPNA2 (Abcam; Cat#ab84440), p53 (Abcam; Cat#ab32389), p21 (Cell Signaling Technology, Cat#2947), PCNA (Abcam; Cat#ab92729) overnight at 4°C. After incubation with anti-HRP secondary antibody for 2 h at room temperature, tissue sections were stained with diaminobenzidine and hematoxylin.
Statistical analysis
All experiments were performed independently at least three times. Data were presented as mean ± standard deviation (SD) and analyzed with GraphPad Prism 7.0 software. The relationship between HAGLROS expression and clinicopathological features of HCC patients was evaluated with chi-square test. Overall survival curves were plotted according to Kaplan–Meier method and compared with log-rank test. Gene expression correlation analysis was conducted using Pearson’s correlation coefficient. Student’s t-test was applied for pairwise comparison. Multi-group comparison was carried out using one-way analysis of variance (ANOVA) followed by a Tukey’s post hoc test. A P value less than 0.05 denotes a statistical significance.
Results
This study was designed to explore the role and mechanism of HAGLROS in HCC progression. By transfecting siRNAs into HCCLM3 and MHCC97H cells, we observed the inhibitory effects of HAGLROS knockdown on cell proliferation, migration, invasion and EMT in vitro. By using bioinformatic prediction, dual-luciferase reporter experiments and RNA pull down analysis, we found that HAGLROS could serve as a sponge for miR-26b-5p to up-regulate KPNA2 expression. Together, our data suggested an important role of ‘HAGLROS-miR-26b-5p-KPNA2’ in regulating HCC malignant behaviors.
HAGLROS is highly expressed in HCC and predicts a poor prognosis
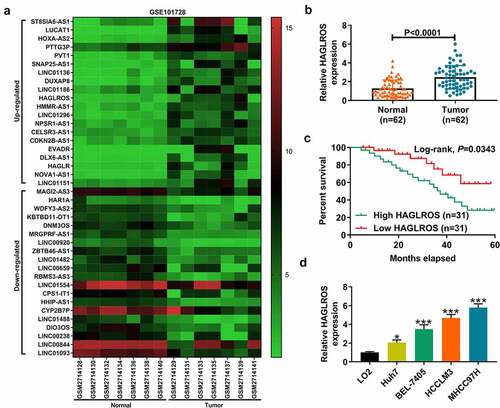
According to the microarray data from GSE101728, the top 20 up-regulated and down-regulated lncRNAs in HCC tumor tissues were presented by heatmap (). Among the top 10 up-regulated lncRNAs, SNAP25-AS1, LINC01136, LINC01186, and HAGLROS have not been extensively studied. Survival plots in Gene Expression Profiling Interactive Analysis (GEPIA) database showed that high LINC01136 or HAGLROS expression was associated with a poorer prognosis of HCC patients (Supplemental material 1: Figure S1A-D). qRT-PCR showed that HAGLROS expression was increased in 10 HCC tumor tissues compared to matched normal tissues, while LINC01136 expression was not significantly changed (Supplemental material 1: Figure S2A and B). Thus, we focused on HAGLROS in this study. As shown in Supplemental material 1: Figure S3A, we observed the up-regulation of HAGLROS expression in HCC tumor tissues compared with adjacent tumor-free tissues from GSE101728 dataset. GEPIA survival analysis tool indicated a negative correlation between HAGLROS expression and overall survival of HCC patients (Supplemental material 1: Figure S3B). Then, qRT-PCR was used to confirm the expression profile of HAGLROS in tumor tissues and adjacent non-cancerous tissues from 62 HCC patients. The result exhibited a significant increase of HAGLROS expression in tumor tissues compared to corresponding para-carcinoma tissues (). HCC patients were stratified into low-expression group and high-expression group according to the median of HAGLROS expression. The correlation between the clinicopathological characteristics and HAGLROS expression in HCC patients was displayed in . Tumor size and TNM stage were found to be significantly associated with HAGLROS expression. As depicted by Kaplan–Meier analysis, HCC patients with high HAGLROS expression showed a shorter survival rate than that with low HAGLROS expression (). Consistently, higher HAGLROS expression was observed in HCC cells in comparison with immortalized hepatic cells LO2 (). HCCLM3 and MHCC97H cells with higher HAGLROS expression were selected for loss-of-function assays. These data suggested that there might be a correlation between HAGLROS expression and HCC progression and prognosis.
Table 1. Correlation between HAGLROS expression and clinicopathological features of HCC patients
Figure 1. HAGLROS is overexpressed in HCC and correlates with a poor prognosis. (a) Heatmap showing the top 20 up-regulated and down-regulated lncRNAs between HCC tumor tissues and adjacent non-cancerous samples. (b) Relative HAGLROS expression was determined by qRT-PCR in 62 paired HCC tumor tissues and adjacent pericarcinomatous tissues. (c) Kaplan–Meier curves were plotted to detect the overall survival of HCC patients with high (n = 31) or low (n = 31) HAGLROS expression. (d) Relative HAGLROS expression was compared in four HCC cells and immortalized human hepatic cell line LO2. *P < 0.05, ***P < 0.001.
Knockdown of HAGLROS inhibits cell malignant phenotypes in HCC in vitro
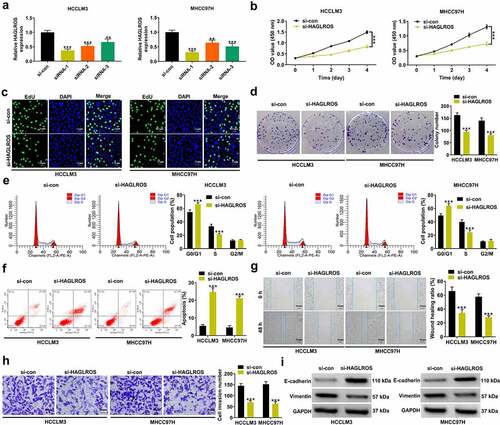
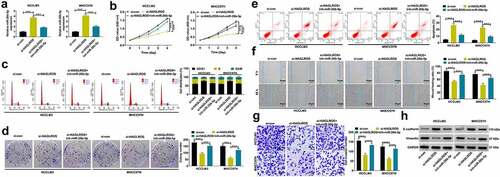
To determine the biological significance of HAGLROS in HCC, three siRNAs specifically targeting HAGLROS (siRNA-1, siRNA-2 and siRNA-3) were transfected into HCCLM3 and MHCC97H cells. HAGLROS was successfully silenced by these three kinds of siRNAs (). The most effective siRNA-1 (si-HAGLROS) was used for subsequent function and mechanism experiments. CCK-8 assays showed a significant decrease of cell viability in si-HAGLROS group compared with si-con group (). EdU and colony forming assays revealed that cell proliferation was significantly inhibited by HAGLROS knockdown ( –d). As demonstrated by flow cytometry assays, loss of HAGLROS significantly induced cell cycle arrest at G0/G1 stage and apoptosis ( –f). Wound healing and transwell invasion assays clarified that cell migration and invasion potential was effectively lowered due to the depletion of HAGLROS ( –h). Similarly, HAGLROS silencing repressed epithelial–mesenchymal transition (EMT) process, manifested as increased E-cadherin expression and decreased Vimentin expression (). All these data suggested the oncogenic role of HAGLROS in HCC.
Figure 2. HAGLROS knockdown suppresses cell malignant behaviors in HCC in vitro. (a) Relative HAGLROS expression was measured by qRT-PCR in HCCLM3 and MHCC97H cells transfected with 3 independent siRNAs targeting HAGLROS. (b-d) Proliferation ability was evaluated by CCK-8, colony formation and EduU assays in HCCLM3 and MHCC97H cells after transfection with si-HAGLROS or si-con. (e-f) Flow cytometry assays were performed to determine the influence of HAGLROS down-regulation on cell cycle and apoptosis. (g and h) Wound healing and transwell assays were applied to detect cell migration and invasion in response to HAGLROS depletion. (i) The protein expression levels of E-cadherin and vimentin were measured by western blot assays when HAGLROS was silenced. **P < 0.01, ***P < 0.001.
HAGLROS acts as a ceRNA of miR-26b-5p in HCC cells
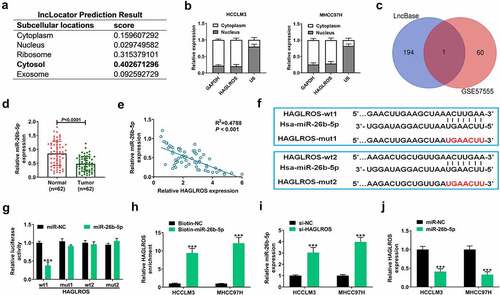
To observe the carcinogenic mechanism of HAGLROS in HCC, we first confirmed its subcellular localization. HAGLROS was predicted to be predominantly distributed in cytosol based on lncLocator software (). Subcellular fractionation assays actually verified the cytoplasmic localization of HAGLROS (). According to DIANA-LncBase v2.0 program, a total of 195 miRNAs were found to contain the target sites of HAGLROS. When making a comparison between these candidate miRNAs and down-regulated miRNAs in HCC from GSE57555, only miR-26b-5p was screened out (). According to GSE57555 database, decreased miR-26b-5p expression was observed in HCC tumor specimens compared with corresponding non-tumor specimens (Supplemental material 1: Figure S4A). Online prediction tool Starbase v2.0 showed that miR-26b-5p expression was decreased and negatively associated with HAGLROS expression in liver hepatocellular carcinoma (LIHC) (Supplemental material 1: Figure S4 and C). Moreover, the same results were obtained in our 62 HCC cases ( –e). Online bioinformatic tools showed two possible binding sequences of HAGLROS on miR-26b-5p (). To validate the potential interaction between HAGLROS and miR-26b-5p, HCCLM3 cells were co-transfected with dual-luciferase reporter (HAGLROS-wt1/mut1 or HAGLROS-wt2/mut2) and miR-NC or miR-26b-5p mimic. The luciferase activity of HAGLROS-wt1 reporter was significantly reduced by miR-26b-5p overexpression, while the luciferase activity of HAGLROS-mut1, -wt2 and -mut2 remained unchanged (), indicating the binding of miR-26b-5p on HAGLROS is at site 1. As described by RNA pull-down assays, HAGLROS was precipitated by Biotin-miR-26b-5p rather than Biotin-NC (), further confirming the binding between miR-26b-5p and HAGLROS. Moreover, qRT-PCR found that knockdown of HAGLROS facilitated the expression of miR-26b-5p (), while miR-26b-5p overexpression led to a repression of HAGLROS expression in HCCLM3 and MHCC97H cells (). With these findings above, we concluded that HAGLROS could target and negatively regulate miR-26b-5p in HCC.
Figure 3. HAGLROS competitively sponges miR-26b-5p to repress its expression. (a) The sequences of HAGLROS were analyzed by online software lncLocator to predict its subcellular localization. (b) Subcellular fractionation assays were applied to detect the distribution of HAGLROS in nucleus and cytoplasm of HCC cells. (c) Venn analysis of the candidate targets of HAGLROS by DIANA-LncBase and down-regulated miRNAs in HCC from GSE57555. (d) qRT-PCR assays of miR-26b-5p expression in tumor specimens and adjacent normal samples from our cohort of HCC patients. (e) Expression correlation analysis of miR-26b-5p and HAGLROS in 62 HCC tissues. (f) The predicted two binding sites of HAGLROS on miR-26b-5p. (g) After transfection with miR-NC or miR-26b-5p and constructed reporters (HAGLROS-wt1/mut1/wt2/mut2), dual-luciferase reporter assays were performed in MHCC97H cells. (h) The binding between miR-26b-5p and HAGLROS were further validated in HCC cells using RNA pull-down assays. (i) Effects of HAGLROS depletion on miR-26b-5p expression in HCCLM3 and MHCC97H cells. (j) Effects of miR-26b-5p up-regulation on HAGLROS expression in HCCLM3 and MHCC97H cells. ***P < 0.001.
HAGLROS promotes HCC malignant processes through acting as a sponge of miR-26b-5p
To further explore whether miR-26b-5p was a participant in HAGLROS-mediated carcinogenic effect, si-HAGLROS was transfected into HCCLM3 and MHCC97H cells alone or together with miR-26b-5p inhibitor (inh-miR-26b-5p). As depicted in , si-HAGLROS-induced increase of miR-26b-5p expression was reversed in the presence of inh-miR-26b-5p. In terms of proliferation, we found that the cell viability, cell cycle progression and colony forming ability suppressed by HAGLROS silencing were distinctly attenuated due to miR-26b-5p exhaustion (). Moreover, reduction of miR-26b-5p greatly counteracted si-HAGLROS-caused apoptosis (). Analogously, the inhibitory influences of HAGLROS knockdown on cell migration, invasion and EMT were abated in response to the decrease of miR-26b-5p expression (). To sum up, HAGLROS contributed to HCC cell proliferation and metastasis via functioning as a sponge for miR-26b-5p.
Figure 4. HAGLROS facilitates HCC proliferation and metastasis by down-regulating miR-26b-5p down-regulation. (a-h) HCCLM3 and MHCC97H cells were transfected with si-HAGLROS alone or together with miR-26b-5p inhibitor. (a) qRT-PCR analysis of miR-26b-5p expression. (b-d) CCK-8 (b), flow cytometry (c) and colony forming (d) assays were used to evaluate cell proliferation potential. (e) Flow cytometry assay was performed to examine cell apoptosis. (f-h) Wound healing (f), transwell (g) and western blot (h) assays were applied to detect cell migration, invasion and EMT process. ***P < 0.001.
HAGLROS acts as a sponge for miR-26b-5p to facilitate the expression of its downstream target KPNA2
For further investigating the mechanism of miR-26b-5p in inhibiting HCC progression, 176 miR-26b-5p-targeted mRNAs were retrieved from TargetScan and miRDB algorithms. Among these candidate mRNAs, there were three targets (E2F7, COL22A1 and KPNA2) found to be up-regulated in HCC specimens based on GSE101728 dataset (). GEIPA and starBase v2.0 online tools showed higher level of KPNA2 in HCC tissues than that in normal liver tissues ( and Supplemental material 1: Figure S5A). qRT-PCR confirmed that KPNA2 expression was up-regulated in tumor tissues from our cohort of HCC patients (). Moreover, high KPNA2 expression was correlated with a poor prognosis in LIHC based on GEPIA survival plots () and Pan-Cancer Analysis Platform from starBase v2.0 (Supplemental material 1: Figure S5B). The wild-type binding sites of KPNA2-3ʹUTR on miR-26b-5p as well as its mutant sequences were shown in . As demonstrated by luciferase reporter assays, miR-26b-5p overexpression resulted in a decrease of luciferase activity in KPNA2-wt reporter, but this effect was disappeared when the binding sequences of KPNA2 on miR-26b-5p were mutated (). RNA pull-down assays found that compared to Biotin-NC group, much more KPNA2 was captured by Biotin-miR-26b-5p in HCCLM3 and MHCC97H cells (). Moreover, KPNA2 protein level was inhibited by miR-26b-5p up-regulation, but was promoted by miR-26b-5p reduction in HCCLM3 and MHCC97H cells (). These data provided evidence for KPNA2 as a direct target of miR-26b-5p in HCC.
Figure 5. HAGLROS positively regulates KPNA2 expression in HCC cells by serving as a sponge for miR-26b-5p. (a) Venn diagram displayed 3 candidate targets of miR-26b-5p according to GSE101728, TargetScan and miRDB. (b) Expression of KPNA2 in tumor tissues and normal tissues of HCC from GEPIA. (c) qRT-PCR analysis was used to measure KPNA2 expression in 62 paired HCC tumor tissues and adjacent non-cancerous tissues. (d) The prognostic value of KPNA2 in HCC patients was analyzed using GEPIA survival plots. (e) A graphical representation of complementary binding sequences between miR-26b-5p and KPNA2-3ʹUTR. (f) The relative luciferase activity was determined in HCCLM3 and MHCC97H cells after transfection with miR-NC or miR-26b-5p and wild-type or mutant KPNA2-3ʹUTR reporter. (g) RNA pull-down assays were conducted in HCCLM3 and MHCC97H cells by using Biotin-NC or Biotin-miR-26b-5p, followed by qRT-PCR analysis of KPNA2 expression. (h) Effects of miR-26b-5p overexpression or inhibition on KPNA2 protein level were detected by western blot. (i) qRT-PCR was performed to analyze the correlation between KPNA2 and miR-26b-5p or HAGLROS in 62 HCC tumor tissues. (j) The inhibition of HAGLROS knockdown on KPNA2 protein level was reversed by miR-26b-5p inhibitor. *P < 0.05, ***P < 0.001.
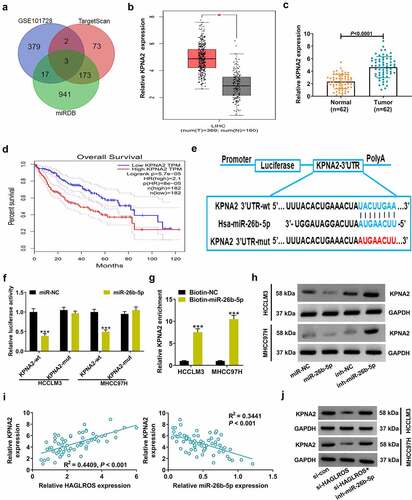
In consideration of lncRNA-related ceRNA regulatory mechanism, we further explored whether HAGLROS could regulate KPNA2 expression via a ceRNA-dependent manner. From Pan-Cancer Analysis of starBase v2.0, we found that KPNA2 expression was inversely correlated with miR-26b-5p expression, while it was positively associated with HAGLROS expression in LIHC tissues (Supplemental material 1: Figure S5C and D). The same results were verified in our clinical HCC cases (). KPNA2 protein level was lowered in response to HAGLROS knockdown in HCCLM3 and MHCC97H cells, but this effect was reversed by inhibition of miR-26b-5p expression (). Together, HAGLROS acted as miR-26b-5p sponge to positively modulate KPNA2 expression in a ceRNA-dependent pattern.
The inhibitory effects of HAGLROS on HCC progression were attenuated due to KPNA2 increase
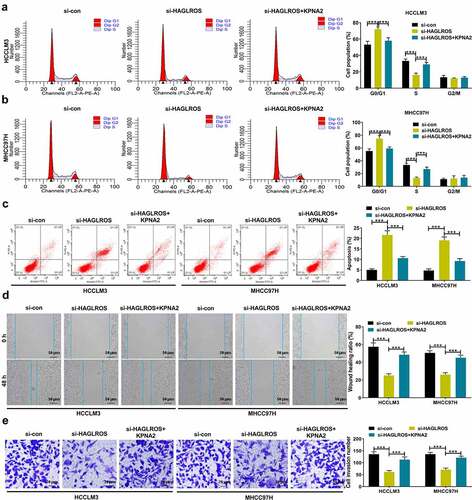
In an attempt to address whether KPNA2 was implicated in HAGLROS-mediated carcinogenicity, si-HAGLROS was transfected into HCCLM3 and MHCC97H cells alone or together with KPNA2-overexpressing vector. The suppression of HAGLROS knockdown on cell cycle progression was reversed by KPNA2 up-regulation ( –b). Also, KPNA2 overexpression could effectively abate the apoptosis induced by HAGLROS deficiency (). As for cell metastasis, we found that si-HAGLROS-mediated inhibition of migration and invasion was alleviated with the increase of KPNA2 expression ( –e). According to the data listed above, HAGLROS promoted the malignant progression of HCC at least partly due to KPNA2 up-regulation.
Figure 6. HAGLROS accelerates cell proliferation and metastasis in HCC through regulation of KPNA2 expression. (a-f) SiRNA targeting HAGLROS was transfected into HCCLM3 and MHCC97H cells alone or in combination with KPNA2-overexpression plasmid. (a and b) Flow cytometry analysis of cell cycle distribution. (c) Flow cytometry analysis of cell apoptosis. (d) Wound healing assay of cell migration. (e) Transwell assay of cell invasion. ***P < 0.001.
Knockdown of HAGLROS activates p53 signaling through regulating miR-26b-5p/KPNA2
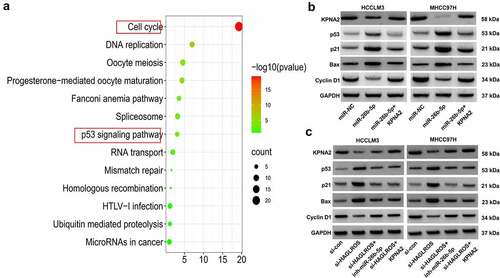
According to GEPIA and UALCAN analysis of KPNA2 in HCC, a total of 172 correlating genes (Pearson CC ≥ 0.6) were found. Kyoto Encyclopedia of Genes and Genomes (KEGG) enrichment analysis of these genes in DAVID showed that the involvement of KPNA2 in HCC progression was associated with p53 signaling pathway (). KPNA2 has been reported to play a tumor-promoting action in several human cancers via inactivation of p53 signaling [Citation23,Citation24]. Here, we explored whether miR-26b-5p could regulate p53 signaling by targeting KPNA2. As shown in , miR-26b-5p overexpression inhibited the expression of KPNA2 and Cyclin D1, while enhanced the expression of p53, p21 and Bax. However, these effects were greatly attenuated after overexpressing KPNA2. These data suggested that miR-26b-5p activated p53 signaling by targeting KPNA2. Then, western blot assays were conducted to further detect the effects of HAGLROS on p53 signaling. The results showed that depletion of HAGLROS lowered the expression of KPNA2 and Cyclin D1 but promoted the expression of p53, p21 and Bax (). However, all these changes of KPNA2, p53, p21, Cyclin D1 and Bax induced by HAGLROS knockdown were abated by miR-26b-5p inhibition or KPNA2 overexpression (). Therefore, a conclusion was drawn that HAGLROS could inactivate p53 signaling pathway via modulating miR-26b-5p/KPNA2 axis.
Figure 7. HAGLROS inactivates p53 signaling via regulating miR-26b-5p/KPNA2. (a) KEGG enrichment analysis of KPNA2 similar genes was performed using DAVID tools. (b) Western blot assays were applied to determine the expression of KPNA2 and p53 pathway-related proteins (p53, p21, Bax, Cyclin D1) in HCCLM3 and MHCC97H cells transfected with miR-NC, miR-26b-5p or miR-26b-5p+KNPA1. (c)Western blot assays were used to measure the expression of KPNA2 and p53 pathway-related proteins (p53, p21, Bax, Cyclin D1) in HCCLM3 and MHCC97H cells transfected with si-HAGLROS alone or together with miR-26b-5p inhibitor or KPNA2-overexpressing vector.
Knockdown of HAGLROS inhibits HCC tumorigenesis in vivo
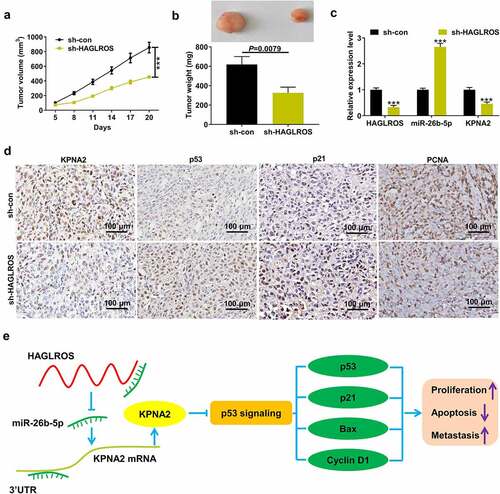
To analyze the role of HAGLROS in HCC in vivo, MHCC97H cells transfected with sh-HAGLROS or sh-con were injected into the nude mice. Tumors developed from HAGLROS-deficient cells were smaller than that from sh-con group (). Depletion of HAGLROS significantly lowered tumor weight compared with negative control group (). Knockdown of HAGLROS resulted in the decrease of HAGLROS and KPNA2 mRNA expression, and the increase of miR-26b-5p expression in tumor tissues (). As demonstrated by IHC in , the protein levels of KPNA2 and PCNA were declined, and p53 and p21 protein expression was enhanced in xenograft tumors derived from sh-HAGLROS-transfected cells (). These data suggested that HAGLROS contributed to HCC tumor growth at least partly by regulating miR-26b-5p/KPNA2/p53.
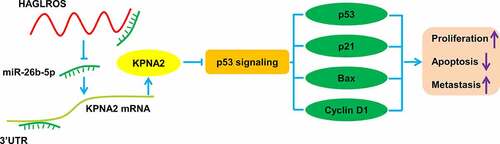
Figure 8. Depletion of HAGLROS repressed HCC tumorigenesis in vivo. MHCC97H cells with lentivirus vectors harboring sh-HAGLROS or sh-con were inoculated into nude mice at the dorsal sides. (a) Tumor growth curves were plotted by measuring tumor volumes every 3 days. (b) Tumor weights were determined when mice were euthanized. (c) qRT-PCR assays were performed to determine the expression of HAGLROS, miR-26b-5p and KPNA2 mRNA expression in xenograft tumors. (d) The tumor sections were used for IHC staining by antibodies against KPNA2, p53, p21, and PCNA. (e) The schematic diagram of HAGLROS-miR-26b-5p-KPNA2-p53 in regulating cell proliferation, apoptosis and metastasis in HCC. ***P < 0.001.
Discussion
Abnormal expression of lncRNAs has been identified to play vital roles in tumorigenesis and progression, implicating the potential of lncRNAs as biomarkers and therapeutic targets in cancer patients [Citation25,Citation26]. Despite rapid progress in ncRNA biopharmaceutical research, research on functions and mechanisms of HCC-related lncRNAs is still in its infancy [Citation27]. In the current study, HAGLROS was confirmed to exhibit a dramatic up-regulation in HCC tissues and cells. Clinical assays showed that high HAGLROS expression was associated with larger tumor size, advanced TNM stage and poor prognosis of HCC patients. These data indicated the possibility of HAGLROS as a prognostic biomarker for HCC. A bioinformatics analysis based on RNA-sequencing identified that HAGLROS was up-regulated in HCC tumor tissues, and HAGLROS displayed significant diagnostic value for HCC [Citation28]. However, HAGLROS was not associated with the HCC-specific survival, inconsistent with our data. The discrepancy might be caused by the difference of sample source, sample size or measurement methods.
Some recent studies have reported the involvement of HAGLROS in human malignancies. For instance, HAGLROS was found to be highly expressed in gastric cancer, and drive malignant progression of gastric cancer by mTOR signal-induced suppression of autophagy [Citation15]. HAGLROS was overexpressed in NSCLC, and knockdown of HAGLROS lowered cell proliferation, migration and invasion via regulating multiple cancer-related pathways [Citation16]. Also, HAGLROS was observed to be up-regulated in ovarian cancer, and promote tumor development through competitively bind with miR-100 to facilitate the expression of mammalian target of rapamycin (mTOR) and zinc and ring finger 2 (ZNRF2) [Citation17]. Additionally, HAGLROS exhibited an increased expression in osteosarcoma, and depletion of HAGLROS inhibited cell invasion and metastasis by affecting miR-152/Rho kinase 1 (ROCK1) [Citation18]. In diffuse large B-cell lymphoma, HAGLROS was identified as an oncogenic lncRNA by targeting miR-100 [Citation29]. Using loss-of-function assays, we found that knockdown of HAGLROS significantly suppressed cell proliferation, migration, invasion and EMT but enhanced apoptosis in vitro. Moreover, transplanted tumor growth in nude mice was effectively slowed by HAGLROS knockdown. These data suggested HAGLROS as an oncogenic lncRNA in HCC. A previous document elucidated that HAGLROS promoted cell proliferation and autophagy and suppressed apoptosis in HCC by the miR-5095/ATG12 axis and PI3K/AKT/mTOR signaling [Citation19]. Compared with this report, we further comprehensively examined the effects of HAGLROS on cell cycle, migration, invasion, EMT and tumor growth in HCC. Moreover, a novel ceRNA regulatory mechanism for HAGLROS in HCC was investigated in detail.
LncRNAs in cytoplasm can serve as natural miRNA sponges to repress miRNA functions and regulate mRNA expression [Citation30]. According to subcellular fractionation assay, we found that HAGLROS was mainly situated in cytoplasm. Subsequent experiments confirmed that miR-26b-5p was a direct target of HAGLROS. MiR-26b-5p has been demonstrated as an oncogenic driver in some types of tumors, including thyroid cancer [Citation31], bladder cancer [Citation32], multiple myeloma [Citation33] and tongue squamous cell carcinoma [Citation34,Citation35]. What is more, miR-26b-5p was previously revealed to be down-regulated in HCC. Functionally, overexpression of miR-26b-5p inhibited cell proliferation, angiogenesis and metastasis while enhanced T cells responses in HCC [Citation36,Citation37]. These findings suggest a potential application for miR-26b-5p in anti-HCC therapy. Consistently, decreased miR-26b-5p expression was confirmed in our HCC cases. And, a negative correlation was observed between miR-26b-5p and HAGLROS expression in HCC. Furthermore, the inhibitory effects of HAGLROS knockdown on cell malignant behaviors were impaired due to the reduction of miR-26b-5p expression. That is to say, HAGLROS could exert tumor-promoting role in HCC by sponging miR-26b-5p. A similar document found that interference of HAGLROS repressed the proliferation and induced the apoptosis of ovarian cancer cells by targeting miR-26b-5p [Citation38]. However, the effects of HAGLROS on cell migration and invasion, and tumor growth were not investigated. Moreover, the downstream targets of miR-26b-5p and its correlation with HAGLROS were not reported.
Karyopherin α2 (KPNA2), a member of the nuclear transporter family, has been found to be overexpressed in a variety of cancer forms, and accelerate tumor formation and progression via influencing cell differentiation, proliferation, apoptosis, immune response, and viral infection [Citation39,Citation40]. An integrated bioinformatic analysis provided comprehensive and accurate evidence for using KPNA2 as a diagnostic and prognostic biomarker in HCC patients [Citation41]. Yang et al. uncovered the up-regulation of KPNA2 in HCC, and knockdown of KPNA2 led to the inhibition of cell proliferation, as well as the promotion of cell cycle arrest and apoptosis [Citation42]. Guo et al. revealed that KPNA2 expression was increased in HCC tissues and associated with a poor prognosis. Moreover, silencing of KPNA2 repressed migration and proliferation capacities of HCC cells [Citation43]. All these findings indicated the oncogenicity of KPNA2 in HCC. Similarly, increased KPNA2 expression was observed in our HCC patients. Interestingly, KPNA2 was proved as a downstream target of miR-26b-5p. Consistently, a previous report demonstrated KPNA2 as a relevant target for miR-26b-5p in Burkitt lymphoma cells [Citation44]. More importantly, HAGLROS could act as a sponge for miR-26b-5p to facilitate the expression of KPNA2. And, the anti-cancer activity caused by HAGLROS knockdown was obviously eliminated due to the recovery of KPNA2 expression. We deduced from the above data that HAGLROS promoted HCC progression via regulating miR-26b-5p/KPNA2.
Through KEGG analysis of KPNA2 similar genes in HCC from GEPIA and UALCAN, cell cycle and p53 signaling were found to be significantly enriched, which was consistent with the previous document [Citation42]. Lin et al. found that knockdown of KPNA2 suppressed cell migration and cisplatin resistance in oral squamous cell carcinoma by altering the autophagy level via mediating p53 nucleocytoplasmic translocation [Citation23]. Shi et al. revealed that KPNA2 promoted the proliferation, migration, and invasion of bladder cancer cells through inactivating the p53 pathway. In this study, we found that miR-26b-5p could activate p53 signaling by targeting KPNA2. Furthermore, knockdown of HAGLROS activated p53 signaling through regulating miR-26b-5p/KPNA2. Therefore, it could be inferred that HAGLROS contributed to the malignant characteristics of HCC by competitively binding to miR-26b-5p to up-regulate KPNA2 expression and inactivate p53 signaling.
Conclusion
To sum up, HAGLROS served as a oncogenic lncRNA in HCC by sustaining cell proliferation, migration, invasion and EMT. HAGLROS targeted miR-26b-5p to enhance KPNA2 expression and inhibit p53 signaling, finally promoting cell malignant phenotypes in vitro and tumor growth in vivo. This study elucidates a novel ‘HAGLROS-miR-26b-5p-KPNA2-p53’ interaction network in HCC (). Although lncRNA-based therapies have not yet reached clinical practice, our findings provide more reliable evidence for the potential application of HAGLROS as a prognostic biomarker and therapeutic target for HCC.
Highlights
Higher HAGLROS expression is observed in HCC tissues and cells.
Silencing HAGLROS inhibits HCC cell proliferation and metastasis but induces apoptosis.
HAGLROS targets miR-26b-5p/KPNA2 to inactivate p53 signaling in HCC.
HAGLROS exerts a carcinogenic effect in HCC by targeting miR-26b-5p/KPNA2/p53 axis.
Author contribution
Huibo Zhao and Guoyong Chen are in charge of conceiving design. Gaofeng Tang and Sidong Wei perform bioinformatic analysis. Zhantao Xie is responsible for collecting and interpreting data. Gaofeng Tang and Huibo Zhao conducted the experiments and wrote the draft. All authors reviewed and approved the final version.
Supplemental Material
Download PDF (483.7 KB)Disclosure statement
No potential conflict of interest was reported by the author(s).
Supplementary material
Supplemental data for this article can be accessed here.
Additional information
Funding
References
- Sung H, Ferlay J, Siegel RL, et al. Global cancer statistics 2020: GLOBOCAN estimates of incidence and mortality worldwide for 36 cancers in 185 countries. CA Cancer J Clin. 2021;71(3):209–249.
- Mittal S, El-Serag HB. Epidemiology of hepatocellular carcinoma: consider the population. J Clin Gastroenterol. 2013;47(Supplement 1):S2–6.
- Petrick JL, Florio AA, Znaor A, et al. International trends in hepatocellular carcinoma incidence, 1978-2012. Int J Cancer. 2020;147(2):317–330.
- Petrick JL, McGlynn KA. The changing epidemiology of primary liver cancer. Curr Epidemiol Rep. 2019;6(2):104–111.
- Jindal A, Thadi A, Shailubhai K. Hepatocellular carcinoma: etiology and current and future drugs. J Clin Exp Hepatol. 2019;9(2):221–232.
- Siegel RL, Miller KD, Jemal A. Cancer statistics, 2020. CA Cancer J Clin. 2020;70(1):7–30.
- Ozakyol A. Global Epidemiology of hepatocellular carcinoma (HCC Epidemiology). J Gastrointest Cancer. 2017;48(3):238–240.
- Jain S, Thakkar N, Chhatai J, et al. Long non-coding RNA: functional agent for disease traits. RNA Biol. 2017;14(5):522–535.
- Sanchez Calle A, Kawamura Y, Yamamoto Y, et al. Emerging roles of long non-coding RNA in cancer. Cancer Sci. 2018;109(7):2093–2100.
- Rao AKDM, Rajkumar T, Mani S. Perspectives of long non-coding RNAs in cancer. Mol Biol Rep. 2017;44(2):203–218.
- Mai H, Zhou B, Liu L, et al. Molecular pattern of lncRNAs in hepatocellular carcinoma. J Exp Clin Cancer Res. 2019;38(1):198.
- Lim LJ, Wong SYS, Huang F, et al. Roles and regulation of long noncoding RNAs in hepatocellular carcinoma. Cancer Res. 2019;79(20):5131–5139.
- Wang YG, Wang T, Shi M, et al. Long noncoding RNA EPB41L4A-AS2 inhibits hepatocellular carcinoma development by sponging miR-301a-5p and targeting FOXL1. J Exp Clin Cancer Res. 2019;38(1):153.
- Feng Y, Wei G, Zhang L, et al. LncRNA DARS-AS1 aggravates the growth and metastasis of hepatocellular carcinoma via regulating the miR-3200-5p-Cytoskeleton associated protein 2 (CKAP2) axis. Bioengineered. 2021;12(1):8217–8232.
- Chen JF, Wu P, Xia R, et al. STAT3-induced lncRNA HAGLROS overexpression contributes to the malignant progression of gastric cancer cells via mTOR signal-mediated inhibition of autophagy. Mol Cancer. 2018;17(1):6.
- Chen Y, Shen T, Ding X, et al. HAGLROS is overexpressed and promotes non-small cell lung cancer migration and invasion. Jpn J Clin Oncol. 2020;50(9):1058–1067.
- Yang M, Zhai Z, Zhang Y, et al. Clinical significance and oncogene function of long noncoding RNA HAGLROS overexpression in ovarian cancer. Arch Gynecol Obstet. 2019;300(3):703–710.
- Zhou K, Xu J, Yin X, et al. Long noncoding RNA HAGLROS promotes cell invasion and metastasis by sponging mir-152 and upregulating ROCK1 expression in osteosarcoma. Comput Math Methods Med. 2020;2020:7236245.
- Wei H, Hu J, Pu J, et al. Long noncoding RNA HAGLROS promotes cell proliferation, inhibits apoptosis and enhances autophagy via regulating miR-5095/ATG12 axis in hepatocellular carcinoma cells. Int Immunopharmacol. 2019;73:72–80.
- López-Urrutia E, Bustamante Montes LP, Ladrón de Guevara Cervantes D, et al. Crosstalk between long non-coding RNAs, micro-RNAs and mRNAs: deciphering molecular mechanisms of master regulators in cancer. Front Oncol. 2019;9:669.
- Han TS, Hur K, Cho HS, et al. Epigenetic associations between lncRNA/circRNA and miRNA in hepatocellular carcinoma. Cancers (Basel). 2020;12(9):2622.
- Livak KJ, Schmittgen TD. Analysis of relative gene expression data using real-time quantitative PCR and the 2−ΔΔCT method. Methods. 2001;25(4):402–408.
- Lin F, Gao L, Su Z, et al. Knockdown of KPNA2 inhibits autophagy in oral squamous cell carcinoma cell lines by blocking p53 nuclear translocation. Oncol Rep. 2018;40(1):179–194.
- Shi C, Sun L, Liu S, et al. Overexpression of karyopherin subunit alpha 2 (KPNA2) predicts unfavorable prognosis and promotes bladder cancer tumorigenicity via the p53 pathway. Med Sci Monit. 2020;26:e921087.
- Chen L, Dzakah EE, Shan G. Targetable long non-coding RNAs in cancer treatments. Cancer Lett. 2018;418:119–124.
- Gutschner T, Richtig G, Haemmerle M, et al. From biomarkers to therapeutic targets-the promises and perils of long non-coding RNAs in cancer. Cancer Metastasis Rev. 2018;37(1):83–105.
- Klingenberg M, Matsuda A, Diederichs S, et al. Non-coding RNA in hepatocellular carcinoma: mechanisms, biomarkers and therapeutic targets. J Hepatol. 2017;67(3):603–618.
- Liao HT, Huang JW, Lan T, et al. Identification of the aberrantly expressed lncRNAs in hepatocellular carcinoma: a bioinformatics analysis based on RNA-sequencing. Sci Rep. 2018;8(1):5395.
- Shu L, Guo K, Lin ZH, et al. Long non-coding RNA HAGLROS promotes the development of diffuse large B-cell lymphoma via suppressing miR-100. J Clin Lab Anal. 2022;36(1):e24168.
- Noh JH, Kim KM, McClusky WG, et al. Cytoplasmic functions of long noncoding RNAs. Wiley Interdiscip Rev RNA. 2018;9(3):e1471.
- Zhou A, Chen G, Cheng X, et al. Inhibitory effects of miR‑26b‑5p on thyroid cancer. Mol Med Rep. 2019;20(2):1196–1202.
- Miyamoto K, Seki N, Matsushita R, et al. Tumour-suppressive miRNA-26a-5p and miR-26b-5p inhibit cell aggressiveness by regulating PLOD2 in bladder cancer. Br J Cancer. 2016;115(3):354–363.
- Jia CM, Tian YY, Quan LN, et al. miR-26b-5p suppresses proliferation and promotes apoptosis in multiple myeloma cells by targeting JAG1. Pathol Res Pract. 2018;214(9):1388–1394.
- Yi L, Liu Y, Xu A, et al. MicroRNA-26b-5p suppresses the proliferation of tongue squamous cell carcinoma via targeting proline rich 11 (PRR11). Bioengineered. 2021;12(1):5830–5838.
- Wang Y, Sun B, Sun H, et al. Regulation of proliferation, angiogenesis and apoptosis in hepatocellular carcinoma by miR-26b-5p. Tumour Biol. 2016;37(8):10965–10979.
- Wang Y, Sun B, Zhao X, et al. Twist1-related miR-26b-5p suppresses epithelial-mesenchymal transition, migration and invasion by targeting SMAD1 in hepatocellular carcinoma. Oncotarget. 2016;7(17):24383–24401.
- Han W, Li N, Liu J, et al. MicroRNA-26b-5p enhances T cell responses by targeting PIM-2 in hepatocellular carcinoma. Cell Signal. 2019;59:182–190.
- Zhu L, Zhu L. Interference of long non-coding RNA HAGLROS inhibits the proliferation and promotes the apoptosis of ovarian cancer cells by targeting miR-26b-5p. Exp Ther Med. 2021;22(2):879.
- Han Y, Wang X. The emerging roles of KPNA2 in cancer. Life Sci. 2020;241:117140.
- Christiansen A, Dyrskjøt L. The functional role of the novel biomarker karyopherin α 2 (KPNA2) in cancer. Cancer Lett. 2013;331(1):18–23.
- Hua S, Ji Z, Quan Y, et al. Identification of hub genes in hepatocellular carcinoma using integrated bioinformatic analysis. Aging (Albany NY). 2020;12(6):5439–5468.
- Yang Y, Guo J, Hao Y, et al. Silencing of karyopherin α2 inhibits cell growth and survival in human hepatocellular carcinoma. Oncotarget. 2017;8(22):36289–36304.
- Guo X, Wang Z, Zhang J, et al. Upregulated KPNA2 promotes hepatocellular carcinoma progression and indicates prognostic significance across human cancer types. Acta Biochim Biophys Sin (Shanghai). 2019;51(3):285–292.
- Niu F, Kazimierska M, Nolte IM, et al. The miR-26b-5p/KPNA2 axis is an important regulator of Burkitt lymphoma cell growth. Cancers (Basel). 2020;12(6):1464.