
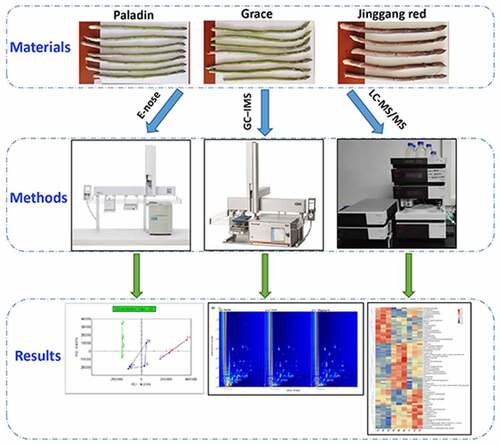
ABSTRACT
Asparagus (A. officinalis L.) is a perennial herb of the genus Asparagus that is rich in nutrients. This study aimed to distinguish three cultivars of asparagus (Paladin, Grace, and Jinggang red) based on their volatile organic compounds (VOCs) and metabolic profiles. VOCs in the three cultivars were separated and identified using electronic nose (E-nose) and gas chromatography–ion mobility spectrometry (GC–IMS). Differences in metabolites among the three cultivars were analyzed using liquid chromatography-tandem mass spectrometry (LC-MS/MS). E-nose and GC-IMS showed that the VOCs in asparagus differed significantly among the three groups. E-nose result showed that purple asparagus (Jinggang red) was connected to a stronger earthy odor; green asparagus (Paladin and Grace) were shown characteristic dill flavor. Moreover, 50 VOCs were detected by using GC–IMS. Ketones and alcohols were most abundant in Paladin; methyl benzoate and dimethyl sulfide were most abundance in Grace; aldehydes and acids were most abundance in Jinggang red. Moreover, 130 and 71 different metabolites were detected in the positive and negative modes among three cultivars, such as quercetin and rutin. Functional analysis revealed that these metabolites were involved in beta-alanine metabolism and ATP-binding cassette (ABC) transporters. In summary, E-nose combined with GC-IMS and LC-MS/MS methods has good application prospects in evaluating and identifying VOCs and metabolites of different cultivars of asparagus. The identified VOCs and metabolites can provide guidelines for the development of functional asparagus products.
GRAPHICAL ABSTRACT
Introduction
Asparagus (Asparagus officinalis L.) is a perennial herb of the genus Asparagus, which is also known as ‘the king of vegetables’ [Citation1]. It is rich in bioactive compounds and is eaten in most countries around the world [Citation2]. The spears of asparagus have different colors, such as green, white, and purple, which reflect the differences in polyphenol content and extract bioactivity [Citation3]. Purple asparagus, given its color by anthocyanin pigments, has stronger antioxidant activity than green or white cultivar [Citation4], while green asparagus is known for its wide distribution and abundance of bioactive substances [Citation5]. Moreover, asparagus is widely used as a medicinal plant. Xue et al. [Citation6] revealed that asparagus significantly inhibited cell proliferation and tumor growth in a mouse model of breast cancer. Sung et al. [Citation7] indicated that saponins extracted from asparagus can be used as effective anti-inflammatory drugs for asthma treatment. Therefore, it is necessary to comprehensively evaluate asparagus to obtain additional bioactive compounds with practical value.
In recent years, studies have reported on the metabolic profiles of asparagus, revealing differences in metabolomics between green and white spears of asparagus. Green spears mainly contained aldehydes and phenols, whereas white spears mainly contained benzenes, steroidal saponins, and unsaturated aldehydes [Citation8]. The main differences in taste are that green asparagus is grassy and bitter, whereas white asparagus is similar to sweet corn, potatoes, and butter [Citation9,Citation10]. These differences in taste could be partially caused by the identified specific differential metabolites. Moreover, metabolites such as caffeyl hexose, ferulic hexose, and neochlorogenic acid are characteristic chemical markers for the identification of different parts of asparagus [Citation11]. Owing to the unique biological processes occurring in specific areas of the spear, the differences in the metabolites in each part of asparagus are mainly affected by growth conditions (such as soil and light). Volatile organic compounds (VOCs) constitute the aroma characteristics, which are key determinants of flavor in asparagus [Citation12]. Several specific VOCs, such as methional, 2-methoxy-3-isopropyl pyrazine, and dimethyl sulfide, are considered key odorants and are used as industrial references for the odor quality of asparagus [Citation8]. However, phytochemical characteristics, especially the differences in VOCs and metabolic profiles between purple and green asparagus, have rarely been investigated.
The electronic nose (E-nose) is widely used as an instrument for analyzing food flavor [Citation13]. It is characterized by its low cost and high degree of automation and can provide overall VOCs and flavor information through sample detection [Citation14]. Gas chromatography-ion mobility spectrometry (GC–IMS) is also commonly used for food flavor analysis, especially for VOC separation and detection [Citation15]. It can effectively and intuitively distinguish the differences in flavor between products. Generally, GC-IMS combined with E-nose technology can establish the fingerprint and radar spectrum of VOCs, which can be used to compare samples intuitively. Moreover, high-performance liquid chromatography coupled with tandem mass spectrometry (LC-MS/MS) analysis has been confirmed as a suitable methodology for obtaining the metabolite profiles of asparagus [Citation16]. It is a specific and sensitive method for the determination of metabolites. However, few studies have applied a combination of E-nose, GC-IMS, and LC-MS/MS to distinguish and evaluate asparagus cultivars.
In this study, we aimed to analyze and assess the flavor profiles of two green asparagus cultivars (Paladin and Grace) and one purple cultivar (Jinggang red). Based on appearance quality and nutrient composition, the difference of VOCs was compared using E-nose and GC-IMS. Furthermore, we determined their metabolic profiles using LC-MS/MS analysis. We demonstrated that the combination of these three detection methods could distinguish different varieties of asparagus. The findings of this study will deepen our understanding of the differences in flavor and metabolites between green and purple asparagus, which will guide the improvement of the edible value of asparagus.
Materials and methods
Sample collection
Samples of three asparagus cultivars (Paladin, Grace, and Jinggang red) were collected from the Dongyang Experimental Base of Shanxi Agricultural University (Jinzhong, Shanxi, China); they were planted on 20 June 2019 and harvested on 15 April 2021. Subsequently, spears with lengths of 25–26 cm from the top and with uniform thickness were selected for further study. Then, samples were shredded and stored at either 4°C for sensory evaluation using E-nose and GC-IMS or −80°C for LC-MS/MS.
Sensory evaluation
The water state and soluble sugar content were detected as previously described [Citation17]. The colors of the three cultivars were determined as previously reported [Citation18]. In brief, an SC-80C colorimeter was used to detect color with a white board as the standard, at room temperature. The L*, a*, and b* values were measured in reflection mode, where L* is brightness, a* is the degree of green, and b* is the degree of yellow. The color contribution index (CCI) was calculated using the following formula: CCI = (1000 × a*)/(L* × b*). In addition, the anti-oxidative ability was tested as previously described [Citation18], including 2,2-diphenyl-1-picrylhydrazyl (DPPH·) clearance rate, hydroxyl radical (·OH) clearance rate, Fe(2+)-chelating power, and deoxidization. The adsorption capacities of sodium glycocholate and sodium deoxycholate were also determined.
E-nose analysis
The volatile compounds of the three different kinds of asparagus were explored using the ultrafast gas-phase E-nose Heracles II (Alpha MOS, Inc., Toulouse, France). This system includes two chromatographic columns, MXT-5, a nonpolar gas chromatographic column, and MXT-1701, a weakly polar gas chromatographic column equipped with two flame ionization detectors (FIDs), with diameters of 18 μm and lengths of 10 m. E-nose analysis was performed according to the method described by Luo et al. [Citation19] with slight modifications. In brief, asparagus samples (5.0 g) were placed in a 20 mL headspace bottle and equilibrated at 80°C for 20 min. An autosampler was used to inject the samples at a rate of 250 μL/s within 25s. The injection volume was 5000 μL and the inlet temperature was 200°C. Next, from an initial temperature of 20°C to a final temperature of 240°C, the analytes were collected at a split rate of 10 mL/min within 30s. The initial temperature of the analytical column was maintained at 50°C for 30s, and then the heating process was divided into the following two parts: increased to 80°C at a rate of 1.0°C/s and increased to 250°C at a rate of 1.5°C/s; then, the samples were maintained at 250°C for another 17s (total 190s). Moreover, the temperature and gain of the FID were 260°C and 12, respectively. Each sample was detected three times.
Headspace GC-IMS (HS-GC-IMS)
The VOCs of the three cultivars of asparagus were measured using a FlavourSpec® analyzer (Hanon Instruments Co., Ltd., Shandong, China). A detailed description of this assay has been provided in a previous study [Citation20]. Asparagus samples (3.0 g) were added to a 20 mL headspace bottle and incubated for 15 min at 70°C. After incubation, the detected samples (300 μL) were automatically injected into an MXT-5 column (15 m × 0.53 mm ID, 1 μm) to separate the VOCs. Nitrogen (99.99%) was used as a carrier gas with the following programmed flow rates: 2 mL/min for 2 min and then raised to 100 mL/min within 18 min. The VOCal software equipped with this equipment was used for data collection and qualitative analyses. Three plug-ins (Reporter, Gallery Plo, and Dynamic PCA) were applied for sample fingerprint comparison and difference analysis.
Untargeted LC-MS/MS analysis
Furthermore, the metabolic profile of asparagus was determined using untargeted LC-MS/MS analysis according to the description of a previous study [Citation21]. After grinding, 400 μL of pre-cooled methanol/acetonitrile/water solution (4:4:2, v/v) was added to the samples, vortexed, and incubated at −20°C for 60 min. The mixed samples were centrifuged at 14,000 × g for 20 min at 4°C. The supernatant was vacuum-dried and then re-dissolved in 100 μL of acetonitrile/water solution (1:1, v/v) for further metabolic analyses. In addition, quality control samples were prepared by mixing all samples in equal quantities.
Chromatographic separation was conducted on an ACQUITY UPLC BEH C18 column (100 mm × 2.1 mm, 1.7 μm, Waters, USA) with 0.1% formic acid as mobile phase A and acetonitrile as mobile phase B. The column temperature was 40°C and the flow rate was 0.3 mL/min. The following parameters were used for gradient elution: 0–0.5 min, 5% B; 0.5–1.0 min, 5% B; 1.0–9.0 min, 5–100% B; 9.0–12.0 min. 100% B; 12.0–15.0 min, 5% B. The indoor temperature was set to 4°C and the injection volume of each sample was 5 μL.
The mass spectrometer was run in the electrospray ionization (ESI) method in the positive and negative modes. The samples were separated by UHPLC and analyzed using a Q-Exactive quadrupole-electrostatic orbitrap high-resolution mass spectrometer (Thermo Fisher Scientific). The ESI source conditions were as follows: ion source gas 1, 60 psi; ion source gas 2, 60 psi; curtain gas, 30 psi; source temperature, 320°C; and ion spray voltage floating, 3500 V for the positive mode and −3500 V for the negative mode. The secondary mass spectrum was acquired by information-dependent acquisition (IDA) in high-sensitivity mode. The declustering potential was DP ± 60 V and the collision energy was 35 ± 15 eV (negative and positive modes).
The raw data collected by LC-MS/MS analysis were preprocessed using Compound Discoverer software (version 3.0), including peak extraction, peak alignment, correction, and standardization. The clean data were analyzed using SIMCA-P 14.1 (Umetrics, Umea, Sweden). The dispersion and clustering of all samples were estimated using a principal component analysis (PCA) plot. The samples were classified by partial least-squares discriminant analysis (PLS-DA) and orthogonal partial least-squares discriminant analysis (OPLS-D), and the quality of these two plots was assessed using two indices: Q2 and R2. R2 > 0.05 and Q2 > 0.05 indicate that the models were robust and reliable. Furthermore, the differential metabolites between groups were determined by variable importance for the projection (VIP) and P values obtained from the OPLS-DA and Student’s t-test, respectively. A VIP > 1 (P < 0.05) was considered statistically significant. The pathways involved in the identified metabolites were predicted by mapping them to the Kyoto encyclopedia of genes and genomes (KEGG) database, and the results were visualized in a bubble plot.
Statistical analysis
All experiments were performed in triplicate and statistical analysis was conducted using one-way analysis of variance using the SPSS software. All data are presented as mean ± standard deviation. Statistical significance was set at P < 0.05.
Results and discussion
The purpose of this study was to measure the VOCs in three cultivars of asparagus using E-nose and GC-IMS and then screen the key metabolites using LC-MS/MS. First, the overall information on VOCs in each asparagus was detected by the E-nose. Second, the VOCs fingerprint of three cultivars was constructed, and differences in characteristic VOCs between Paladin, Grace, and Jinggang red were identified. Finally, metabolic profile of three cultivars of asparagus was established, and different metabolites between asparagus were screened.
Sensory evaluation for each asparagus sample
To comprehensively compare the differences between the three cultivars of asparagus, we first conducted a sensory evaluation. The specific appearance, quality, and nutrient composition of the three cultivars of asparagus are listed in . The branch length of Paladin was longer than those of Grace and Jinggang red (44.79 ± 5.23% vs. Grace 26.86 ± 2.622% and Jinggang red 20.75 ± 3.11%). Odor evaluation showed that Paladin and Jinggang red had stronger fragrances; Paladin and Grace had a slight vegetal aroma. Jinggang red had the highest soluble solid content (4.9 ± 0.1% vs. Paladin 4.0 ± 0.0% and Grace 4.0 ± 0.0%), and Paladin had the highest juice yield (50.43 ± 2.46% vs. Grace 35.48 ± 1.75% and Jinggang red 41.64 ± 2.12%). The purple asparagus cultivar, Jinggang red, had the highest content of sugar (34.15 ± 0.24% vs. Paladin 29.60 ± 0.47% and Grace 18.78 ± 0.74%) and anthocyanidin (5.89 ± 0.17% vs. Paladin 0.13 ± 0.00% and Grace 0.56 ± 0.02%). Consistent with the results of other studies, the amount of anthocyanidin in green spears was low. In addition, purple asparagus is believed to have a higher anthocyanidin content than green or white asparagus, resulting in increased antioxidant activity [Citation4]. We also revealed that Jinggang red had highest antioxidant activity than other two cultivars in this study. Moreover, most anthocyanin-related biosynthetic genes are significantly different between purple and green cultivars [Citation22]. Previous results showed that asparagus had some lipid-lowering abilities, especially in the purple cultivar; the by-products of asparagus significantly reduced body weight, the levels of total cholesterol and low-density lipoprotein cholesterol in mice fed with high-fat diet [Citation23]. Guo et al. [Citation24] also revealed that asparagus had a lipid-lowering effect by regulating the gut microecology in models of mice fed a high-fat diet. Therefore, differences in chemical properties and flavors may lead to differences in taste and function among asparagus. Further, we explored the differences in VOCs among different kinds of asparagus.
Table 1. Comparison of appearance quality and nutrient composition among three cultivars of asparagus
E-nose analysis
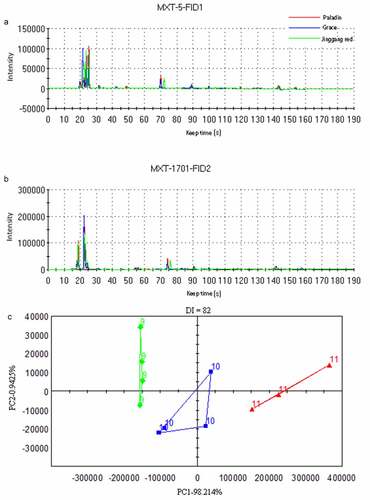
The flavor profiles of the three cultivars were analyzed using E-nose, and the gas chromatograms of two columns (MXT-5 and MXT-1701) are shown in , respectively. We observed that Jinggang red was different from other groups, but Paladin and Grace had similar chromatograms. Based on the signal intensity, a PCA plot was generated (). Principal component 1 (PC1) was the most important component, accounting for 98.214% of total variance. The samples in the three groups were significantly separated. In addition, discrimination index value for PCA plot was 82, indicating that the distinction between samples was effective.
Figure 1. Volatile organic compounds (VOCs) of three cultivars of asparagus identified by electronic nose (E-nose).
Meanwhile, 11 VOCs were identified in the three asparagus cultivars via E-nose analysis (). Among these, Jinggang red might have highest abundances of propanal and 2-propenol, which was connected to a stronger earthy odor. Paladin might have highest abundances of 3-methylpentane, methyl methacrylate, 1-pentanethiol, and alpha-phellandrene. Grace had highest abundances of methylcyclopentane, 1,4-dioxane, nonane, 1S-alpha-pinene, and (+)-alpha-phellandrene. We observed green asparaguses were associated with accumulation of alpha-phellandrene, which was shown characteristic dill flavor [Citation25]. Kurt et al. [Citation26] showed that the hydrogen bonds and hydrophobicity between 1,4-dioxane and antioxidant enzymes (such as superoxide dismutase and catalase) resulted in a strong interaction and binding affinity; therefore, Grace may have higher clearance rates for DPPH· and ·OH may due to its higher 1,4-dioxane levels. Nevertheless, the unique flavor profiles of three asparagus cultivars have not been determined.
Table 2. VOCs detected by E-nose from three asparagus cultivars
Identification of VOCs between the three cultivars using HS-GC-IMS
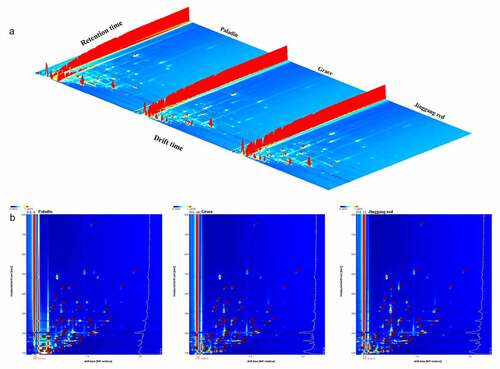
Then, the VOCs of three asparagus were also analyzed by HS-GC-IMS to determine the differences in flavor profiles. Three-dimensional (3D) topographic plots of three different asparagus is shown in . We assessed VOCs from three perspectives: retention time, drift time, and peak intensity. The number of VOCs and the signal intensity of the peaks differed slightly among the three samples. Moreover, a two-dimensional (2D) topographic spectrum (planform of the 3D plot) was also obtained (). In this plot, the red vertical line at the x-axis 1.0 is the reactive ion peak (RIP, normalized) and each node represents a VOC. In the asparagus samples, many VOCs were concentrated in the area with a drift time of 1.0–1.5 s and retention time of 100–500 s. Meanwhile, the spectral signals were marked by numbers.
Figure 2. (a) Three- and (b) two-dimensional topographic spectra of VOCs in asparagus detected by HS-GC-IMS.
A total of 50 VOCs were detected among the three cultivars of asparagus, including 23 aldehydes, 11 alcohols, two esters, two acids, seven ketones, three terpenes, one furan, and one ether. The specific characteristics of each VOC are listed in . The fingerprint of VOCs corresponding to each sample was displayed in . In brief, the level of aldehydes (decanal and nonanal), alcohols (1-heptanol, 1-hexanol-D, and ethanol-D), ketones (2-pentanone, 2-butanone-D, and acetone), and ethyl acetate were highest in Paladin than in other cultivars. The level of aldehydes (benzaldehyde and acetal), isopentanol, 2-propanol, methyl benzoate, styrene, dimethyl sulfide, and acetoin were highest in Grace than in other cultivars. Moreover, the levels of aldehydes ((E)-2-octenal, octanal, benzeneacetaldehyde, (E)-2-heptenal, heptanal, hexanal, (E)-2-pentenal, pentanal, and 3-methylbutanal), 1-octen-3-ol, acids (pentanoic acid and isovaleric acid), 2-heptanone, (E,E)-2,4-heptadienal, and 2-pentylfuran were highest in Jinggang red than in other cultivars.
Table 3. Gas chromatography-ion mobility spectrometry (GC-IMS) integration parameters of VOCs in asparagus samples
Figure 3. Gallery plot for three asparagus cultivar samples.
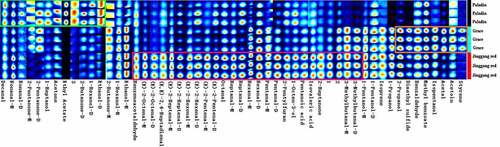
Unlike the overall information on VOC in asparagus provided by the E-nose, GC–IMS could provide the specific volatile profile of each sample. In particular, the GC-IMS can intuitively and accurately distinguish the differences in characteristics of the VOCs between samples, which provided useful information for in-depth flavor research [Citation27]. Meanwhile, we used a gallery plot to compare the differences in VOCs between different cultivars. Several VOCs with strong signal intensities were detected in Paladin, specially, decanal, 1-heptanol, ethanol, and ethyl acetate. A previous study indicated that characteristic aroma compounds, such as decanal, isolated from sweet orange oil constituted the flavor component of citrus; in addition, experimental results revealed that decanal had antioxidant and antibacterial properties [Citation28]. Decanal, 1-heptanol, and ethyl acetate also have antimicrobial activities, which account for several human health benefits [Citation29,Citation30]. Moreover, alcohols are produced by lipid oxidation and contribute little to the flavor profile of foods due to their high odor thresholds [Citation31]. The levels of specific VOCs, such as methyl benzoate and dimethyl sulfide were highest in the Grace samples. Methyl benzoate is used as a spice and flavor enhancer owing to its pleasant aroma [Citation32]; dimethyl sulfide is an effective odorant responsible for the flavor of a variety of foods particularly asparagus and cabbage [Citation33]. This findings were also revealed by our analysis that Grace had a higher content of slight vegetal aroma than Paladin and Jinggang red. Furthermore, Jinggang red had higher level of aldehydes, acids (pentanoic acid and isovaleric acid), and ether (dimethyl sulfide) than others. These aldehydes have been identified in asparagus. Among these, benzeneacetaldehyde, octanal, and 3-methylbutanal are regarded as vegetable VOCs, and their aroma are associated with floral, fruity, and fresh [Citation8,Citation34]. These two acids were first reported in asparagus. Isovaleric acid has been determined in Hibiscus tea and its aroma attribute is cranberry-like flavor, which may cause the tea to have a deep red color [Citation35]. Therefore, we speculated that the differences in VOCs may contribute to the unique flavor of each asparagus. However, the correlation between E-nose and GC-IMS is not performed, which will be the direction of our further research.
Differences in metabolite profiles between three cultivars detected by untargeted LC-MS/MS
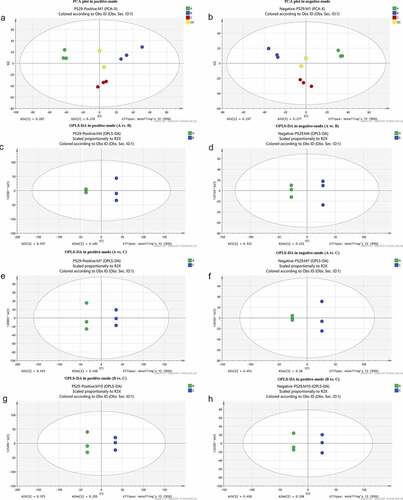
To explore the metabolite profiles of the three cultivars of asparagus (n = 3 each), an untargeted LC-MS/MS analysis was performed. PCA plots showed a clear separation among Paladin, Grace, and Jinggang red in both the positive () and negative modes (). Result showed that PC1 differentiated samples according to the cultivars. We also compared the three samples in pairs (Paladin vs. Grace, Grace vs. Jinggang red, and Paladin vs. Jinggang red). There were clear differences in the OPLS-DA results for each comparison group. Specifically, Paladin could be significantly distinguished from Grace (R2Y = 1 and Q2 = 0.989 in positive mode; R2Y = 1 and Q2 = 0.605 in negative mode; ). Paladin could be readily distinguished from Jinggang red (R2Y = 1 and Q2 = 0.627 in positive mode; R2Y = 1 and Q2 = 0.992 in negative mode; ). Grace could be separated from Jinggang red (R2Y = 1 and Q2 = 0.706 in positive mode; R2Y = 1 and Q2 = 0.993 in negative mode; ), indicating that our data analysis was reliability.
Figure 4. Metabolite profiles of Paladin, Grace, and Jinggang red samples detected by LC-MS/MS.
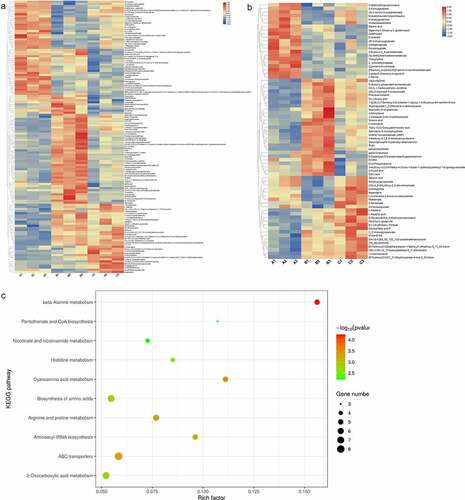
Next, we identified differential metabolites among the three cultivars. In total, 130 different metabolites were obtained in the positive mode () and 71 in the negative mode (). The list of each different metabolite in the positive and negative modes is presented in Tables S1 and S2, respectively. In the positive mode, N-acetyl-d-sphingosine, quercetin, rutin, 3-hydroxypicolinic acid, and N1-acetylspermidine with lower P value were considered to be important metabolites. In the negative mode, 2-(beta-d-glucosyl)-sn-glycerol, (-)-jasmonic acid, 10(E), 2,3-dimethylmaleate, and ureidoglycine with lower P values were regarded as important metabolites. Pathway analysis showed that these metabolites were significantly enriched in 10 KEGG pathways, including beta-alanine metabolism, ABC transporters, and cyanoamino acid metabolism ().
Figure 5. Results of identified different metabolites.
Some metabolites, such as quercetin and rutin, were upregulated in Grace samples. Quercetin and rutin are polymeric polyphenols that exert protective effects against alcohol-induced liver injury [Citation36]. Quercetin is the most abundant flavonoid with antioxidant and antitumor effects [Citation37]; rutin, the main polyphenol compound found in the spears of green asparagus, is a flavonoid derivative of quercetin [Citation38]. Notably, ureidoglycine and asparagine were upregulated in the Jinggang red samples. Asparagine has been detected in asparagus during leaf senescence and in harvested spears, suggesting that it responds to senescence signals and carbohydrates [Citation39]. In addition, asparagine synthesis-related genes may regulate sugar content in asparagus [Citation17]. We found that the total sugar content in Jinggang red was highest than that in others, which may be associated with the upregulation of asparagine.
We also explored the functional pathways of these metabolites. The results showed that these metabolites were significantly involved in metabolism-related pathways, such as beta-alanine metabolism, ABC transporters, and cyanoamino acid metabolism. Beta-alanine is a popular dietary supplement for competitive athletes and is associated with improved motor homeostasis and reduced neuromuscular fatigue [Citation40,Citation41]. Fermented Huyou juice can alleviate obesity by regulating several pathways, including ABC transporters [Citation42]. However, the specific functions of these pathways in asparagus require further investigation.
Conclusion
This study is the first to comprehensively investigate the differences in VOCs and metabolomics between green (Paladin and Grace) and purple (Jinggang red) asparagus via combination of E-nose, GC-IMS, and LC-MS/MS. The VOCs fingerprint of three asparagus was established. The characteristic VOCs that may discriminate the unique flavors of each asparagus cultivar were also identified. Moreover, the metabolite profiles of Paladin, Grace, and Jinggang red were also constructed. Our study may confirm the potential applicability of the integration of three techniques for flavor evaluation in the food industry.
Supplemental Material
Download MS Word (33.4 KB)Disclosure statement
No potential conflict of interest was reported by the author(s).
Supplementary material
Supplemental data for this article can be accessed here
Additional information
Funding
References
- Zhang H, Birch J, Pei J, et al. Identification of six phytochemical compounds from Asparagus officinalis L. Root cultivars from New Zealand and China using UAE-SPE-UPLC-MS/MS: effects of extracts on H₂O₂-induced oxidative stress. Nutrients. 2019;11(1):107.
- Fan R, Yuan F, Wang N, et al. Extraction and analysis of antioxidant compounds from the residues of Asparagus officinalis L. J Food Sci Technol. 2015;52(5):2690–2700.
- Pegiou E, Mumm R, Acharya P, et al. Green and White Asparagus: a source of developmental, chemical and urinary intrigue. Metabolites. 2019;10(1):17.
- Sakaguchi Y, Ozaki Y, Miyajima I, et al. Major anthocyanins from purple asparagus (Asparagus officinalis). Phytochemistry. 2008;69(8):1763–1766.
- Vázquez-Castilla S, Jaramillo-Carmona S, Fuentes-Alventosa JM, et al. Saponin profile of green asparagus genotypes. J Agric Food Chem. 2013;61(46):11098–11108.
- Xu G, Kong W, Fang Z, et al. Asparagus officinalis exhibits anti-tumorigenic and anti-metastatic effects in ovarian cancer. Front Oncol. 2021;11:688461.
- Sung J-E, Lee H-A, Kim J-E, et al. Saponin-enriched extract of Asparagus cochinchinensis alleviates airway inflammation and remodeling in ovalbumin-induced asthma model. Int J Mol Med. 2017;40(5):1365–1376.
- Pegiou E, Zhu Q, Pegios P, et al. Metabolomics reveals heterogeneity in the chemical composition of green and white spears of Asparagus (). Metabolites. 2021;11(10):708.
- Arana I, Ibañez FC, Torre P. Monitoring the sensory quality of canned white asparagus through cluster analysis. J Sci Food Agric. 2016;96(7):2391–2399.
- Nguyen TVL, Tran TYN, Lam DT, et al. Effects of microwave blanching conditions on the quality of green asparagus (Asparagus officinalis L.) butt segment. Food Sci Nutr. 2019;7(11):3513–3519.
- Zhang J, Zhang F, Li D, et al. Characterization of metabolite profiles of white and green spears of asparagus officinalis L. from Caoxian, East China. Food Res Int. 2020;128:108869.
- Mitchell SC. Food idiosyncrasies: beetroot and asparagus. Drug Metab Dispos. 2001;29(4 Pt 2):539–543.
- Wei L, Yuanyuan H, Yanping C, et al. Penaeus orientolis prawn freshness rapid determination method based on electronic nose and non-linear stochastic resonance technique. Bioengineered. 2015;6(1):42–52.
- Qiu S, Wang J. The prediction of food additives in the fruit juice based on electronic nose with chemometrics. Food Chem. 2017;230:208–214.
- Wang S, Chen H, Sun B. Recent progress in food flavor analysis using gas chromatography-ion mobility spectrometry (GC-IMS). Food Chem. 2020;315:126158.
- Jaiswal Y, Liang Z, Ho A, et al. A Comparative Tissue-specific Metabolite Analysis and Determination of Protodioscin Content in Asparagus Species used in Traditional Chinese Medicine and Ayurveda by use of Laser Microdissection, UHPLC-QTOF/MS and LC-MS/MS. Phytochem Anal. 2014;25(6):514–528.
- Davies KM, Seelye JF, Irving DE, et al. Sugar regulation of harvest-related genes in asparagus. Plant Physiol. 1996;111(3):877–883.
- Zhang L, Ding W, Han J, et al. Taste analysis of different kinds of asparagus using electronic tongue. Farm products processing. 2019;18(2):43–45.
- Luo X, Wei Z, Yu J, et al. Rapid identification between Litsea Cubeba and Piper Cubeba by gas phase electronic nose of Heracles II. Journal of Chengdu University (Natural Science Edition). 2018;37:34–37.
- Allers M, Langejuergen J, Gaida A, et al. Measurement of exhaled volatile organic compounds from patients with chronic obstructive pulmonary disease (COPD) using closed gas loop GC-IMS and GC-APCI-MS. J Breath Res. 2016;10(2):26004.
- Dagla I, Tsarbopoulos A, Gikas E. Design of experiments guided multivariate calibration for the quantitation of injectable colistimethate sodium by ultra performance liquid chromatography - High resolution mass spectrometry. Talanta. 2020;220:121406.
- Dong T, Han R, Yu J, et al. Anthocyanins accumulation and molecular analysis of correlated genes by metabolome and transcriptome in green and purple asparaguses (Asparagus officinalis, L.). Food Chem. 2019;271:18–28.
- Zhu X, Zhang W, Zhao J, et al. Hypolipidaemic and hepatoprotective effects of ethanolic and aqueous extracts from Asparagus officinalis L. by-products in mice fed a high-fat diet. J Sci Food Agric. 2010;90(7):1129–1135.
- Guo K, Xu S, Zhang Q, et al. Bacterial diversity in the intestinal mucosa of mice fed with Asparagus extract under high-fat diet condition. 3 Biotech. 2020;10(5):228.
- Castro-Alves V, Kalbina I, Nilsen A, et al. Integration of non-target metabolomics and sensory analysis unravels vegetable plant metabolite signatures associated with sensory quality: a case study using dill (Anethum graveolens). Food Chem. 2021;344:128714.
- Kurt D, Acar A, Çavuşoğlu D, et al. Genotoxic effects and molecular docking of 1,4-dioxane: combined protective effects of trans-resveratrol. Environ Sci Pollut Res Int. 2021;28(39):54922–54935.
- Tian X, Li ZJ, Chao YZ, et al. Evaluation by electronic tongue and headspace-GC-IMS analyses of the flavor compounds in dry-cured pork with different salt content. Food Res Int. 2020;137:109456.
- Liu K, Chen Q, Liu Y, et al. Isolation and biological activities of decanal, linalool, valencene, and octanal from sweet Orange oil. J Food Sci. 2012;77(11):C1156–C61.
- Chhikara N, Kour R, Jaglan S, et al. Citrus medica: nutritional, phytochemical composition and health benefits – a review. Food Funct. 2018;9(4):1978–1992.
- Khalfallah A, Berrehal D, Bensouici C, et al. Flavonoids, cytotoxic, antioxidant and antibacterial activities of Evax pygmaea. Pharm Biol. 2017;55(1):2292–2296.
- Al-Dalali S, Li C, Xu B. Effect of frozen storage on the lipid oxidation, protein oxidation, and flavor profile of marinated raw beef meat. Food Chem. 2021;376:131881.
- Effmert U, Saschenbrecker S, Ross J, et al. Floral benzenoid carboxyl methyltransferases: from in vitro to in planta function. Phytochemistry. 2005;66(11):1211–1230.
- Scherb J, Kreissl J, Haupt S, et al. Quantitation of S-Methylmethionine in Raw Vegetables and Green Malt by a Stable Isotope Dilution Assay Using LC-MS/MS: comparison with Dimethyl Sulfide Formation after Heat Treatment. J Agric Food Chem. 2009;57(19):9091–9096.
- Sumner LW, Amberg A, Barrett D, et al. Proposed minimum reporting standards for chemical analysis Chemical Analysis Working Group (CAWG) Metabolomics Standards Initiative (MSI). Metabolomics. 2007;3(3):211–221.
- Preciado-Saldaña AM, Abraham Domínguez-Avila J, Fernando Ayala-Zavala J, et al. Formulation and characterization of an optimized functional beverage from hibiscus (Hibiscus sabdariffa L.) and green tea (Camellia sinensis L.). Food Sci Technol Int. 2019;25(7):547–561.
- Lee S, Lee J, Lee H, et al. Relative protective activities of quercetin, quercetin-3-glucoside, and rutin in alcohol-induced liver injury. J Food Biochem. 2019;43(11):e13002.
- Volková M, Forstová-Krízová V, Skálová L, et al. Modulatory effects of quercetin and rutin on the activity, expression and inducibility of CYP1A1 in intestinal HCT-8 cells. Phytother Res. 2013;27(12):1889–1893.
- Soteriou GA, Antoniou C, Rouphael Y, et al. Changes in the primary and secondary metabolome of male green asparagus (Asparagus officinalis L.) as modulated by sequential harvesting. Food Chem. 2021;358:129877.
- Winichayakul S, Moyle RL, Ryan DJ, et al. Distinct cis-elements in the Asparagus officinalis asparagine synthetase promoter respond to carbohydrate and senescence signals. Funct Plant Biol. 2004;31(6):573–582.
- Milioni F, de Poli RAB, Saunders B, et al. Effect of β-alanine supplementation during high-intensity interval training on repeated sprint ability performance and neuromuscular fatigue. J Appl Physiol (1985). 2019;127(6):1599–1610.
- Blancquaert L, Everaert I, Derave W. Beta-alanine supplementation, muscle carnosine and exercise performance. Curr Opin Clin Nutr Metab Care. 2015;18(1):63–70.
- Yan X, Wang F, Weng P, et al. The effect of fermented Huyou juice on intestinal microbiota in a high-fat diet-induced obesity mouse model. J Food Biochem. 2020;44(12):e13480.