
ABSTRACT
This study was aimed to investigate the influence of miR-33-5p on the M1/M2 polarization of microglia and the underlying mechanism. Transcriptome sequencing was performed using microglia from miR-33-5p mimic and control groups. In total, 507 differentially expressed genes, including 314 upregulated genes and 193 downregulated genes, were identified. The subnetwork of module A, which was extracted from the protein–protein interaction networks, mainly contained the downregulated genes. Cdk1,Ccnb,and Cdc20, the members of module-A networks with the highest degrees, possess the potential of being biomarkers of ischemic stroke due to their function in the cell cycle. NFY, a transcription factor, was predicted to have the regulatory relation with nine downregulated genes. Overall, our findings will provide a valuable foundation for genetic mechanisms and treatment studies of ischemic stroke.
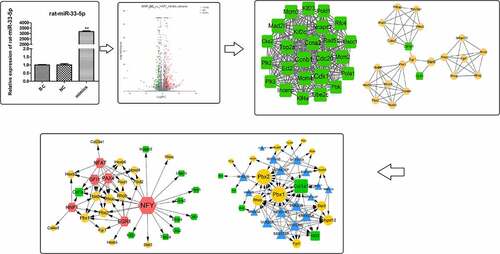
Graphic abstract
Highlights
PCA analysis showed significant differences between HAPI-mimic and blank control groups.
Cell cycle-related genes, such as Cdk1, Ccnb1, and Cdc20, were identified based on modularized genes.
The transcription factor NFY regulated nine downregulated genes.
Introduction
Cardiovascular and cerebrovascular diseases are common and serious threats to humans worldwide [Citation1]. Approximately 80 million people have experienced stroke, and more than 50 million survivors suffer from some form of permanent disability. Cerebral apoplexy is divided into ischemic stroke and hemorrhagic stroke, among which ischemic stroke is the most common [Citation2]. The morbidity, mortality, and recurrence rate of ischemic stroke are extremely high [Citation3]. The pathophysiological basis of ischemic stroke includes cell apoptosis, imbalance in body oxidation and antioxidation, toxicity effects of excitatory amino acids, and cell inflammation [Citation4]. In many neurodegenerative diseases, the inflammatory response is closely related to the activation and polarization of microglia [Citation5], a group of inflammatory cells [Citation6].
Microglia are the smallest cells in the central nervous system, with small nuclei and little cytoplasm [Citation7]. Microglia are mainly concentrated in the telencephalon, basal ganglia, olfactory bulb, and hippocampus, and are the brain’s inherent immune effector cells, participating in dynamic balance and host defense against pathogens and central nervous system diseases [Citation8]. Microglia are activated under pathological conditions, which are named polarization of microglia [Citation9]. Microglial activation is divided into two major phenotypes: classical activation (also known as M1 phenotype) and substitution activation (M2 phenotype) [Citation10]. M1-type microglia is associated with cytotoxicity, superoxide production, and cytokine secretion [Citation11]. The factors released by M1 microglial cells can inhibit tissue repair, destroy the blood-brain barrier, and participate in neuronal degeneration [Citation12]. In contrast to the M1 phenotype, the M2 microglial phenotype exerts anti-inflammatory effects and promotes wound healing and tissue repair. M2-type microglia can also promote the expression of neuroprotective factors and participate in tissue repair and remodeling by changing gene expression [Citation13]. Therefore, it is of great value to inhibit common markers on the surface of M1 microglia to reduce the cytotoxic effect and enhance the beneficial effect of M2 microglia [Citation14]. However, the mechanism of M1/M2 polarization in microglia remains unclear.
MiR-33-5p has been shown to play a crucial role in the inflammatory response [Citation15], macrophage lipid accumulation [Citation16], and cell proliferation [Citation17]. Zeng et al. demonstrated that miR-33-5p may be a potential biomarker for acute ischemic stroke [Citation18]. Direct intracerebral delivery of miR-33 also changed gene expression [Citation19]. Nevertheless, whether miR-33 is associated with the M1/M2 polarization of microglia and thus indirectly participates in the occurrence of ischemic stroke is still unknown.
As a result, this study was aimed to investigate the influence of miR-33-5p on the M1/M2 polarization of microglia and the underlying mechanism. The changes in gene expression after miR-33-5p overexpression were analyzed by RNA sequencing and bioinformatics methods. Western blotting was used to verify the results.
Materials and methods
Cell culture and transfection
Rat microglial HAPI cells were purchased from BNCC (Art. No. BNCC340723, Beijing, China). Briefly, HAPI cells were cultured in Roswell Park Memorial Institute (RPMI) 1640 medium with 10% fetal bovine serum at 37°C and 5% CO2 in an incubator.
HAPI cells, at ~80% confluence, were harvested using a trypsin detachment solution and inoculated into a 6-well plate at a density of 5 × 10⁵ cells/well. Cells were transfected with miR-33-5p mimics according to the manufacturer’s instructions (GenePharma Co., Ltd, Shanghai, China). After 48 h of transfection, the cell precipitate was collected and lysed with 1 mL TRIzol for qPCR detection.
Real-time PCR
Real-time PCR was performed as described previously [Citation20]. Briefly, the reverse transcription system contained 4 μL 5× primeScript RT Master MIX (perfect Real Time), 1 μg RNA, and 15 μL RNase Free water (up to 20 μL). RT-PCR was performed using a quantitative PCR (ABI 7500, Thermo Fisher Scientific, MA, USA) in the presence of a fluorescent dye (SYBR Green I; Takara, NJ, USA). The primers used in this study are shown in .
Table 1. The primers used in this study
Western blotting
After lysis with RIPA lysis buffer, proteins were extracted from the fully lysed sample. Proteins from each sample were separated by sodium dodecyl sulfate (SDS)-polyacrylamide gel electrophoresis and transferred to a PVDF membrane. After transfer, the membranes were incubated with 5% skim milk. Then, the blots were washed thrice with 1× PBS-T (1000 mL 1× PBS + 1 mL Tween-20) for 5–10 min. The primary antibody diluted with 5% skim milk was incubated overnight at 4°C. After washing the membrane six times, secondary antibody was added and transferred to a table concentrator at 37°C for 2 h. Finally, bands were detected using the Millipore ECL system. Tanon Image Software was used for grayscale analysis. P < 0.05 was the screening criterion for significant difference.
cDNA library construction and transcriptome sequencing
The sequencing experiment was performed using the Illumina TruseqTM RNA sample prep Kit method for library construction. Briefly, total RNA was extracted using TRIzol reagent (Invitrogen) and its concentration and purity were detected using Nanodrop 2000. After reverse transcription, jointing adaptor, and PCR amplification, a cDNA library was constructed. The library was sequenced using an Illumina HiSeq™ 2000 sequencer (Illumina, San Diego, CA, USA).
Raw reads filtering
To ensure the accuracy of the subsequent analysis, the original sequencing data were filtered by removing joint sequences, low-quality read segments, and high N (N represents uncertain base information) rate sequence. SeqPrep [Citation21] and Sickle [Citation22] were used to remove the joint sequence from reads, sequences of less than 50 bp, and low-quality sequences.
Mapping and differential expression analysis
Based on the clean data, TopHat2 [Citation23] was used to perform a sequence alignment analysis. Based on the existing reference genome, the mapped reads were assembled and spliced to obtain differentially expressed genes (DEGs) and new transcripts using Cufflinks [Citation24] and StringTie [Citation25]. The screening criteria for DEGs were |log(FC)| > 1 and p-value < 0.05.
Functional enrichment analysis of differentially expressed genes (DEGs)
The DEGs were subjected to Gene Ontology (biological process; GO BP) and Kyoto Encyclopedia of Genes and Genomes (KEGG) annotation using the common enrichment analysis tool DAVID [Citation26] (version 6.8). The thresholds were count ≥ 2 and p-value < 0.05.
Construction of a protein–protein interaction (PPI) network of DEGs
The interaction relationship between DEG-coding proteins was predicted and analyzed using the STRING [Citation27] (version 10.0) database (PPI score: 0.15). Cytoscape plugin MCODE (version 1.4.2) was used to analyze the module in the PPI network (score > 5).
Additionally, the module genes were mapped using GO BP and KEGG databases for functional annotation. DAVID [Citation26] (version 6.8) was used to perform the function analyses, with thresholds of count ≥ 2 and p-value < 0.05.
Transcription Factor (TF)-target and miRNA-target regulatory network prediction
Based on the significant module genes, the Overrepresentation Enrichment Analysis (ORA) method in WebGestalt [Citation28] was used to predict the TF-target and miRNA-target regulatory relation for network construction.
Statistical analysis
All experiments were repeated three times. Data are shown as mean ± standard deviation. GraphPad Prism 5 (San Diego, CA, USA) was used to analyze the data from this study. One-way analysis of variance was used for comparisons among groups, followed by Newman-Keuls multiple comparison test. Statistical significance was considered for p-values less than 0.05.
Results
Expression of miR-33-5p and M1/M2 biomarkers
The expression level of miR-33-5p was detected by RT-PCR. As shown in ), the expression of miR-33-5p in the mimic group was significantly higher than that in the blank control (BC) and negative control (NC) groups (p < 0.01). The biomarkers of M1 microglia (CCL2, IL-1, and TNF-α) and biomarkers of M2 microglia (Ym-1, CD206, and Arg1) were detected. The expression levels of the three biomarker genes of M1 in the mimic group were significantly increased compared with those in the BC and NC groups, while M2 in the mimic group were significantly reduced compared with those in the BC and NC groups ()).
Figure 1. The expression of miR-33-5p (a) and biomarkers of M1/M2 microglia (b). *p < 0.05 and ** p < 0.01.
Genes differentially expressed upon miR-33-5p overexpression
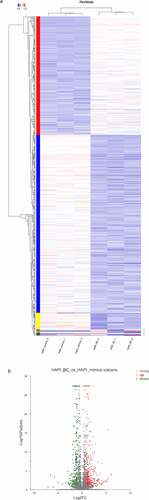
To investigate the action mechanism of miR-33-5p in the M1/M2 polarization of microglia, DEGs between the groups with or without miR-33-5p mimic treatment were identified. In total, 507 DEGs were found, which included 314 upregulated genes and 193 downregulated genes. The heatmap and volcano plot of DEGs are shown in ).
Figure 2. The heatmap (a) and volcano plot (b) of differentially expressed genes.
Functional enrichment analysis of differentially expressed genes (DEGs)
The upregulated DEGs were significantly enriched in 84 BP terms, such as positive regulation of transcription from RNA polymerase II promoter, and regulation of transcription from RNA polymerase II promoter, and 6 KEGG pathways, such as MAPK signaling pathway and transcriptional misregulation in cancer. The downregulated DEGs were significantly enriched in 59 BP terms, such as, mitotic DNA replication initiation, and DNA unwinding involved in DNA replication, and 8 KEGG pathways, such as cell cycle, and DNA replication. The top 5 terms for the enrichment results are shown in .
Table 2. Pathways and BP terms (top 5) enriched by upregulated DEGs
Table 3. Pathways and BP terms (top 5) enriched by downregulated DEGs
Protein–protein interaction (PPI) network and module analysis
To obtain more interactions, PPI networks were constructed using STRING. As shown in , 407 nodes and 1347 edges were included in the networks. The top ten nodes, with higher degrees, were Cdk1, Ccnb1, Cdc20, Mad2l1, Ccna2, Ube2c, Mcm3, Mcm4, Kif2c, and Kif23. Due to the large number of nodes in the network, we further selected the key module from the network. Two modules were finally obtained with the threshold of score > 5, as shown in and . Module A (score: 23.33) contained 25 nodes and 280 edges. All of the genes in module A were downregulated, and the top five were Cdk1, Ccnb1, Cdc20, Mad2l1, and Ccna2. Module B (score: 5.24) contained 22 nodes and 55 edges (). Most genes in this module were upregulated except for Col1a1 and Cyr61.
Figure 3. The constructed PPI network. The yellow circle represents upregulated gene, and the green square represents downregulated gene. The size of the node is based on the degree value, with higher degree values indicated by larger nodes.
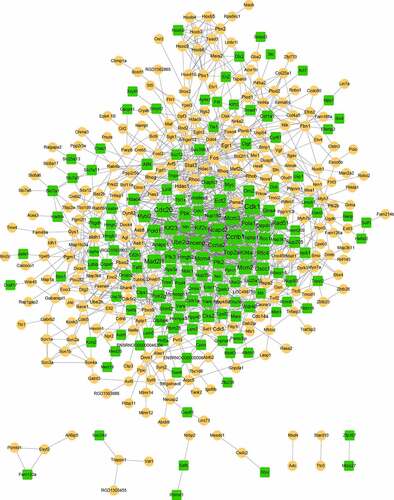
Figure 4. Subnetworks (a, module-A; b, module-B) of PPI network. Yellow circles indicate upregulated genes, and green squares indicate downregulated genes. The size of a node is based on the degree value, with higher degree values indicated by larger nodes.
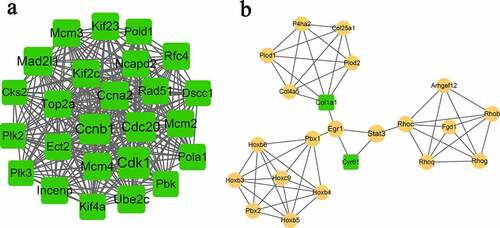
Table 4. Genes in module-A and module-B
Function analysis of module genes
Genes in module A were significantly enriched in six KEGG pathways, including cell cycle, DNA replication, oocyte meiosis, progesterone-mediated oocyte maturation, and foxo signaling pathway. For GO BP, microtubule-based movement, mitotic cell cycle, cell division, and DNA unwinding involved in DNA replication terms were significantly enriched. The top five BP terms of module B were anterior/posterior pattern specification, embryonic skeletal system morphogenesis, embryonic skeletal system development, positive regulation of transcription from RNA polymerase II promoter, and cellular response to hormone stimulus.
Transcription factor (TF)-target and miRNA-target networks
In total, 6 TFs were predicted for the module genes, involving 58 pairs of TF-target regulatory relationships. As shown in ), the six TFs were NFY, NFAT, GFI1, PAX4, HNF1, and GER1. NFY had the highest degree, which regulated the most target genes, such as the downregulated genes of Ncapd2, Ube2c, Pola1, Ccna2, Cdk1, Mcm4, etc., and upregulated genes of Rhoq, Stat3, Pbx2, etc. GFI1, NFAT, PAX4, and EGR1 regulated eight target genes, respectively. HNF1 regulated seven target genes. The downregulated gene of Col1a1 was regulated by four TFs, including NFY, NFAT, PAX4, and HNF1.
Figure 5. TF-target (a) and miRNA-target (b) networks. Yellow circles indicate upregulated genes. Green squares indicate downregulated genes. Blue triangles indicate predicted miRNAs. Red hexagons indicate transcription factors.
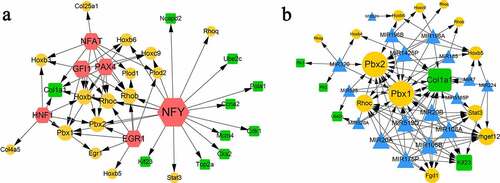
Based on the module genes, 17 miRNAs were predicted, such as MIR106A, MIR106B, MIR20B, and MIR519D. The miRNA-target network was conducted, which included 17 miRNAs and 18 genes (five downregulated and 13 upregulated), involving 99 regulatory relation pairs ()). Among the 18 genes, Pbx1, Pbx2, and Col1a1 were the center nodes with degrees greater than 10. In addition, Arhgef12, Rhoc, Kif23, and Stat3 also showed high connectivity degrees with the miRNAs.
Verification of differentially expressed genes (DEGs) by qPCR and western blotting
Efferocytosis-related genes, Slc7a5, Rhob, Smad1, Rhog, and Mybl2, were selected from DEGs and their expression levels were verified by qPCR and western blotting. As shown in ), the mRNA expression levels of Slc7a5, Rhog, and Smad1 were significantly different between the two groups. After that, the protein levels of Slc7a5 and Rhog were detected by western blotting. As shown in ), Slc7a5 was significantly downregulated, while Rhog was significantly upregulated in the miR-33-5p mimic group.
Figure 6. The mRNA (a) and protein levels (b) of verified genes.
Discussion
In this study, gene expression data were analyzed to identify genes involved in microglia upon overexpression of miR-33-5p. Compared with the control groups, 507 DEGs were identified in groups with mimics. Cdk1, Ccnb1, and Cdc20 had higher degrees in the PPI module. TFs of NFY, NFAT, GFI1, PAX4, HNF1, and GER1 had regulatory relationships with the DEGs.
The differential expression of Slc7a5 and Rhog and the proteins encoded by them was verified by RT-PCR and western blotting, respectively. Slc7a5 plays a critical role in cell growth and proliferation [Citation29]. To our knowledge, this is the first report to demonstrate the regulatory relationship between miR-33-5p and Slc7a5. There is convincing evidence that Slc7a5 is deeply involved in the occurrence of ischemic stroke [Citation30]. Therefore, more detailed studies are needed to prove the regulatory relationship between Slc7a5 and miR-33-5p. Rhog is a member of the Rho family, which plays an important role in regulating cytoskeletal reorganization in physiological and pathophysiological situations [Citation31]. To our best knowledge, there was no report about the associations between Rhog and miR-33-5p or ischemic stroke; therefore, we hypothesized that Rhog might participate in M1/M2 polarization based on our results.
All the genes in module A were downregulated. Among the 25 genes in module A, Cdk1, Ccnb1, and Cdc20 possessed the most interactions with other genes. Cyclin-dependent kinases (Cdks) have already been reported to mediate the death of ischemic neuronal cells. Zhang et al. proved that the expression of Cdk1 was induced when primary cortical neuron cultures were exposed to oxygen–glucose deprivation (OGD) for 4 h [Citation32]. Cdk1 also showed partial resistance to OGD-induced neuronal cell death [Citation33]. Moreover, Cdk1 has also been shown to play a critical role in neuronal death and has been reported to contribute to the pathogenesis of neurodegenerative diseases [Citation34]. Currently, it is generally accepted that Cdk1 regulates the cell cycle. Importantly, miR-33 has been demonstrated to play a crucial role in cell proliferation and cell cycle progression by modulating the expression of Cdk1 [Citation35,Citation36]. Our results were consistent with the abovementioned studies, indicating that the interactions between miR-33 and Cdk1 may affect the development of ischemic stroke.
Cyclin B1 (Ccnb1), an important regulator of the cell cycle machinery, is essential for mouse embryonic development [Citation37]. Several studies have shown that Ccnb1 is involved in central nervous system regeneration driven by microglia [Citation38]. However, there was no evidence to prove the direct regulation between Ccnb1 and miR-33-5p. Cdc20 is an important cell-cycle regulator for the completion of mitosis in organisms [Citation39]. Lloyd et al. found that Cdc20 could promote the proliferation of microglia through its population replacement process [Citation40]. Elevated Cdc20 increased extensive mitotic errors, leading to chromosome mis-segregation [Citation41]. Based on the existing literature, we speculated that miR-33-5p may regulate the expression of genes involving in caryomitosis and cell cycle, such as Cdk1, Ccnb1, and Cdc20.
Interestingly, we found that collagen type Ι alpha Ι (Col1a1) appeared in module-B, TF-target, and miRNA-target networks. It has been reported that Col1a1 is highly related to osteoporotic fracture [Citation42], bone mineral density, and osteoporotic fracture [Citation43]. The only research that associated Col1a1 with ischemic stroke was completed by Choi et al., who investigated the changes in gene expression after ischemic stroke [Citation44]. In our results, the TF of nuclear factor Y (NFY) showed a wide range of interactions with nine downregulated genes. NFY was proved to be associated with the sterol regulation of human fatty acid synthase promoter I [Citation45]. However, no studies have identified the direct relationship between NFY and microglia or ischemic stroke. We hypothesize that NFY may be involved in microglial polarization by indirectly regulating other genes.
Conclusions
In conclusion, our result for the first time demonstrated that miR-33-5p plays a crucial role in the M1/M2 polarization of microglia. Overexpression of miR-33-5p induced a significant change in the expression of Slc7a5 and Rhog. Genes that regulate neuron cell cycle and death, such as Cdk1, Ccnb1, and Cdc20, attracted our attention due to their high potential for M1/M2 polarization.
Authors’ contributions
Bo Yu, Dingying Ma, and Wenhua Chen carried out the conception and design of the research and obtained the funding. Ran Sun, Fei He and Lihua Chen participated in data acquisition. Song Chai, Yilan Sheng, Fei He and Ran Sun participated in the data analysis, and interpretation. Yilan Sheng, Jieshi He and Lihua Chen performed the statistical analysis. Song Chai, Yilan Sheng, Bo Yu and Ran Sun drafted this paper. Bo Yu and Dingying Ma participated in the revision of the manuscript for important intellectual content. All authors have read and approved the final manuscript.
Availability of data and materials
The data that support the findings of this study are available from the corresponding author upon reasonable request.
Disclosure statement
No potential conflict of interest was reported by the author(s).
Additional information
Funding
References
- Wei H, Li H, Song X, et al. Serum klotho: a potential predictor of cerebrovascular disease in hemodialysis patients. BMC Nephrol. 2019;20(1):63.
- Sudlow C, Martínez González NA, Kim J, et al. Does apolipoprotein E genotype influence the risk of ischemic stroke, intracerebral hemorrhage, or subarachnoid hemorrhage? Systematic review and meta-analyses of 31 studies among 5961 cases and 17 965 controls. Stroke. 2006;37(2):364–370.
- Tsivgoulis G, Katsanos AH, Patousi A, et al. Stroke recurrence and mortality in northeastern Greece: the Evros Stroke Registry. J Neurol. 2018;265(10):2379–2387.
- Leonard B, Maes MJN, Reviews B. Mechanistic explanations how cell-mediated immune activation, inflammation and oxidative and nitrosative stress pathways and their sequels and concomitants play a role in the pathophysiology of unipolar depression. Neuroscience and Biobehavioral Reviews. 2012;36(2):764–785.
- Tang Y, Le W. Differential roles of M1 and M2 microglia in neurodegenerative diseases. Molecular Neurobiology. 2016;53(2):1181–1194.
- Galli SJ, Borregaard N, TAJNi W. Phenotypic and functional plasticity of cells of innate immunity: macrophages, mast cells and neutrophils. Nature Immunology. 2011;12(11):1035.
- Brierley J, Brown Ajjo CN. The origin of lipid phagocytes in the central nervous system: i. The intrinsic microglia. The Journal of Comparative Neurology. 1982;211(4):397–406.
- CJJJoAsdr C. Genetic, transcriptome, proteomic, and epidemiological evidence for blood-brain barrier disruption and polymicrobial brain invasion as determinant factors in Alzheimer’s disease. Journal of Alzheimer's disease reports . 2017;1:125–157.
- Ponomarev ED, Veremeyko T, Hljg W. MicroRNAs are universal regulators of differentiation, activation, and polarization of microglia and macrophages in normal and diseased CNS. Glia. 2013;61(1):91–103.
- Orihuela R, McPherson CA, GJJBjop H. Microglial M1/M2 polarization and metabolic states. British Journal of Pharmacology. 2016;173(4):649–665.
- Dey R, Sultana S, BJJon B. Combination treatment of celecoxib and ciprofloxacin attenuates live S. aureus induced oxidative damage and inflammation in murine microglia via regulation of cytokine balance. Journal of Neuroimmunology. 2018;316:23–39.
- Iadecola C, JJNm A. The immunology of stroke: from mechanisms to translation. Nature Medicine. 2011;17(7):796.
- Jang E, Lee S, Kim J-H, et al. Secreted protein lipocalin-2 promotes microglial M1 polarization. FASEB Journal: Official Publication of the Federation of American Societies for Experimental Biology. 2013;27(3):1176–1190.
- Chhor V, Le Charpentier T, Lebon S, et al. Characterization of phenotype markers and neuronotoxic potential of polarised primary microglia in vitro. Brain, Behavior, and Immunity. 2013;32:70–85.
- P-c H, Chang K-C, Chuang Y-S, et al. Cholesterol regulation of receptor-interacting protein 140 via microRNA-33 in inflammatory cytokine production. FASEB Journal: Official Publication of the Federation of American Societies for Experimental Biology. 2011;25(5):1758–1766.
- Marquart TJ, Allen RM, Ory DS. Baldán ÁJPotnaos. miR-33 links SREBP-2 induction to repression of sterol transporters. Proceedings of the National Academy of Sciences of the United States of America. 2010;107(27):12228–12232.
- Iwakiri YJCC. A role of miR-33 for cell cycle progression and cell proliferation. Cell Cycle . 2012;11:1057.
- Zeng Y, Liu JX, Yan ZP, et al. Potential microRNA biomarkers for acute ischemic stroke. International Journal of Molecular Medicine. 2015;36(6):1639–1647.
- Jan A, Karasinska JM, Kang MH, et al. Direct intracerebral delivery of a miR-33 antisense oligonucelotide into mouse brain increases brain ABCA1 expression. Neuroscience Letters. 2015;598:66–72.
- Wang L, Zhang L, Chen Z-B, et al. Icariin enhances neuronal survival after oxygen and glucose deprivation by increasing SIRT1. European Journal of Pharmacology. 2009;609(1–3):40–44.
- Wang G. P50-M high-throughput and automatic plasmid DNA preparation with SeqPrep technology. Journal of Biomolecular Techniques: JBT . 2007; 18 (1): 17 .
- Joshi N, Fass J. Sickle: a sliding-window, adaptive, quality-based trimming tool for FastQ files (Version 1.33)[Software]. 2011.
- Kim D, Pertea G, Trapnell C, et al. TopHat2: accurate alignment of transcriptomes in the presence of insertions, deletions and gene fusions. Genome Biology. 2013;14(4):R36.
- Trapnell C, Roberts A, Goff L, et al. Differential gene and transcript expression analysis of RNA-seq experiments with TopHat and Cufflinks. Nature Protocols. 2012;7(3):562–578.
- Pertea M, Pertea GM, Antonescu CM, et al. StringTie enables improved reconstruction of a transcriptome from RNA-seq reads. Nature Biotechnology. 2015;33(3):290.
- Huang DW, Sherman BT, Lempicki RA. Systematic and integrative analysis of large gene lists using DAVID bioinformatics resources. Nat Protocols. 2008;4(1):44–57.
- Mering C, Huynen M, Jaeggi D, et al. STRING: a database of predicted functional associations between proteins. Nucleic acids research . 2003;31:258–261.
- Liao Y, Wang J, Jaehnig EJ, et al. WebGestalt 2019: gene set analysis toolkit with revamped UIs and APIs. Nucleic Acids Res. 2019;47(W1):W199–W205.
- Yanagida O, Kanai Y, Chairoungdua A, et al. Human L-type amino acid transporter 1 (LAT1): characterization of function and expression in tumor cell lines. Biochim Biophys Acta. 2001;1514(2):291–302.
- Tornabene E, Brodin B. Stroke and Drug Delivery–In Vitro Models of the Ischemic Blood-Brain Barrier. J Pharm Sci. 2016;105(2):398–405.
- Schumacher S, Franke K. miR-124-regulated RhoG: a conductor of neuronal process complexity. Small GTPases. 2013;4(1):42–46.
- Zhang B, Kirov S, JJNar S. WebGestalt: an integrated system for exploring gene sets in various biological contexts. Nucleic Acids Research. 2005;33( Web Server issue):W741–W8.
- Marlier Q, Jibassia F, Verteneuil S, et al. Genetic and pharmacological inhibition of Cdk1 provides neuroprotection towards ischemic neuronal death. Cell death discovery . 2018;4:1–12.
- Kim AH, Ajcc B. Cdk1-FOXO1: a mitotic signal takes center stage in post-mitotic neurons. Cell Cycle (Georgetown, Tex.). 2008;7(24):3819–3822.
- Cirera-Salinas D, Pauta M, Allen RM, et al. Mir-33 regulates cell proliferation and cell cycle progression. Cell Cycle (Georgetown, Tex.). 2012;11(5):922–933.
- Salinas DC. miR-33 regulates cell proliferation, cell cycle progression and liver regeneration. Berlin, Humboldt Universität zu Berlin, Diss. . 2013.
- Tang J-X, Li J, Cheng J-M, et al. Requirement for CCNB1 in mouse spermatogenesis. Cell Death & Disease. 2017;8(10):e3142–e.
- Lloyd AF, Davies CL, Holloway RK, et al. Central nervous system regeneration is driven by microglia necroptosis and repopulation. Nature Neuroscience. 2019;22(7):1046–1052.
- HJMc Y. Cdc20: a WD40 activator for a cell cycle degradation machine Molecular cell . 2007;27:3–16.
- Lloyd AF, Davies CL, Miron VE. Microglia: origins, homeostasis, and roles in myelin repair. Current Opinion in Neurobiology. 2017;47:113–120.
- Godek KM, Kabeche L, Dajnrmcb C. Regulation of kinetochore–microtubule attachments through homeostatic control during mitosis. Nature Reviews. Molecular Cell Biology. 2015;16(1):57–64.
- Mann V, Hobson EE, Li B, et al. A COL1A1 Sp1 binding site polymorphism predisposes to osteoporotic fracture by affecting bone density and quality. The Journal of Clinical Investigation. 2001;107(7):899–907.
- Mann V, Ralston SH. Meta-analysis of COL1A1 Sp1 polymorphism in relation to bone mineral density and osteoporotic fracture. Bone. 2003;32(6):711–717.
- Choi I, Yun JH, Kim J-H, et al. Sequential Transcriptome Changes in the Penumbra after Ischemic Stroke. International journal of molecular sciences . 2019;20:6349.
- Xiong S, Chirala SS, Wakil S. Sterol regulation of human fatty acid synthase promoter I requires nuclear factor-Y-and Sp-1-binding sites. Proceedings of the National Academy of Sciences of the United States of America. 2000;97(8):3948–3953.