
ABSTRACT
Esophageal carcinoma (EC) is a common gastrointestinal malignancy that poses a threat to public health worldwide. Long noncoding RNA (lncRNA) bladder cancer-associated transcript 1 (BLACAT1) exerts a tumorigenic role in several malignant tumors; nevertheless, its function in EC remains largely unknown. Besides, programmed cell death-ligand 1 (PD-L1), an oncogene in numerous human cancers, has been identified as a therapeutic target for EC. Therefore, we intended to explore the potential regulatory network involving BLACAT1 and PD-L1 in EC. In this study, we observed increased BLACAT1 and PD-L1 levels in EC tissues and EC cell lines. Moreover, YY1 could activate BLACAT1 transcription in EC cells (TE-1 and EC9706). In addition, in vitro and in vivo experiments demonstrated that BLACAT1 facilitated EC cell proliferation and metastasis and EC tumor growth. Also, the effects of BLACAT1 silencing on EC cell functions were partially reversed by PD-L1 overexpression. Besides, it was identified that BLACAT1 competed with PD-L1 to bind to miR-5590-3p in EC cells. Furthermore, miR-5590-3p suppression could abrogate the functional effects of BLACAT1 knockdown on EC cells; while PD-L1 silencing partly abolished the promoting effects of miR-5590-3p suppression on the biological functions of EC cells. To sum up, YY1-induced BLACAT1 accelerated EC progression via regulating the miR-5590-3p/PD-L1 axis.
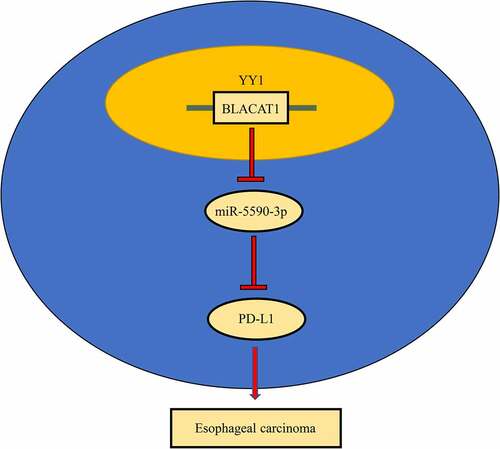
GRAPHICAL ABSTRACT
Highlights
BLACAT1 and PD-L1 were both upregulated in EC.
YY1 stimulated BLACAT1 transcription in EC cells.
BLACAT1 pr 45 omoted EC cell proliferation and metastasis.
MiR-5590-3p was targeted by both BLACAT1 and PD-L1.
BLACAT1 facilitated EC progression via miR-5590-3p/PD-L1 axis.
Introduction
As a common category of cancerous tumor derived from the gastrointestinal tract [Citation1], esophageal carcinoma (EC) ranks the 6th in cancer-associated death globally and exhibits increasing incidence and mortality in recent years [Citation2,Citation3]. Over the past few years, great achievements have been made in the treatment for solid tumors [Citation4–9], including EC [Citation10]. Nevertheless, the 5-year overall survival rate for EC patients is still far below 40% [Citation11]. Given that the high mortality of EC patients is closely related to remote recurrence and metastasis [Citation12], it is necessary to look into EC and its metastatic mechanism from the molecular level, thereby proposing diagnosis and intervention strategies for EC.
Long noncoding RNAs (lncRNAs) refer to a cohort of RNAs (>200 nucleotides) without protein-encoding capability [Citation13]. A great number of studies have elaborated that lncRNAs undertake essential roles in the pathogenesis and progression of human cancers, including EC [Citation14–16]. LncRNA bladder cancer-associated transcript 1 (BLACAT1) has been identified as an oncogene in diversified malignant human tumors, such as hepatocellular carcinoma [Citation17], colorectal carcinoma [Citation18], and gastric cancer [Citation19]. Also, Dai et al. reported that BLACAT1 promoted cell proliferation and metastasis in oral squamous cell carcinoma via absorbing miR-142-5p [Citation20], suggesting its cancer-promoting role in head and neck cancers. Interestingly, Liu et al. found that lncRNA BLACAT1 was highly expressed in esophageal squamous cell carcinoma (ESCC) tissues compared with normal esophageal tissues [Citation21]. However, there were few reports on the role of BLACAT1 in EC progression. MicroRNAs (miRNAs), short non-coding RNAs with 20 to 23 nucleotides [Citation22], may negatively regulate messenger RNA (mRNA) expression by targeting complementary sequences of target mRNAs [Citation23]. Also, miRNAs are imperative regulators in diverse cellular processes of cancer cells, including cell differentiation, proliferation, apoptosis, and metastasis [Citation24]. In many circumstances, lncRNAs, as competitive endogenous RNAs (ceRNAs), could regulate target genes via interaction with certain miRNAs at the post-transcriptional level [Citation25].
Programmed cell death-ligand 1 (PD-L1) is widely expressed on the surface of tumor cells and tumor-infiltrating immune cells and is involved in tumor immune escape as a pivotal checkpoint [Citation26,Citation27]. Aberrant PD-L1 expression contributes to the tumorigenesis of several cancers, including colon cancer [Citation28], gastric cancer [Citation29], and ovarian cancer [Citation30]. More crucially, it was reported that PD-L1 level was elevated in ESCC and accelerated ESCC progression by regulating metastasis [Citation31].
In the current work, we aimed to determine the potential role and regulatory mechanism of BLACAT1 and PD-L1 in EC. Through in vitro and in vivo experiments, as well as bioinformatics analysis, we found evidence that YY1-regulated BLACAT1 upregulation increased PD-L1 expression by absorbing miR-5590-3p, thereby promoting proliferation, invasion, and migration and inhibiting apoptosis in EC cells. As a result, BLACAT1 could be an important biomarker for EC development and progression.
Materials and methods
Clinical specimens and cell lines
32 pairs of EC tissues and tumor-adjacent tissues were collected from patients at the Fourth Hospital of Hebei Medical University with the approval of the Ethics Committee of the Fourth Hospital of Hebei Medical University. Each patient enrolled signed the informed consent form. Tissue samples were kept in liquid nitrogen after collection for later experiments.
Normal human esophageal epithelial cell line (HET-1A) and EC cell lines (EC109, TE-1, TE-10, EC9706, and KYSE-410) were acquired from BeNa Culture Collection (Beijing, China) in the culture medium (90% DMEM+10% FBS) at a humid atmosphere (37 C; 5% CO2). All cell lines were authenticated by STR profiling and mycoplasma test was performed before each cell experiment.
RT-qPCR assay
TRIzol reagent (Invitrogen, USA) was utilized to extract total RNA from tissue samples or cell lines. Then, cDNA was generated by High-Capacity cDNA Reverse Transcription Kit (Applied Biosystems, USA). Next, qPCR was conducted with SYBR Green PCR Master Mix (GeneCopoeia, USA), with GAPDH or U6 as the internal control. Respective gene expression was calculated by 2−ΔΔCt method. RT-qPCR primers were as follows: BLACAT1 forward (F): 5′- GTCTCTGCCCTTTTGAGCCT-3′, BLACAT1 reverse (R): 5′- GTGGCTGCAGTGTCATACCT-3′; PD-L1 (F): 5′;- TGCCGACTACAAGCGAATTAC TG-3′, PD-L1 (R): 5′- CTGCTTGTCCAGATGACTT CGG-3′; YY1 (F): 5′- GGAGGAATACCTGGCA TTGACC-3′, YY1 (R): 5′- CCCTGAACA TCTTTGTGCAGCC-3′; GAPDH (F): 5ʹ- GTCTCC TCTGACTTCAACAGCG-3ʹ, GAPDH (R): 5ʹ- ACCACCCTGTTGCTGTAGCCAA-3ʹ; miR-5590-3p (F): 5’-GCGCGTTGCCATACATAGAC-3’, miR-5590-3p (R): 5’-AGTGCAGGGTCCGAGGTATT-3’; U6 (F): 5’-CTCGCTTCGGCAGCACAT−3’, U6 (R): 5’- TTTGCGTGTCATCCTTGCG −3’.
Cell transfection
Small interfering RNA (si-RNA) against BLACAT1 (si-BLACAT1), YY1 (si-YY1), and negative control (si-NC), pcDNA3.1/BLACAT1 (oe-BLACAT1), pcDNA3.1/YY1 (oe-YY1), pcDNA3.1/PD-L1 (oe-PD-L1), and pcDNA3.1 empty vector (pcDNA3.1), miR-5590-3p inhibitor, miR-5590-3p mimics, and negative controls (NC inhibitor and NC mimics) were established by GenePharma (China). These oligonucleotides were transfected into TE-1 and EC9706 cells via Lipofectamine 2000 (Invitrogen). The transfection efficacy was confirmed by RT-qPCR.
ChIP assay
With ChIP Assay Kit (Takara, China), the interaction between YY1 and BLACAT1 promoter region was verified via ChIP assay. Briefly, TE-1 and EC9706 cells were treated with formaldehyde for the generation of DNA-protein cross-links. Then, cell lysates were sonicated to harvest DNA fragments. Next, the cell lysates were incubated with antibodies against YY1 or IgG (negative control). Finally, the immunoprecipitated DNA was analyzed by RT-qPCR.
Dual-luciferase reporter assay
To verify the binding condition between YY1 and BLACAT1, the putative binding sites (E1, E2, and E3) between YY1 and BLACAT1 promoter region were utilized to synthesize E1 + E2 + E3 (BLACAT1-pGL3-F) and E1+ E3 (BLACAT1-pGL3-D) sequences which were respectively inserted into pGL3-basic vectors (Promega, USA). Then, TE-1 or EC9706 cells were co-transfected with the above plasmids and oe-YY1 or pcDNA3.1 via Lipofectamine 2000. To verify the binding condition between miR-5590-3p and BLACAT1 or PD-L1, mutant (MUT) or wild-type (WT) sequences of BLACAT1 or PD-L1 were cloned into pmirGLO vectors (Promega, USA) to generate MUT-BLACAT1 or WT-BLACAT1 (MUT-PD-L1 or WT-PD-L1) plasmids which were severally transfected into TE-1 or EC9706 cells together with miR-5590-3p mimics or NC mimics via Lipofectamine 2000. The transfected cells were cultured for another 48 hours. Dual-Luciferase Reporter System Kit (Promega, China) was employed for luciferase activity analysis.
CCK-8 assay
Cell viability was analyzed by CCK-8 assay. Transfected TE-1 or EC9706 cells were plated into 96-well plates (1 × 10⁴ cells /well) and cultured for 0, 24, 48, or 72 h (37 C; 5% CO2) before CCK-8 reagent (10 μl/well; Dojindo, Japan) was added. Then, TE-1 or EC9706 cells were cultured for 2 hours. Finally, the absorbance was analyzed with a microplate reader (BioTek, USA) at 450 nm wavelength.
Flow cytometry analysis
To detect apoptosis in TE-1 or EC9706 cells, Annexin V-fluorescein isothiocyanate (FITC)/propidium iodide (PI) method was carried out in this study. Briefly, the transfected cells were rinsed twice with PBS, centrifuged, and re-suspended in binding buffer. Next, the cell suspension was cultured with Annexin V-FITC/PI for 20 minutes in darkness. Eventually, the apoptotic cells were detected by flow cytometry (BD Biosciences, USA).
Transwell assay
Transwell chambers (Corning, NY) without or with Matrigel coating were used to test the migrative and invasive capability of TE-1 or EC9706 cells, respectively. Transfected cells (2 × 10⁴ cells) were seeded into the upper chamber (containing serum-free medium), while the lower chamber was supplemented with a complete culture medium. After 24 hours’ cultivation, the remaining cells were stained with crystal violet. The cells stained were observed and calculated under an inverted optical microscope (Leica).
Xenograft experiment
BALB/c (7-weeks-old) mice acquired from SLAC (Shanghai, China) were raised in an animal room at 12 h light/dark cycle. The mice were subcutaneously injected with TE-1 cells (5 × 10⁶ cells) transfected with si-RNA and si-BLACAT1 and tumor volumes were examined every 7 days. 4 weeks later, the mice were sacrificed by cervical dislocation after deep anesthesia, and the weight of tumors was measured. The protocol of the animal study was permitted by the Ethics Committee of the hospital.
Statistical analyses
Statistical analysis was accomplished via GraphPad Prism 6.0 (GraphPad, USA). All experiments were repeated at least 3 times and presented as mean ± standard deviation (SD). Differences were analyzed with one-way ANOVA (>2 groups) or Student’s t-test (2 groups). Pearson’s analysis was applied to analyze correlations among genes. Data with p-value <0.05 were defined as significant in statistics.
Results
In our work, a series of in vitro and in vivo assays were performed to explore the function of BLACAT1 in EC. Our findings indicated that YY1-stimulated BLACAT1 promoted cell proliferation, metastasis, and tumor growth in EC through the miR-5590-3p/PD-L1 axis, offering novel insight into EC pathogenesis.
High BLACAT1 and PD-L1 expressions in EC
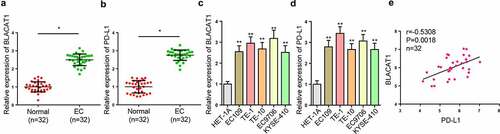
To begin with, we detected BLACAT1 and PD-L1 levels in tissues and cells via RT-qPCR. RT-qPCR results exhibited that BLACAT1 and PD-L1 were highly expressed in EC tissues versus normal tissues ( –(b)). Similarly, as shown in –(d), higher BLACAT1 and PD-L1 levels were observed in EC cell lines (EC109, TE-1, TE-10, EC9706, and KYSE-410), relative to normal human esophageal epithelial cell line (HET-1A). TE-1 and EC9706 cells were selected for the following experiments due to the higher expression of BLACAT1. Also, Pearson’s correlative analysis manifested a remarkable positive correlation between BLACAT1 and PD-L1 ()). The statistical analysis on the relationship between BLACAT1 (or PD-L1) and clinical features in EC patients showed that BLACAT1 (or PD-L1) was strongly related to T stage, lymph node metastasis, and distant metastasis. However, it was unrelated to age or gender (). Based on the abnormal BLACAT1 and PD-L1 expressions in EC, it was speculated that BLACAT1 and PD-L1 might play oncogenic roles in EC.
Table 1. Correlation between BLACAT1, miR-5590-3p, and PD-L1 expression and clinical features of EC patients
Figure 1. High BLACAT1 and PD-L1 expressions in EC. (a) BLACAT1 expression in EC tissues (n = 32) and normal tissues (n = 32) was detected by RT-qPCR. (b) PD-L1 expression in EC tissues (n = 32) and normal tissues (n = 32) was detected by RT-qPCR. (c) BLACAT1 expression in EC cell lines (EC109, TE-1, TE-10, EC9706, and KYSE-410) and normal human esophageal epithelial cell line (HET-1A) was detected by RT-qPCR. (d) PD-L1 expression in EC cell lines (EC109, TE-1, TE-10, EC9706, and KYSE-410) and normal human esophageal epithelial cell line (HET-1A) was detected by RT-qPCR. (e) The correlation between BLACAT1 and PD-L1 in EC tissues was analyzed by Pearson’s correlative analysis. *P < 0.05, **P < 0.01.
YY1 directly promotes BLACAT1 transcription in EC cells
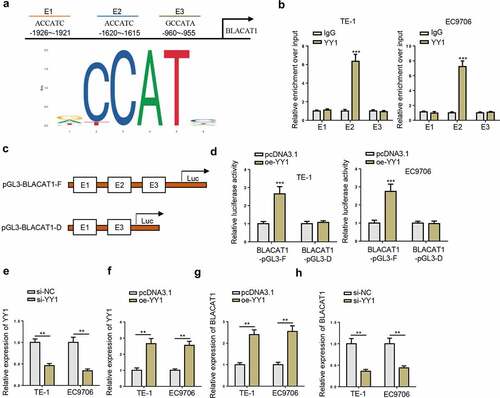
By JASPAR database, it was predicted that YY1 might bind to BLACAT1 promoter region at 3 putative binding sites (E1, E2, and E3) with score above 8 ()). Subsequently, the binding between YY1 and E2 was demonstrated by ChIP assay ()). Furthermore, luciferase reporter assay confirmed that BLACAT1-pGL3-F dramatically increased YY1 luciferase activity, while BLACAT1-pGL3-D almost made no changes to YY1 luciferase activity ( –(d)). To explore the regulatory function of YY1 on BLACAT1, YY1 was silenced and overexpressed in TE-1 and EC9706 cells, and the efficiencies were verified by RT-qPCR ( –(f)). RT-qPCR assays verified that YY1 overexpression increased BLACAT1 expression, while YY1 depletion decreased BLACAT1 expression in TE-1 and EC9706 cells ( –(h)). The above results indicated that YY1 promoted BLACAT1 transcription by directly binding to E2 in the BLACAT1 promoter region.
Figure 2. YY1 directly promotes BLACAT1 transcription in EC cells. (a) JASPAR online database predicted YY1 binding site in BLACAT1 promoter region. (b) ChIP assay demonstrated the binding between YY1 and BLACAT1 promoter region in TE-1 and EC9706 cells. (c and d) Luciferase reporter assay identified the relationship between BLACAT1 and YY1 in TE-1 and EC9706 cells. (e and f) YY1 expression level in YY1 silencing or overexpressing TE-1 and EC9706 cells was detected by RT-qPCR. (g and h) BLACAT1 level in YY1 silencing or overexpressing TE-1 and EC9706 cells was detected by RT-qPCR. *P < 0.05, **P < 0.01.
BLACAT1 promotes malignant phenotypes in EC cells
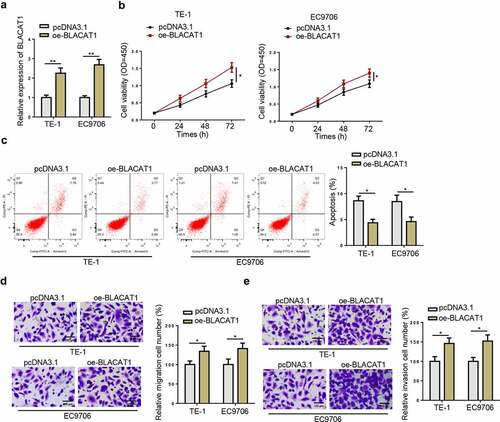
To explore the functional effects of BLACAT1 in EC, we further detected BLACAT1 expression in EC cells. Subsequently, a series of loss-of-function and gain-of-function experiments were carried out. Firstly, BLACAT1 knockdown efficiency in TE-1 and EC9706 cells was confirmed by RT-qPCR ()). CCK-8 assays showed that BLACAT1 knockdown significantly inhibited TE-1 and EC9706 cell proliferation ()). As indicated by flow cytometry assay, BLACAT1 deletion induced TE-1 and EC9706 cell apoptosis ()). Transwell assay demonstrated that BLACAT1 depletion suppressed EC cell migration and invasion abilities ( –(e)). In addition, an EC xenograft model based on the TE-1 cell line was constructed to further assess the role of BLACAT1 in vivo. As illustrated in ), BLACAT1 expression was significantly downregulated in BLACAT1-knockdown group. Meanwhile, the tumor volume and weight of the BLACAT1-silencing group were much less than that of the control group ( –(h)). Next, BLACAT1 was overexpressed in TE-1 and EC9706 cells. The transfection efficiency was verified by RT-qPCR ()). Contrary to the results of loss-of-function assays, BLACAT1 upregulation enhanced proliferation ()), reduced apoptosis ()), and accelerated migration and invasion ( –(e)) in TE-1 and EC9706 cells. In addition, BLACAT1 was overexpressed in HET-1A (Supplementary Fig. S1A). Functional assays revealed that BLACAT1 overexpression promoted cell viability, migration, and invasion, but inhibited cell apoptosis (Supplementary Fig. S1B-E). Taken together, BLACAT1 aggravated the malignant biological behaviors of EC cells.
Figure 3. BLACAT1 knockdown inhibits malignant phenotypes in EC cells. (a) BLACAT1 expression in TE-1 or EC9706 cells transfected with si-NC or si-BLACAT1 was detected by RT-qPCR. (b) CCK-8 assay was performed to detect the viability of TE-1 or EC9706 cells transfected with si-NC or si-BLACAT1. (c) Flow cytometry was performed to detect apoptotic cells in each group. (d and e) Transwell assay was performed to detect the migrated or invaded cells in each group. (f) RT-qPCR showed the expression of BLACAT1 in the control group and BLACAT1-silencing group. (g) Xenograft tumor assay showed knockdown of BLACAT1 markedly suppressed tumor growth.
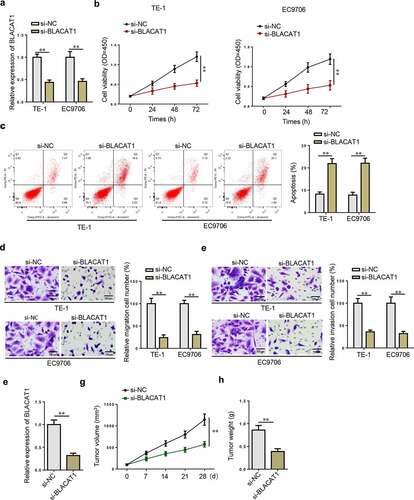
Figure 4. BLACAT1 overexpression promotes malignant phenotypes in EC cells. A) BLACAT1 expression in TE-1 or EC9706 cells transfected with pcDNA3.1 or oe-BLACAT1 was detected by RT-qPCR. (b-e) CCK-8, flow cytometry and Transwell assays were performed to detect the viability, apoptosis, migration and invasion of TE-1 or EC9706 cells transfected with pcDNA3.1 or oe-BLACAT1. *P < 0.05, **P < 0.01.
PD-L1 upregulation retrieves effects of BLACAT1 knockdown on biological behaviors of EC cells
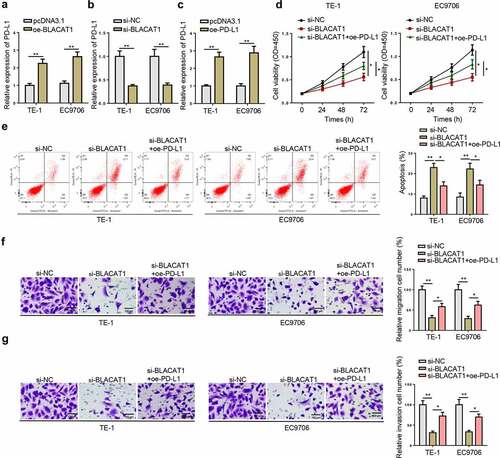
To investigate the relationship between BLACAT1 and PD-L1 in EC, we also performed rescue experiments. As displayed in –(b), BLACAT1 overexpression substantially increased PD-L1 level, while BLACAT1 depletion markedly reduced PD-L1 enrichment in TE-1 and EC9706 cells. Next, PD-L1 was overexpressed in TE-1 and EC9706 cells, with transfection efficiency detected by RT-qPCR ()). Then, TE-1 and EC9706 cells were divided into three groups (si-NC, si-BLACAT1, and si-BLACAT1+ oe-PD-L1) for rescue assays. According to CCK-8 results, BLACAT1 knockdown significantly suppressed TE-1 and EC9706 cell proliferation, whereas PD-L1 overexpression reversed this effect ()). In addition, PD-L1 overexpression abolished the promoting effect of BLACAT1 depletion on TE-1 and EC9706 cell apoptosis ()). Moreover, as indicated by Transwell assay, PD-L1 upregulation could partially reverse the migrative and invasive capability induced by BLACAT1 silencing in TE-1 and EC9706 cells ( –(g)). To sum up, BLACAT1 facilitated EC progression via regulating PD-L1.
Figure 5. PD-L1 upregulation retrieves effects of BLACAT1 knockdown on biological behaviors of EC cells. (a and b) PD-L1 expression in TE-1 or EC9706 cells transfected with si-NC, si-BLACAT1, pcDNA3.1, or oe-BLACAT1 was detected by RT-qPCR. (c) PD-L1 expression in TE-1 or EC9706 cells transfected with pcDNA3.1 or oe-PD-L1 was detected by RT-qPCR. (d-g) CCK-8, flow cytometry and Transwell assays were performed to detect cell viability, apoptosis, migration and invasion in TE-1 or EC9706 cells transfected with si-NC, si-BLACAT1, or si-BLACAT1+ oe-PD-L1. *P < 0.05, **P < 0.01.
BLACAT1 upregulates PD-L1 via absorbing miR-5590-3p
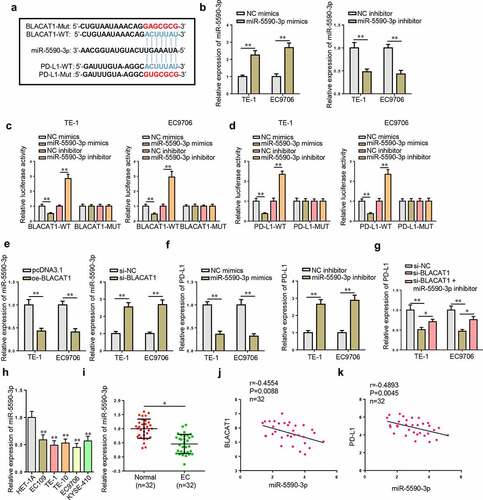
As predicted by StarBase website, both BLACAT1 and PD-L1 had potential binding sites for miR-5590-3p ()). Then, luciferase reporter assay was carried out to verify the binding condition between miR-5590-3p and BLACAT1 or PD-L1. Firstly, miR-5590-3p overexpression and inhibition efficiency in EC cells was confirmed by RT-qPCR ()). Results of luciferase reporter assay showed that miR-5590-3p upregulation restrained the luciferase activity of BLACAT1-WT or PD-L1-WT, while miR-5590-3p inhibition enhanced the luciferase activity of BLACAT1-WT or PD-L1-WT; however, both miR-5590-3p upregulation and inhibition exerted almost no effects on the luciferase activity of BLACAT1-MUT or PD-L1- MUT ( –(d)). Besides, miR-5590-3p expression was downregulated after BLACAT1 overexpression and upregulated after BLACAT1 knockdown ()). Also, miR-5590-3p amplification suppressed PD-L1 expression in EC cells, whereas miR-5590-3p downregulation promoted PD-L1 level in EC cells ()). Furthermore, the suppressive effect of BLACAT1 silencing on PD-L1 expression was partly reversed by miR-5590-3p inhibition ()). RT-qPCR results showed that miR-5590-3p was poorly expressed in EC cells, relative to normal cells ()). Similarly, a significant decrease in miR-5590-3p expression was discovered in EC tissues, in comparison to normal tissues ()). Additionally, there were significant negative correlations between the expression of BLACAT1 and miR-5590-3p and the expression of PD-L1 and miR-5590-3p ( –(k)). Next, we analyzed the correlation between the miR-5590-3p expression and clinical characteristics of EC patients. It was found that miR-5590-3p expression was negatively correlated with T stage, lymph node metastasis, and distant metastasis, but not with age or gender (). Taken together, BLACAT1 positively regulated PD-L1 expression in EC cells via interaction with miR-5590-3p.
Figure 6. BLACAT1 upregulated PD-L1 via absorbing miR-5590-3p. (a) Binding sites between miR-5590-3p and BLACAT1 or PD-L1 predicted by StarBase website. (b) MiR-5590-3p level in TE-1 and EC9706 cells expressing miR-5590-3p overexpression or inhibition was detected by RT-qPCR. (c) Luciferase reporter assay identified the correlation between BLACAT1 and miR-5590-3p in TE-1 and EC9706 cells. (d) Luciferase reporter assay identified the correlation between PD-L1 and miR-5590-3p in TE-1 and EC9706 cells. (e) MiR-5590-3p level in TE-1 and EC9706 cells transfected with pcDNA3.1, oe-BLACAT1, si-NC, or si-BLACAT1 was detected by RT-qPCR. (f) PD-L1 level in TE-1 and EC9706 cells transfected with NC mimics, miR-5590-3p mimics, NC inhibitor, or miR-5590-3p inhibitor was detected by RT-qPCR. (g) PD-L1 level in TE-1 and EC9706 cells transfected with si-NC, si-BLACAT1, or si-BLACAT1+ miR-5590-3p inhibitor was detected by RT-qPCR. (h) MiR-5590-3p expression in EC cell lines (EC109, TE-1, TE-10, EC9706, and KYSE-410) and normal human esophageal epithelial cell line (HET-1A) was detected by RT-qPCR. (i) MiR-5590-3p expression in EC tissues (n = 32) and normal tissues (n = 32) was detected by RT-qPCR. (j) The correlation between BLACAT1 and miR-5590-3p in EC tissues was analyzed by Pearson’s correlative analysis. (k) The correlation between miR-5590-3p and PD-L1 in EC tissues was analyzed by Pearson’s correlative analysis. *P < 0.05, **P < 0.01.
YY1-mediated BLACAT1 accelerates EC progression by regulating the miR-5590-3p/PD-L1 axis
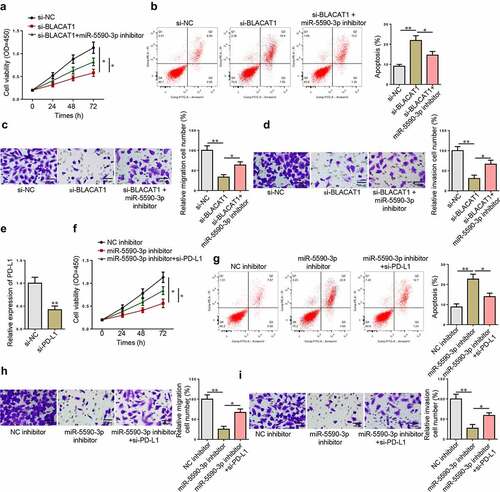
To further confirm the function of BLACAT1/miR-5590-3p/PD-L1 in regulating biological activities of EC cells, a series of rescues were performed. CCK-8 assay confirmed that BLACAT1 silencing suppressed TE-1 cell proliferation, while miR-5590-3p knockdown partially abolished the function of BLACAT1 knockdown ()). BLACAT1 silencing accelerated apoptosis in TE-1 cells, while knocking down miR-5590-3p partially saved the effect of BLACAT1 knockdown ()). Moreover, Transwell assays exhibited that miR-5590-3p knockdown partially abolished the migrative and invasive inhibition induced by BLACAT1 knockdown ( –(d)). Next, the functional correlation between miR-5590-3p and PD-L1 was also analyzed. PD-L1 level was knocked down in TE-1 cells ()). As indicated by the results of cytological experiments, the aggravated TE-1 cell dysfunction induced by miR-5590-3p inhibition was partly reversed by PD-L1 silencing in TE-1 cells (). These results indicated that YY1-induced BLACAT1 upregulated the expression level of the oncogene, PD-L1, by competitively binding to miR-5590-3p, thereby accelerating EC malignant progression.
Figure 7. YY1-induced BLACAT1 accelerates EC progression in vitro by regulating the miR-5590-3p/PD-L1 axis. (a-d) CCK-8, flow cytometry and Transwell assays were performed to detect cell viability, apoptosis, migration and invasion in TE-1 cells transfected with si-NC, si-BLACAT1, or BLACAT1+ miR-5590-3p inhibitor. (e) PD-L1 expression in TE-1 cells transfected with si-NC or si-PD-L1 was detected by RT-qPCR. (f-i) CCK-8, flow cytometry, and Transwell assays were performed to detect cell viability, apoptosis, migration and invasion in TE-1 cells transfected with NC inhibitor, miR-5590-3p inhibitor, or miR-5590-3p inhibitor+si-PD-L1. *P < 0.05, **P < 0.01.
Discussion
To improve EC treatment, research on abnormally expressed genes in EC pathogenesis is of great importance [Citation32]. Accumulating evidence confirmed that lncRNAs exert profound effects in EC pathogenesis and progression at molecular level [Citation33]. For example, Chen et al. disclosed that lncRNA CASC11 upregulated KLF6 to promote EC development [Citation34]. Li et al. uncovered that exosomal FMR1-AS1 facilitated the maintenance of the dynamic balance of cancer stem-like cells in female EC patients [Citation35]. As reported by Wang et al., lncRNA CCAT2 could exacerbate resistance to radiation treatment for EC cells [Citation36]. Among the cancer-related lncRNAs, BLACAT1 exhibits distinct properties as a carcinogen. For instance, BLACAT1 regulated miR-519d-3p expression to activate the Wnt/β-catenin signaling, hence promoting ovarian cancer progression [Citation37]. As reported by Zhou et al., BLACAT1 repressed CDKN1C expression in pancreatic cancer, thereby facilitating aerobic glycolysis and cell proliferation and migration [Citation38]. Hu et al. revealed that BLACAT1 aggravated breast cancer cell proliferation and metastasis through upregulating CCR2 expression via interaction with miR-150-5p [Citation39].
In this study, we found BLACAT1 expression was substantially increased in EC tissues and cells, implying BLACAT1 might exert a fundamental role in EC development and progression. Next, we found that YY1 could positively regulate BLACAT1 transcription in EC cells via binding to the promoter region of BLACAT1. As anomalous proliferation and metastasis are essential malignant biological behaviors of tumors, functional assays were conducted to study the regulatory role of BLACAT1 in EC in vitro. In this study, our data demonstrated that BLACAT1 promoted proliferation, migration, and invasion but inhibited apoptosis in EC cells. Moreover, we demonstrated the promoting effect of BLACAT1 on EC progression in vivo. All these results indicated that BLACAT1 accelerated EC progression.
PD-L1 functioned as an oncogene in a variety of tumors [Citation40]. Besides, its involvement in regulating cancer cell proliferation, apoptosis, migration, and invasion has also been widely investigated in previous studies [Citation41]. To cite an instance, PD-L1 regulated cell proliferation, apoptosis, migration, and invasion in head and neck cancer cells, thereby promoting cancer phenotypes [Citation42]. Herein, PD-L1 upregulation was observed in EC tissues and cells. Also, PD-L1 expression was positively correlated with BLACAT1 expression in EC. Moreover, PD-L1 overexpression abolished the inhibitory effects of BLACAT1 depletion on aggressive cellular phenotypes in EC, implying BLACAT1 might participate in EC cell processes via regulating PD-L1 expression.
By linking the functions of mRNAs to miRNAs and lncRNAs, ceRNA network may help to explain the pathogenesis of EC [Citation43,Citation44]. Hence, we intended to find the target miRNA(s) crucial to the ceRNA regulatory network in EC involving BLACAT1 and PD-L1. As identified by StarBase website and dual-luciferase reporter assay, BLACAT1 regulated PD-L1 expression in EC cells by competitively binding to miR-5590-3p. Additionally, miR-5590-3p was downregulated in EC tissues and cells. Besides, RT-qPCR results exhibited BLACAT1 regulated PD-L1 expression in EC cells via interacting with miR-5590-3p. Former research has proven that miR-5590-3p played an anti-cancer role in several malignant tumors. For instance, Chen et al. disclosed that miR-5590-3p inhibited cell proliferation and metastasis in triple-negative breast cancer [Citation45]. Luo et al. uncovered that miR-5590-3p impeded prostate cancer aggravation by inhibiting YY1 expression [Citation46]. In addition, Zhao et al. demonstrated that miR-5590-3p restrained the progression and immune escape of diffuse large B cell lymphoma via modulating the PD-1/PD-L1 checkpoint [Citation47]. In line with previous studies, rescue assays exhibited that miR-5590-3p inhibition rescued the suppressive impact on BLACAT1-induced EC progression in vitro; further, PD-L1 downregulation partly rescinded the facilitating effect of miR-5590-3p inhibition on malignant cellular activities of EC cells. Therefore, BLACAT1 facilitated EC progression by regulating PD-L1 expression as a ceRNA of miR-5590-3p.
Conclusion
Collectively, this work, for the first time, confirmed that YY1-mediated BLACAT1 promoted EC development in vitro and in vivo via the miR-5590-3p/PD-L1 cascade. Our findings indicated that BLACAT1 could be a promising biomarker or therapeutic target for EC. However, the limitations of our study need to be addressed in future studies. First of all, our findings should be further confirmed in additional EC cell lines. Also, the diagnostic value of BLACAT1 in EC will be further identified.
Authors’ contributions
Jingge Cheng and Hongye Zhao designed the present study. Qian Yang, Xia Han, Haotian Wang, and Kun Wu performed the experiments, analyzed the data, and prepared the figures. Jingge Cheng and Hongye Zhao drafted the initial manuscript and revised the manuscript. All authors read and approved the final manuscript.
Supplemental Material
Download TIFF Image (150.7 KB)Disclosure statement
No potential conflict of interest was reported by the author(s).
Supplementary material
Supplemental data for this article can be accessed here
Additional information
Funding
Related Research Data
References
- Pennathur A, Gibson MK, Jobe BA, et al. Oesophageal carcinoma. Lancet. 2013;381:400–412.
- Pakzad R, Mohammadian-Hafshejani A, Khosravi B, et al. The incidence and mortality of esophageal cancer and their relationship to development in Asia. Ann Transl Med. 2016;4:29.
- Fan J, Liu Z, Mao X, et al. Global trends in the incidence and mortality of esophageal cancer from 1990 to 2017. Cancer Med. 2020;9:6875–6887.
- Federico C, Sun J, Muz B, et al. Localized delivery of cisplatin to cervical cancer improves its therapeutic efficacy and minimizes its side effect profile. Int J Radiat Oncol Biol Phys. 2021;109:1483–1494.
- Singh SV, Chaube B, Mayengbam SS, et al. Metformin induced lactic acidosis impaired response of cancer cells towards paclitaxel and doxorubicin: role of monocarboxylate transporter. Biochim Biophys Acta Mol Basis Dis. 2021;1867:166011.
- Kumar B, Chand V, Ram A, et al. Oncogenic mutations in tumorigenesis and targeted therapy in breast cancer. Curr Mol Biol Rep. 2020;6:116–125.
- Suhail M, Tarique M, Muhammad N, et al. A critical transcription factor NF-kappaB as a cancer therapeutic target and its inhibitors as cancer treatment options. Curr Med Chem. 2021;28:4117–4132.
- Floberg JM, Zhang J, Muhammad N, et al. Standardized uptake value for (18)F-fluorodeoxyglucose is a marker of inflammatory state and immune infiltrate in cervical cancer. Clin Cancer Res. 2021;27:4245–4255.
- Rashmi R, Jayachandran K, Zhang J, et al. Glutaminase inhibitors induce thiol-mediated oxidative stress and radiosensitization in treatment-resistant cervical cancers. Mol Cancer Ther. 2020;19:2465–2475.
- Rice TW, Adelstein DJ, Chidel MA, et al. Benefit of postoperative adjuvant chemoradiotherapy in locoregionally advanced esophageal carcinoma. J Thorac Cardiovasc Surg. 2003;126:1590–1596.
- Allemani C, Matsuda T, Di Carlo V, et al. Global surveillance of trends in cancer survival 2000-14 (Concord-3): analysis of individual records for 37 513 025 patients diagnosed with one of 18 cancers from 322 population-based registries in 71 countries. Lancet. 2018;391:1023–1075.
- Li J, Jiang X, Li Z, et al. SP1-induced HOXD-AS1 promotes malignant progression of cholangiocarcinoma by regulating miR-520c-3p/MYCN. Aging (Albany NY). 2020;12:16304–16325.
- Iyer MK, Niknafs YS, Malik R, et al. The landscape of long noncoding RNAs in the human transcriptome. Nat Genet. 2015;47:199–208.
- Zhang P, Xiong K, Lv P, et al. Expression of lncRNA AK058003 in esophageal carcinoma and analysis of its intervention effect. Eur Rev Med Pharmacol Sci. 2020;24:5404–5411.
- Wang Y, Chen W, Lian J, et al. The lncRNA PVT1 regulates nasopharyngeal carcinoma cell proliferation via activating the KAT2A acetyltransferase and stabilizing HIF-1alpha. Cell Death Differ. 2020;27:695–710.
- Liu C, Jiang F, Zhang X, et al. Long non-coding RNA UCA1 modulates paclitaxel resistance in breast cancer via miR-613/CDK12 axis. Cancer Manag Res. 2020;12:2777–2788.
- Peng Y, Leng W, Duan S, et al. Long noncoding RNA BLACAT1 is overexpressed in hepatocellular carcinoma and its downregulation suppressed cancer cell development through endogenously competing against hsa-miR-485-5p. Biomed Pharmacothe. 2019;116:109027.
- Chen R, Zhou S, Chen J, et al. LncRNA BLACAT1/miR-519d-3p/CREB1 axis mediates proliferation, apoptosis, migration, invasion, and drug-resistance in colorectal cancer progression. Cancer Manag Res. 2020;12:13137–13148.
- Wang Z, Liu X, Liu X, et al. Long non-coding RNA BLACAT1 promotes the tumorigenesis of gastric cancer by sponging microRNA-149-5p and targeting KIF2A. Cancer Manag Res. 2020;12:6629–6640.
- Dai D, Feng XD, Zhu WQ, et al. LncRNA BLACAT1 regulates the viability, migration and invasion of oral squamous cell carcinoma cells by targeting miR-142-5p. Eur Rev Med Pharmacol Sci. 2019;23:10313–10323.
- Liu H, Zhang Q, Lou Q, et al. Differential analysis of lncRNA, miRNA and mRNA expression profiles and the prognostic value of lncRNA in esophageal cancer. Pathol Oncol Res. 2020;26:1029–1039.
- Hirai M, Maeda Y, Fukushima K, et al. Expression analysis of microRNAs in murine cochlear explants. Neuroreport. 2011;22:652–654.
- Prashad N. miR-665 targets c-MYC and HDAC8 to inhibit murine neuroblastoma cell growth. Oncotarget. 2018;9:33186–33201.
- Muhammad N, Bhattacharya S, Steele R, et al. Anti-miR-203 suppresses ER-positive breast cancer growth and stemness by targeting SOCS3. Oncotarget. 2016;7:58595–58605.
- Sun W, Yang Y, Xu C, et al. Regulatory mechanisms of long noncoding RNAs on gene expression in cancers. Cancer Genet. 2017;216-217:105–110.
- Zou W, Wolchok JD, Chen L. PD-L1 (B7-H1) and PD-1 pathway blockade for cancer therapy: mechanisms, response biomarkers, and combinations. Sci Transl Med. 2016;8:328rv324.
- Ribas A. Tumor immunotherapy directed at PD-1. N Engl J Med. 2012;366:2517–2519.
- Shi SJ, Wang LJ, Wang GD, et al. B7-H1 expression is associated with poor prognosis in colorectal carcinoma and regulates the proliferation and invasion of HCT116 colorectal cancer cells. PloS one. 2013;8:e76012.
- You W, Liu X, Yu Y, et al. miR-502-5p affects gastric cancer progression by targeting PD-L1. Cancer Cell Int. 2020;20:395.
- Zuo Y, Zheng W, Liu J, et al. MiR-34a-5p/PD-L1 axis regulates cisplatin chemoresistance of ovarian cancer cells. Neoplasma. 2020;67:93–101.
- Zhang C, Jiang F, Su C, et al. Upregulation of long noncoding RNA SNHG20 promotes cell growth and metastasis in esophageal squamous cell carcinoma via modulating ATM-JAK-PD-L1 pathway. J Cell Biochem. 2019;120(7):11642-11650.
- Chattopadhyay I, Phukan R, Singh A, et al. Molecular profiling to identify molecular mechanism in esophageal cancer with familial clustering. Oncol Rep. 2009;21:1135–1146.
- Liu J, Wang Y, Chu Y, et al. Identification of a TLR-induced four-lncRNA signature as a novel prognostic biomarker in esophageal carcinoma. Front Cell Dev Biol. 2020;8:649.
- Chen SG, Wang CH, He RQ, et al. LncRNA CASC11 promotes the development of esophageal carcinoma by regulating KLF6. Eur Rev Med Pharmacol Sci. 2019;23:8878–8887.
- Li W, Zhang L, Guo B, et al. Exosomal FMR1-AS1 facilitates maintaining cancer stem-like cell dynamic equilibrium via TLR7/NFkappaB/c-Myc signaling in female esophageal carcinoma. Mol Cancer. 2019;18:22.
- Wang M, Wang L, He X, et al. lncRNA CCAT2 promotes radiotherapy resistance for human esophageal carcinoma cells via the miR145/p70S6K1 and p53 pathway. Int J Oncol. 2020;56:327–336.
- Yang H, Qi Y, Wang XL, et al. Down-regulation of lncRNA BLACAT1 inhibits ovarian cancer progression by suppressing the Wnt/beta-catenin signaling pathway via regulating miR-519d-3p. Mol Cell Biochem. 2020;467:95–105.
- Zhou X, Gao W, Hua H, et al. LncRNA-BLACAT1 facilitates proliferation, migration and aerobic glycolysis of pancreatic cancer cells by repressing CDKN1C via EZH2-Induced H3K27me3. Front Oncol. 2020;10:539805.
- Hu X, Liu Y, Du Y, et al. Long non-coding RNA BLACAT1 promotes breast cancer cell proliferation and metastasis by miR-150-5p/CCR2. Cell Biosci. 2019;9:14.
- Ai L, Xu A, Xu J. Roles of PD-1/PD-L1 pathway: signaling, cancer, and beyond. Adv Exp Med Biol. 2020;1248:33–59.
- Abiko K, Matsumura N, Hamanishi J, et al. IFN-gamma from lymphocytes induces PD-L1 expression and promotes progression of ovarian cancer. Br J Cancer. 2015;112:1501–1509.
- Eichberger J, Schulz D, Pscheidl K, et al. PD-L1 influences cell spreading, migration and invasion in head and neck cancer cells. Int J Mol Sci. 2020;21(21):8089.
- Zhang C, Lian H, Xie L, et al. LncRNA ELFN1-AS1 promotes esophageal cancer progression by up-regulating GFPT1 via sponging miR-183-3p. Biol Chem. 2020;401:1053–1061.
- Dong Z, Zhang A, Liu S, et al. Aberrant methylation-mediated silencing of lncRNA MEG3 functions as a ceRNA in esophageal cancer. Mol Cancer Res. 2017;15:800–810.
- Chen FY, Zhou ZY, Zhang KJ, et al. Long non-coding RNA MIR100HG promotes the migration, invasion and proliferation of triple-negative breast cancer cells by targeting the miR-5590-3p/OTX1 axis. Cancer Cell Int. 2020;20:508.
- Luo ZF, Peng Y, Liu FH, et al. Long noncoding RNA SNHG14 promotes malignancy of prostate cancer by regulating with miR-5590-3p/YY1 axis. Eur Rev Med Pharmacol Sci. 2020;24:4697–4709.
- Zhao L, Liu Y, Zhang J, et al. LncRNA SNHG14/miR-5590-3p/ZEB1 positive feedback loop promoted diffuse large B cell lymphoma progression and immune evasion through regulating PD-1/PD-L1 checkpoint. Cell Death Dis. 2019;10:731.