
ABSTRACT
Clear cell renal cell carcinoma (ccRCC) is the most common subtype of renal carcinomas, with high mortality and poor prognoses worldwide. Succinate dehydrogenase (SDH) consists of four nuclear-encoded subunits and it is the only complex involved in both the tricarboxylic acid (TCA) cycle and oxidative phosphorylation (OXPHOS). Previous studies have shown decreased SDH activity in ccRCC. However, the role and underlying molecular mechanisms of SDH in ccRCC initiation and development remain unclear. In the present study, pan-cancer analysis of SDH gene expression was analyzed and the relationship between SDH gene expression and clinicopathological parameters was assessed using different databases. cBioPortal, UACLAN, and Tumor Immune Estimation Resource (TIMER) were subsequently utilized to analyze genetic alterations, methylation, and immune cell infiltration of SDH genes in ccRCC patients. We found SDHs were significantly downregulated in ccRCC tissues and correlated with ccRCC progression. Increased methylation and high SDH promoter mutation rates may be the cause of reduced expression of SDHs in ccRCC. Moreover, the interaction network showed that SDH genes were correlated with ferroptosis-related genes. We further demonstrated that SDH inhibition dampened oxidative phosphorylation, reduced ferroptotic events, and restored ferroptotic cell death, characterized by eliminated mitochondrial ROS levels, decreased cellular ROS and diminished peroxide accumulation. Collectively, this study provides new insights into the regulatory role of SDH in the carcinogenesis and progression of ccRCC, introducing a potential target for advanced antitumor therapy through ferroptosis.
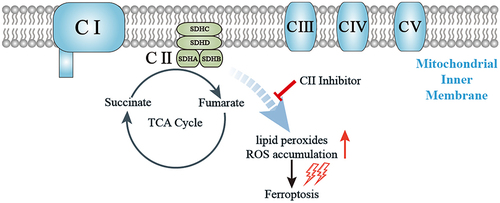
Graphical Abstract
Highlights
SDHs were downregulated in ccRCC tissues and correlated with ccRCC progression.
SDH genes were correlated with ferroptosis-related genes
SDH inhibition diminished peroxide accumulation and reduced ferroptotic cell death.
1. Introduction
Renal cell carcinoma (RCC) encompasses a heterogeneous group of cancers that originate from the renal tubular epithelia. It accounts for 85% of primary renal cancers, and over recent years, RCC has remained one of the most lethal urological malignancies, with a late and highly variable presentation that portends a poor survival prognosis [Citation1,Citation2]. There are multiple histological subtypes of RCC, each characterized by a unique molecular landscape, of which clear cell RCC (ccRCC) is the most common type, representing 75%–80% of all RCC cases, and arising from the proximal tubule cells of the kidney nephron [Citation3]. ccRCC has high risks of recurrence and metastasis, and it is associated with a poor prognosis. Its median survival time is approximately 13 months, and the 5-year survival rate is less than 10% [Citation4,Citation5]. Additionally, more than 100,000 patients with RCC die each year [Citation6]. Despite great advances in the diagnosis and treatment of ccRCC, the outcomes and prognosis of patients remain unsatisfactory [Citation7]. Therefore, it is necessary to explore novel biomarkers and potential targeted therapies for ccRCC [Citation8].
In the past decades, bioinformatics technology has been widely used to explore the potential genetic targets of various malignancies [Citation9]. It can provide the molecular background, regulatory pathway and cellular activity network of diseases. Some studies identify the differentially expressed genes (DEGs), PPI network, and the activated signaling pathways through bioinformatics analysis, and screened the most potential targets [Citation10–14]. Taking these methods, various DEGs and miRNAs were excavated in RCC to obtain potential targets and biomarkers [Citation15,Citation16]. These bioinformatic strategies not only contribute to finding novel signal transduction pathways for diseases but also help clinicians to assess the prognosis of diseases.
Mitochondria have recently been shown not only to serve as sensors and executioners of apoptosis but also to be involved in carcinogenesis, thus attracting increasing research interest in their function in tumorigenesis [Citation17,Citation18]. Succinate dehydrogenase (SDH), also named mitochondrial complex II (CII), is the only mitochondrial complex involved in both the tricarboxylic acid (TCA) cycle and mitochondrial oxidative phosphorylation (OXPHOS) [Citation19]. It is located on the inner mitochondrial membrane, and is comprised of four nuclear-encoded subunits (SDHA, SDHB, SDHC, and SDHD) [Citation20]. SDHA and SDHB are hydrophilic and project into the matrix. SDHC and SDHD are hydrophobic and form membrane anchors that provide binding sites for ubiquinone [Citation21]. Accumulating evidence suggests that germline or somatic mutations in TCA cycle enzymes are involved in various hereditary and sporadic carcinomas [Citation22]. SDH gene mutations have also been shown to cause familial paraganglioma and pheochromocytoma, and in some cases, gastrointestinal stromal tumors and RCC [Citation23]. Recent research has also revealed that loss of SDHB increases glucose uptake and is closely related to the shift to aerobic glycolysis in ccRCC cells, suggesting a more pronounced Warburg effect [Citation24]. Our recent work showed that decreasing the fuel for mitochondrial oxidative phosphorylation blocked lipid peroxidation and thus induced ferroptotic cell death [Citation25].
Based on the aforementioned data and findings, we postulated that the subunit of CII may be related to the molecular biological characteristics of ccRCC through the regulation of ferroptosis and could, therefore, be a potential indicator of tumor prognosis. In order to validate our hypothesis, we take advantage of bioinformatics technology to analyze SDH expression and its association with ccRCC patients’ prognosis. Then, the co-expression network of SDH genes with ferroptosis-related genes (FRGs) was analyzed using the TIMER database. Mechanistically, we observed ferroptotic cell death events such as mitochondrial reactive oxygen species (ROS), lipid peroxide, mitochondrial superoxide levels and mitochondrial oxygen consumption rate after pharmacological inhibition of the SDH in vitro experiments. This is the first study to unveil the role of SDH genes in the molecular characteristics of ccRCC and provide new insights into their regulatory role in ferroptotic cell death.
2. Materials and methods
2.1 Gene expression analysis
The mRNA levels of four distinct SDH genes in multiple cancer types were determined using TIMER2 (Tumor Immune Estimation Resource, Version 2) databases (http://timer.comp-genomics.org/). TIMER2 is a public web data source covering 32 cancer types and including 10,897 samples from The Cancer Genome Atlas (TCGA) database [Citation26]. We discovered the expression differences of each SDH gene between tumor and adjacent normal tissues. Additionally, the gene expression profiles were collected from Gene Expression Omnibus (GEO, https://www.ncbi.nlm.nih.gov/gds/?term=GSE40435) microarray series (GSE40435), which contained 101 ccRCC tumor and 101 normal kidney tissues.
2.2 Clinical correlation analysis
The analysis was carried out by using UALCAN (http://ualcan.path.uab.edu), a convenient online tool based on the TCGA RNA sequencing data. The website hosts a big collection of different mRNA expressions of target genes across tumor and control samples, as well as clinicopathologic features [Citation27]. We use UALCAN database to determine the correlation between SDH genes, individual cancer pathological stages and histologic grades of ccRCC patients. The difference of mRNA expression was compared by students’ t-test.
2.3 Survival analysis
We used the ‘Survival Analysis’ module of Gene Expression Profiling Interactive Analysis (GEPIA) (http://gepia.cancer-pku.cn/index.html) to obtain the OS (Overall survival) and DFS (Disease-free survival) data of SDH genes in ccRCC based on TCGA [Citation28]. A cutoff value of 50% was set up as the expression thresholds for separating the high expression and low expression cohorts. The log-rank test was used and statically significant difference was considered when p-value < 0.05.
2.4 Univariate and multivariate Cox logistic regression analysis
To further determine the effect of SDH genes expression in ccRCC patients, we use univariate Cox regression analysis to explore the association between the expression of each SDH gene and the OS in ccRCC patients. Multivariate Cox analysis was used to evaluate the influence of SDH genes expression and other clinicopathological factors (age, gender, TNM stages, pathologic stages and histologic grades) on OS of patients with ccRCC. ccRCC patient datasets with gene expression profiles and corresponding clinical and pathological information were collected from the TCGA databases [Citation29], which included 539 ccRCC tissues and 72 adjacent normal tissues. Subsequent processing excluded cases with missing data on age, gender, pathological diagnosis and OS time.
2.5 Immune cell infiltration analysis
In the systematic analysis of the infiltration of different immune cells and SDH genes expression in ccRCC patients, we employed the TIMER database (https://cistrome.shinyapps.io/timer/). The immune score, stromal score, and ESTIMATE score of each ccRCC patient were generated by R packages ‘estimate’ (version 1.0.13) to access the infiltration level of immune cells and stromal cells in ccRCC tissues [Citation30]. Subsequently, the association of the expression of SDH genes and the immune score, stromal score, and ESTIMATE score was calculated by the Spearman test.
2.6 Mutation and methylation analysis
cBioPortal (www.cbioportal.org) is an integrated and multifunctional web resource, providing us with visual and multidimensional analysis of cancer genomics data [Citation31]. Based on cBioPortal, summary of alterations in different SDH genes and survival curves stratified by SDHs mutation were analyzed. In addition, methylation levels of each SDH genes promoter were also analyzed by UALCAN.
2.7 Functional and pathway enrichment analysis
STRING (https://string-db.org/) is a collected and comprehensive available source of protein-protein interaction (PPI) networks [Citation32]. We conducted the PPI networks to explore the potential interactions of each SDH gene using the online tool STRING database, and obtained fifty proteins that are associated with SDH genes under the conditions: network type (full STRING network), required scored (medium confidence), and other default parameters. To explore the functional annotation of SDHs and their interacted genes, Gene Ontology (GO) and Kyoto Encyclopedia of Genes and Genomes (KEGG) analysis were executed by R, and data visualization was conducted by ggplot2 package.
2.8 Co-expression network of SDH genes with ferroptosis-related genes in ccRCC
Thirty-eight FRGs were retrieved from the wikipathways website (https://www.wikipathways.org/). Wikipathways is an openly biological pathway database characterized by its collaborative nature and science approaches [Citation33]. Co-expression network of SDH genes with FRGs in ccRCC was performed with the igrahp and ggraph package of R.
2.9 Cell lines
786-O and HEK 293cells were preserved and passaged by our laboratory. Cells were cultured with DMEM medium (Hyclone, Logan, UT, USA) supplemented with 10% FBS (Gibco, Grand Island, USA), 1% penicillin (100 U/mL) and streptomycin (100 μg/mL). All cells were cultured at 37°C and maintained in a humidified cell incubator with an atmosphere of 5% CO2.
2.10 Reagents and antibodies
Erastin, GSH, Ferrostatin-1 were purchased from Selleck Chemicals (Houston, TX). DFO, 2-Thenoyltrifluoroacetone (TTFA), Lonidamine (LND), diethyl butylmalonate (DBM), Antimycin A, 2’,7’-dichlorofluore scindiacetate (DCF-DA) were purchased from Sigma-Aldrich (St. Louis, USA). Cell Counting Kit-8 (CCK-8) kit was obtained from MultiSciences (Hangzhou, China). Lipid Peroxidation Fluorescent Probe (C11 BODIPY 581/591), mitoSOX fluorescence probes were purchased from Thermo Fisher Scientific (Waltham, MA).
2.11 Cell viability assay
The cell viabilities of ccRCC cells were measured by Cell Counting Kit-8 assay (CCK-8) according to the manufacturer’s instructions. Briefly, 2 × 10⁴ cells were plated in three replicates in a 96 well plate (NEST Biotechnology) and incubated with erastin in the presence or absence of inhibitors. Then, after the designed treatment, 10 µL CCK-8 was added to each well and incubation was continued for 1.5 h. The OD was measured at an absorbance of 450 nm using a microplate reader.
2.12 Detection of ROS
Cells in a 6-well plate were treated with erastin in the presence or absence of inhibitors for 12 h. Cells were then stained with DCF-DA (4 µM) for 30 min in dark at 37°C. Finally, the fluorescence intensity was detected by flow cytometry.
2.13 Confocal microscopy assays
Cells were seeded in four-well chambers dish and incubated with erastin in the presence or absence of SDH inhibitors, then cells were stained with DCF-DA (4 µM), mitoSOX (5 µM), BODIPY (5 µM) respectively. DAPI was used for nuclear staining. After staining in the incubator for 30 min, cells were washed with PBS 3 times, and representative images were photographed by the Leica confocal microscope.
2.14 Oxygen consumption rate (OCR) determination
2 × 10⁴ cells were seeded in XFe24 seahorse cell culture microplate (Seahorse Bioscience) for 24 h, and the XFe24 sensor cartridges were hydrated overnight. The cells were treated with TTFA for 2 h, then the cell medium was replaced by basic seahorse DMEM supplemented with glucose (10 mM), sodium pyruvate (1 mM) and glutamine (2 mM). Subsequently, the cell culture microplate was then kept in the CO2-free incubator for 1 h, and OCR was measured in real-time with the sequential injection of oligomycin (1.5 μM), carbonyl cyanide-chlorophenylhydrazone (CCCP) (2.0 μM) and Antimycin A/Retenone (0.5 μM) by the Seahorse XFe 24 Bioanalyzer (Seahorse Bioscience).
2.15 Statistical analysis
The data were shown as the mean ± S.D. Differences between the two groups were assessed with Student’s t-test and comparisons among multi groups were evaluated by the analysis of variance (ANOVA) using GraphPad Prism version 5.0. The value of P < 0.05 was considered statistically significant.
3. Results
In the current study, we used several online datasets to analyze SDH expression and its association with prognosis. The TIMER2, UACLAN, and GEPIA databases showed that the expression levels of SDH genes in ccRCC tissues were downregulated and significantly correlated with ccRCC progression. The infiltration of various immune cells and their clinical effects in ccRCC were evaluated using the TIMER database, and the methylation levels and mutation rates of each SDH gene were determined. In addition, the protein-protein interaction (PPI) network of SDH genes was investigated using STRING, and the co-expression network of SDH genes with FRGs was analyzed using the TIMER database. Mechanistically, decreased SDH expression results in reduced OXPHOS in ccRCC, which renders cancer cells capable of blocking lipid peroxidation and ferroptotic cell death.
3.1 SDH gene expression is downregulated in ccRCC tumors and is correlated with their progression
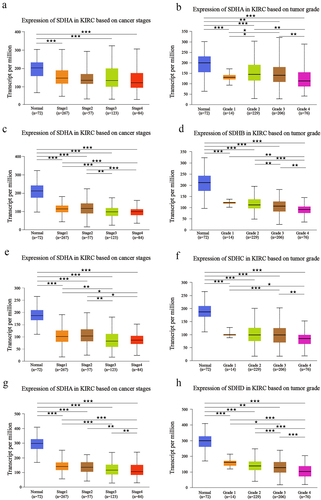
To systematically explore the distinct expression of different SDH genes across a spectrum of cancer types, mRNA expression in 32 types of cancer was analyzed using the TIMER2.0 database. Based on the data obtained (), expression levels of SDHA, SDHB, SDHC, and SDHD were significantly reduced in tumor samples of ccRCC versus normal tissues (p < 0.001). The downregulation of four SDH genes was further validated externally in GEO DataSets (GSE40435) and the results were similar to that of the pan-cancer analysis (). These results indicated that SDH genes expression level in ccRCC was significantly lower in comparison to normal tissues. We then determine the correlation of SDH expression and the clinicopathological parameters in ccRCC patients by using the UALCAN database. The expression of SDH genes was obviously correlated with higher cancer stages and individual tumor grades. Patients with lower expression levels of four subunits of CII tended to be in an advanced cancer stage or tumor grade (p < 0.05) (). These data suggest that the four subunits of CII are closely related to tumor malignancy and progression in ccRCC patients.
Figure 1. The expression abundance of four SDH genes in multiple cancer types. (a) Gene expression profile of four SDH genes in different cancers types and its homologous normal tissues. (b-e) The expression levels of four distinct SDH genes between tumor and paracancerous tissue in ccRCC (GSE40435). ★P < 0.05, ★★P < 0.01, ★★★P < 0.001 versus indicated groups.
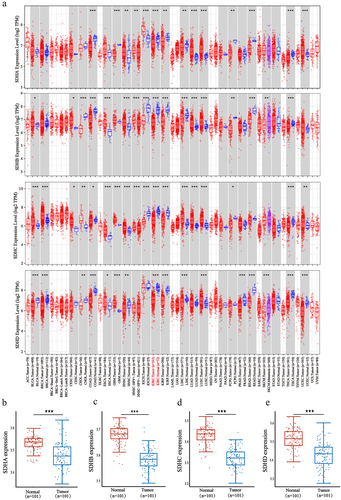
Figure 2. Relationship between expression of SDH with individual cancer pathological stages and histologic grades of ccRCC patients. ★P < 0.05, ★★P < 0.01, ★★★P < 0.001 versus indicated groups.
3.2 Prognostic value of different SDH genes in patients with ccRCC
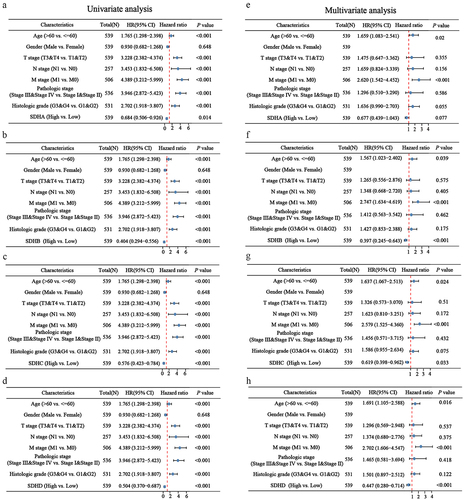
To evaluate the prognostic value of SDH genes in ccRCC patients, overall survival (OS) and disease-free survival (DFS) were performed by GEPIA. In patients with ccRCC, low transcriptional levels of SDHB, SDHC, and SDHD were significantly associated with worse DFS and OS (); however, SDHA expression was not significantly associated with survival (). Furthermore, univariate Cox regression analysis revealed that age, T, N, M stages, pathologic stages, histologic grades and low expression of SDHA, SDHB, SDHC, and SDHD were correlated with high hazard ratios (HR) in patients with ccRCC (). Multivariate Cox regression analysis indicated that age, M stage, and downregulation of SDHB, SDHC, and SDHD were independent factors correlated with high HR in patients with ccRCC (p < 0.01) (). These results illustrate the significant prognostic value of SDH genes in patients with ccRCC.
Figure 3. Prognostic value of different SDH genes in patients with ccRCC. The overall survival (OS) and disease-free survival (DFS) survival rate of ccRCC patients based on different SDH subunit expressions.
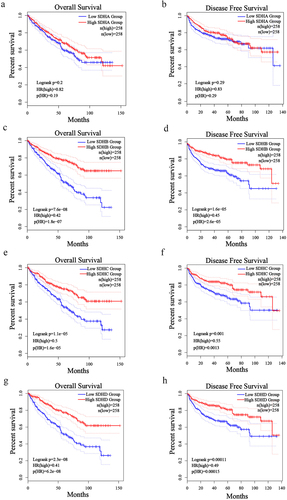
Figure 4. The correlation analysis between SDH genes expression and clinicopathologic characteristics in ccRCC patients. (a-d) The forest plot of ccRCC patients’ clinicopathologic features using univariate Cox regression analysis. (e-h) The forest plot of ccRCC patients’ clinicopathologic characteristics applying multivariate Cox regression analysis.
3.3 Correlation analysis between SDH gene expression and infiltrating immune cells
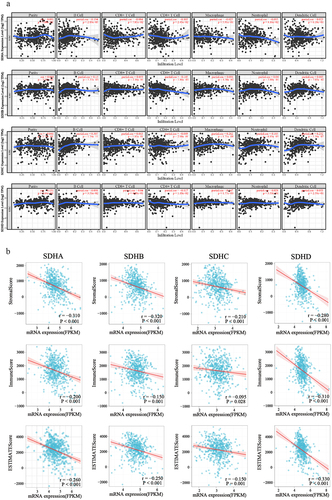
Multiple researches have displayed that the prognosis of patients is affected by an abundance of infiltrating immune cells, and the immune response [Citation34]. RCC is a group of malignancies that characterized by immune-infiltrated, and immune checkpoint inhibitors, such as PD-1/PD-L1 antibody, have been approved for frontline immune therapies in metastatic RCC [Citation35]. To reveal the differences in the immune microenvironment, the TIMER database was utilized to investigate the correlations of SDH gene expression with six types of immune infiltration. The results demonstrated that the expression level of SDHA exhibited obvious positive correlation with infiltrating levels of B cells (r = 0.194, p = 2.89e-5), CD4 + T cells (r = −0.105, p = 2.45e-2) and neutrophils (r = −0.095, p = 4.16e-2); expression of SDHB was in connection with infiltrating levels of B cells (r = 0.13, p = 5.73e-3), CD4 + T cells (r = −0.145, p = 1.86e-3) and macrophages (r = 0.096, p = 4.30e-2); expression of SDHC also had strong correlation with infiltration of B cells (r = 0.307, p = 1.74e-11), macrophages (r = 0.262, p = 1.71e-08), neutrophils (r = 0.185, p = 6.95e-05), and dendritic cells (r = 0.232 p = 5.56e-07); and a positive association exists between the SDHD expression level and infiltrating levels of purity (r = 0.131, p = 4.64e-03), B cells (r = 0.098, p = 3.51e-2), CD4 + T cells (r = −0.117, p = 1.18e-2), and macrophages (r = 0.147, p = 1.77e-03) in ccRCC. (). Subsequently, we utilized the ESTIMATE method to calculate the stromal score, immune score, and ESTIMATE score for each patient with ccRCC. Spearman’s correlation analysis demonstrated that the expression of SDHA, SDHB, SDHC, and SDHD were negatively correlated with the stromal, immune, and ESTIMATE scores (). These results strongly suggest that SDH gene expression could represent a tumor immune infiltration state in ccRCC.
Figure 5. Correlations analysis of SDH genes expression with various immune cell infiltration in ccRCC. (a) The correlation between infiltrating level of six immune cells and SDH genes in ccRCC. (b) The correlation of SDHA, SDHB, SDHC, and SDHD mRNA expression levels with the stromal score, immune score, as well as ESTIMATE score. P < 0.05 was considered statistically significant.
3.4 Genetic mutations and methylation level in SDH genes
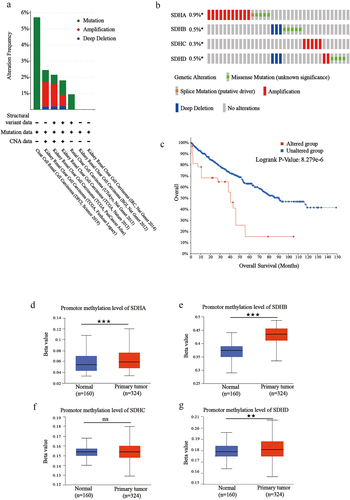
Since expression levels of SDH genes were downregulated in patients with ccRCC, we evaluated their genetic alterations in these patients, using cBioPortal. Two or more alterations were detected in different SDH genes, and amplification alterations were the most common in ccRCC (). SDHA, SDHB, SDHC, and SDHD were altered in 0.9%, 0.5%, 0.3%, and 0.5% of the ccRCC samples, respectively, with a total mutation rate of 2.2% (). Next, we used the cBioPortal dataset to present the OS curve of ccRCC patients with or without SDH mutations. As shown in , the mutation group was significantly associated with a shorter OS, with a p-value of 8.279e-6. Considering that DNA methylation commonly modulates gene expression, the methylation levels of SDH genes promoters in ccRCC tissues were also analyzed and shown to be significantly increased (). The results showed that increased methylation levels and high mutation rates may be the partial factors in the down-regulated SDH genes.
Figure 6. Mutation and methylation analysis of SDH genes in ccRCC. (a-b) Mutation frequency of each SDH gene in the ccRCC patients from TCGA. (c) Survival analysis of ccRCC patients stratified by SDHs mutation. (d-g) The box plot shows the promoter methylation levels of SHDA, ADHB, SDHC, and SDHD in ccRCC based on the TCGA database. Beta value represents the level of DNA methylation. The data were presented as mean ± SD. ★★P < 0.01, ★★★P < 0.001 versus indicated groups.
3.5 Predicted functions of SDH genes and their 50 associated genes in patients with ccRCC
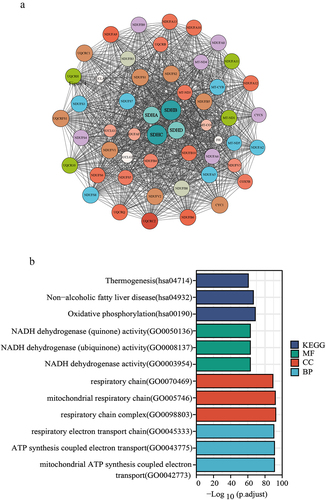
After analyzing the genetic alterations in SDH genes, we conducted a PPI network with SDH genes to perform predictive analysis through interaction visualization (). The top 10 proteins included SUCGL1, SUCGL2, FH, UQCRC2, NDUFV1, NDUFS2, SDHAF2, UQCRFS1, CYCS, and NDUFV2. Enrichment analyses of the GO and KEGG pathways of SDHs and their 50 neighboring genes were performed. As shown in , biological processes such as GO:0045333 (respiratory electron transport chain), GO:0043775 (ATP synthesis coupled electron transport) andGO:0042773 (mitochondrial ATP synthesis coupled electron transport) were considerably enriched. Cellular components, such as GO:0098803 (respiratory chain complex), GO:0070469 (respiratory chain), and GO:0005746 (mitochondrial respiratory chain) were found to be associated with SDH interaction genes. Moreover, in molecular functions, GO:0003954 (NADH dehydrogenase activity), GO:0008137 (NADH dehydrogenase (ubiquinone) activity), and GO:0050136 (NADH dehydrogenase (quinone) activity) were related to SDH interaction genes. Then, we used KEGG analysis to determine the exact pathways related to SDH and 50 frequently associated neighboring genes. The most relevant pathways were as follows: hsa00190 (oxidative phosphorylation), hsa04932 (nonalcoholic fatty liver disease) and hsa04714 (thermogenesis).
Figure 7. Identified the functions and signaling pathways of SDH genes. (a) Protein-protein interaction (PPI) network of SDH genes, visualized by Cytoscape. Different colors stand for various genes, and the circle size represents the number of nodes. (b) Enrichment analysis of SDH-related genes, which was performed by R.
3.6 ccRCC is sensitized to ferroptosis
Previous works from our group and others have discovered that diverse cellular metabolic pathways in mitochondria are tightly linked with ferroptosis [Citation25,Citation36,Citation37]. Based on our finding that SDH gene expression is correlated with the progression of ccRCC, we next performed the correlation analysis of SDH genes with FRGs. The co-expressed gene network () showed that IRP2, NCOA4, SLC40A1, ACSL1, GCLC, VDAC2, and VDAC3 were all correlated with SDHB, SDHC, and SDHD (r > 0.4, p < 0.05). The genes most correlated with SDH were NCOA4 and IRP2 (). To determine the role of ferroptosis in ccRCC, 786-O cells were treated with the classic ferroptosis inducer erastin, and cell viability was measured. The results showed that erastin exerted toxicity toward 786-O cells and reduced cell viability in a dose-dependent manner, whereas the antioxidant (GSH), ferroptosis inhibitor (ferrostatin-1), and iron chelator (DFO) could significantly rescue ferroptotic cell death in erastin-treated cells. ()
Figure 8. Correlation analysis between SDH genes and FRGs in ccRCC. (a) The interaction networks diagram of SDH genes and FRGs. The green or red lines represent negative and positive correlations, respectively. (b) The scatter plot shows the correlation between SDH genes and NCOA4, or IRP2.
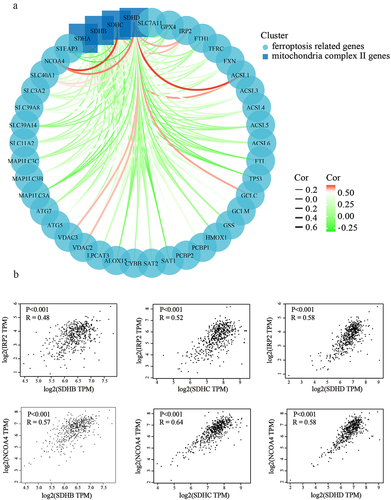
Figure 9. Erastin induced ferroptotic cell death toward 786-O cells. (a) 786-O cells were treated with different concentrations of erastin. The cell viability was assessed by CCK8 assay. (b) 786-O cells were treated with erastin in the presence or absence of ferroptosis inhibitors, then cell viability was assessed by CCK8 assay. (c) 786-O cells and HEK293 cells were treated with or without TTFA, mitochondrial respiratory was tested by Seahorse XFe 24 Extracellular Flux Analyzer. (d) The oxygen consumption rate of spare respiratory capacity was calculated.
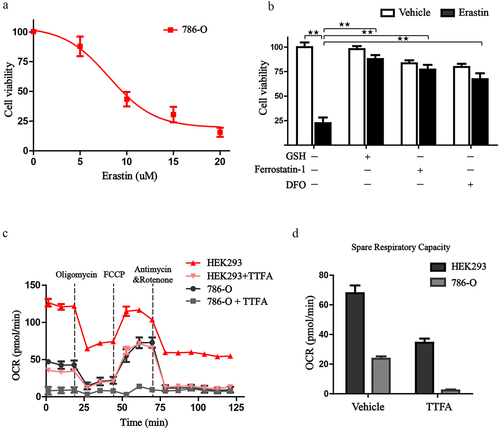
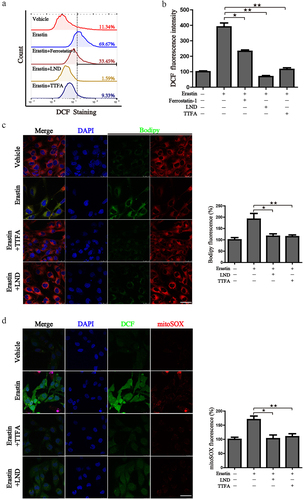
Previous research has revealed that mitochondria take the center role in ferroptosis by fueling metabolic molecules, hyperpolarizing the mitochondrial membrane potential, and subsequently inducing lipid peroxide accumulation [Citation38]. We then explored the mitochondrial respiration potential of ccRCC and human renal epithelial cells using a Seahorse XFe 24 Extracellular Flux Analyzer. Consequently, the oxygen consumption rate (OCR) of 786-O cells was noticeably lower than that of human renal epithelial cells HEK293 cells. In addition, when complex II was inhibited by TTFA, the oxygen consumption by 786-O cells was almost blocked, demonstrating that impairment of SDH results in a near-complete impairment of oxidative phosphorylation (. To further characterize the basis of SDH expression in ferroptosis, 786-O cells were treated with erastin in the presence of several complex II inhibitors. Of note, inhibitors of mitochondrial complex II significantly restored ferroptotic cell death () together with reduced ferroptotic events including ameliorating superoxide production and lipid peroxidation in 786-O cells (). We observed a similar phenomenon with the inhibition of complex III (antimycin A) and complex IV (NaN3) (). Additionally, we detected mitochondrial ROS generation, which originates from the electron leakage of the electron transport chain and leads to mitochondrial oxidative stress. The results determined by mitoSOX probe staining validated that mitochondrial radical was accumulated when ferroptosis was activated by erastin, while both TTFA and LND can almost neutralize the erastin induced mitochondrial and cellular oxidative stress (). Collectively, these results demonstrated that downregulated SDH could render ccRCC more resistant to ferroptosis together with reduced oxidative stress through impaired oxidative phosphorylation.
Figure 10. Inhibition of SDH attenuates the ferroptotic cell death in 786-O cells. (a-c) Cell viability of 786-O cells was detected in the presence or absence of different SDH inhibitors when challenged by erastin. (d) 786-O cells treated with erastin alone or in combination with NaN3 and Antimycin A.
Figure 11. Suppression of SDH attenuates the ferroptotic associated events. (a) 786-O cells were treated with erastin alone or in combination with different inhibitors, cellular ROS was monitored by the DCF-DA probe. (b) Mean DCF fluorescence intensity was detected after the designed treatment. (c-d) 786-O cells were treated as designed and stained with Bodipy, DCF-DA, mitoSOX. The images were taken by a laser confocal microscope. Scale bar: 50 μm. Statistical results of the fluorescence intensities were shown on the right. ★P < 0.05, ★★P < 0.01 versus indicated groups.
4. Discussion
As the most common subtype of RCC, ccRCC accounts for the majority of RCC-related deaths [Citation39]. ccRCC usually has a poor prognosis because of the high risk of recurrence and metastasis. Previous research has confirmed that ccRCC is strongly related to von Hippel-Lindau (VHL) gene mutation [Citation40]. Furthermore, several molecular factors and signaling pathways have been shown to modulate the progression in ccRCC, including the VHL-HIF-VEGF pathway, PI3K/AKT/mTOR pathway, and Wnt/β-catenin pathway [Citation41]. Additionally, recent research has identified targeting the ACE2/Ang-(1-7) axis is a promising therapeutic strategy [Citation42]. Other studies have discovered new markers, like SPOP (targeted by miR-520,372/373) and CBP (targeted by miR-200a-3p), as a tractable target for the treatment of ccRCC [Citation43]. ccRCC tumors harbor mutations in the VHL gene, resulting in the loss of oxygen-sensing ability, increasing the stability of hypoxia-inducible factors (HIFs), and thus inducing metabolic reprogramming. Metabolic analyses of ccRCCs showed that the decrease of fumarate and malate levels and the increase of succinate, citrate and isocitrate levels are prominent features of metabolic reprogramming [Citation44,Citation45]. At the same time, gene expression analyses showed that glycolysis components such as glucose transporter 1, hexokinase, and lactate dehydrogenase A are upregulated, while TCA cycle components are downregulated in ccRCC. Metabolic reprogramming is closely correlated with a high level of tumor grade, stage, and low survival time [Citation44]. Recently, a small-molecule agent PT2399 that specifically inhibits the activity of HIF2 was developed [Citation45]. Currently, in order to explore more efficient therapeutic targets, various bioinformatics studies have focused on searching or predicting potential biomarkers by analyzing the variance of genes and built prediction models of ccRCC [Citation46]. Some studies focused on N6-methyladenosine (m6A) modified differentially expressed genes [Citation47] or long non-coding RNAs (lncRNAs) [Citation48], which provide different predictive biomarkers of ccRCC. In our current work, we discover the critical value of SDH gene family in the carcinogenesis and progression of ccRCC and provide new insights into their regulatory role in ferroptotic cell death. The elucidation of signal pathway regulation is expected to provide a basis for the development of effective therapeutic schedule.
Germline mutations in TCA cycle enzyme genes have been shown to participate in several aspects of tumorigenesis and tumor advancement. SDH-deficient RCC was classified as a temporary entity in the International Society of Urological Pathology consensus conference Vancouver Classification 2013, and was accepted as a unique RCC subtype by the World Health Organization Classification of Renal Tumors in 2016 [Citation49]. Similar to FH-deficient RCC, SDH-deficient RCC is featured by TCA cycle impairment, accompanied by a shift from OXPHOS to aerobic glycolysis [Citation24]. Patients with germline pathogenic variations of SDH genes are at risk of developing early-onset, bilateral, and multifocal RCCs that tend to metastasize when tumors are in their early stage [Citation24]. In our study, we found that the expression of four subunits of mitochondrial complex II was significantly decreased in ccRCC tissues compared to normal tissues in the TIMER datasets, which was further validated in GSE40435, a dataset harbors 101 pairs of ccRCC tumors and adjacent non-tumor renal tissue which is widely used in many studies [Citation50,Citation51]. Furthermore, we discovered the downregulated expression of SDH was negatively correlated with the pathological stages and histologic grades of patients with ccRCC. Survival analysis showed that low SDHB, SDHC, and SDHD expression were both associated with poor OS and DFS. Apparently, downregulated expression of SDH genes has an adverse effect on patients with ccRCC. In addition, this study revealed that the expression of SDH genes is significantly correlated with the infiltration levels of B cells and CD4+ T cells in ccRCC. Therefore, SDH genes participate in the tumorigenesis of ccRCC and may serve as a potential prognostic biomarker in ccRCC, which is partly consistent with Fang’s study [Citation52]. Notably, our findings suggest that all the four subunits are closely linked to ccRCC progression.
Familial SDH mutations have been found to cause kidney tumors, and missense mutations are most prevalent in the Fe–S cluster binding domain of SDH, resulting in CII dysfunction [Citation53]. Through data mining, we found that mutations in SDH genes were observed in 2.2% of patients with ccRCC, and the genetic variation in SDH was associated with shorter OS. The mechanism underlying the association between SDH mutations and RCC has not been clarified clearly. A study discovered that the upregulation of miR-142-5p may be the cause of the downregulation of SDHB in colorectal cancer [Citation54]. Interestingly, our study demonstrated that upregulation of methylation levels in the promoter regions may be the cause for the downregulation of SDHA, SDHB, and SDHD in ccRCC. Therefore, we propose that the downregulation of SDH levels could be regulated by both gene mutations and methylation.
Recent studies have reported that ferroptosis may participate in ccRCC-associated mechanisms and tumor immunity [Citation46]. Ferroptosis is a newly defined programmed cell death with the hallmark of the lethal phospholipid peroxide accumulation oriented from free iron overloading [Citation37]. Various cancer cells are resistant to traditional chemotherapy, and certain targeted therapies turn out to be sensitive to ferroptosis [Citation55]. Currently, it has been reported that therapies that could induce the overload of free iron, and chemical molecules such as sorafenib, artemisinin, and erastin, have been screened for their ability to effectively induce ferroptosis in tumor cells [Citation56,Citation57]. Particularly, iron-rich tumors, including hepatocellular carcinoma [Citation58], breast cancer, non-small cell lung cancer, and pancreatic ductal adenocarcinoma [Citation59] are more suitable for the treatment of inducing ferroptosis. To date, the primary pathway of ferroptosis has been established, but its role in the progression of ccRCC and its underlying regulatory mechanism remain unknown. We found that the expression of SDH was closely associated with FRGs. The oxygen consumption rate (OCR) of ccRCC cells was much lower than that of renal epithelial cells. SDH inhibition could restore ferroptotic cell death. A recent study showed that SDH dysfunction leads to the accumulation of succinate, resulting in a gain of 5-methylcytosine, and eventually enhancing the invasiveness of ccRCC by inhibiting ten-eleven translocation-2 activity [Citation60]. As SDH is the only complex that takes part in both the TCA cycle and OXPHOS, succinate accumulation leads to the succination of Keap1, NRF2 stabilization, and the transcriptional activation of stress-response genes, thus promoting the antioxidant phenotype [Citation61]. In this study, we also found that inhibition of SDH significantly ameliorated lipid peroxidation induced by erastin. In summary, these results demonstrated that downregulation of SDH could render ccRCC more resistant against ferroptosis through impaired oxidative phosphorylation. However, our study also has several limitations. Our analysis uses public databases and lacks validation by our own cohort. Furthermore, in the experimental part, we used several specific drugs to inhibit the activity of SDH, without further validation by gene knockout or overexpression of SDH. Therefore, more in-depth research needs to be done in the future to explore the regulatory role of SDH genes in ccRCC.
5. Conclusion
Our comprehensive analyses indicated that four subunits of SDH were downregulated in ccRCC tissues which may be resulting from the increased methylation levels and high mutation rates. The decreased SDH subunits were associated with unfavorable progression and represented tumor immune infiltration state in ccRCC. Our further experiments proved that SDH inhibition was capable of blocking ferroptotic cell death through dampening oxidative phosphorylation, with reduced ferroptotic events characterized as diminished peroxides accumulation, declined cellular ROS, eliminated mitochondrial ROS level. Collectively, this work provides new insights into the regulatory role of SDH in the carcinogenesis and progression of ccRCC and is hopeful to be a potential biomarker for therapeutic intervention through ferroptosis.
Abbreviations
RCC: renal cell carcinoma; ccRCC: clear cell renal cell carcinoma; SDH: succinate dehydrogenase; CII: mitochondrial complex II; TCGA: The Cancer Genome Atlas; GEO: Gene Expression Omnibus; TCA: tricarboxylic acid; OXPHOS: oxidative phosphorylation; GEPIA: Gene Expression Profiling Interactive Analysis; TIMER: Tumor Immune Estimation Resource; PPI: protein-protein interaction; FRGs: ferroptosis-related genes; OS: overall survival; DFS: disease-free survival; GO: Gene Ontology; KEGG: Kyoto Encyclopedia of Genes and Genomes; BP: biological processes; CC: cellular components; MF: molecular functions; OCR: oxygen consumption rate; CCK-8: Cell Counting Kit-8 assay; TTFA: thenoyltrifluoroacetone; LND: lonidamine; DBM: diethyl butylmalonate; m6A: N6-methyladenosine; lncRNAs: long non-coding RNAs
Authors’ contributions
Jing Du, Xiangmin Tong and Ying Wang conceived and designed the experiments. Jing Yang, Chen Yuan and Shida Chen download and analyze the data. Yi Zhou, Yanchun Li and Wanye Hu performed the experiments. Gao Qi, Yuzhou Chen, Yunyi Wu, and Jing Liu contributed with material and data sharing. Jing Du and Jing Yang wrote the paper. Jing Du, Xiangmin Tong and Ying Wang revised and finalized the manuscript. All authors read and approved the final manuscript.
Availability of data and materials
Publicly available datasets were analyzed in this study. These data can be found here: https://www.ncbi.nlm.nih.gov/geo/query/kirc.cgi?kirc=GSE40435.
Disclosure statement
No potential conflict of interest was reported by the author(s).
Additional information
Funding
References
- Capitanio U, Bensalah K, Bex A, et al. Epidemiology of renal cell carcinoma. Eur Urol. 2019;75(1):74–84.
- Cairns P. Renal cell carcinoma. Cancer Biomark. 2010;9(1–6):461–473.
- Nabi S, Kessler E, Bernard B, et al. Renal cell carcinoma: a review of biology and pathophysiology. F1000Res. 2018;7:307.
- Hsieh J, Purdue M, Signoretti S, et al. Renal cell carcinoma. Nat Rev Dis Primers. 2017;3(1):17009.
- Cohen H, McGovern F. Renal-cell carcinoma. N Engl J Med. 2005;353(23):2477–2490.
- Capitanio U, Montorsi F. Renal cancer. Lancet. 2016;387(10021):894–906.
- Sánchez-Gastaldo A, Kempf E, González Del Alba A, et al. Systemic treatment of renal cell cancer: a comprehensive review. Cancer Treat Rev. 2017;60:77–89.
- Tan G, Xuan Z, Li Z, et al. The critical role of BAP1 mutation in the prognosis and treatment selection of kidney renal clear cell carcinoma. Transl Androl Urol. 2020;9(4):1725–1734.
- Shao F, Li Y, Hu W, et al. Downregulation of CISD2 has prognostic value in non-small cell lung cancer and inhibits the tumorigenesis by inducing mitochondrial dysfunction. Front Oncol. 2020;10:595524.
- Rajan B, Abunada T, Younes S, et al. Involvement of essential signaling cascades and analysis of gene networks in diabesity. Genes (Basel). 2020;11:11.
- Udhaya Kumar S, Madhana Priya N, Thirumal Kumar D, et al. An integrative analysis to distinguish between emphysema (EML) and alpha-1 antitrypsin deficiency-related emphysema (ADL)-A systems biology approach. Adv Protein Chem Struct Biol. 2021;127:315–342.
- Udhaya Kumar S, Saleem A, Thirumal Kumar D, et al. A systemic approach to explore the mechanisms of drug resistance and altered signaling cascades in extensively drug-resistant tuberculosis. Adv Protein Chem Struct Biol. 2021;127:343–364.
- Fu D, Zhang B, Yang L, et al. Development of an immune-related risk signature for predicting prognosis in lung squamous cell carcinoma. Front Genet. 2020;11:978.
- Udhaya Kumar S, Thirumal Kumar D, Bithia R, et al. Analysis of differentially expressed genes and molecular pathways in familial hypercholesterolemia involved in atherosclerosis: a systematic and bioinformatics approach. Front Genet. 2020;11:734.
- Li F, Guo P, Dong K, et al. Identification of key biomarkers and potential molecular mechanisms in renal cell carcinoma by bioinformatics analysis. J Comput Biol. 2019;26(11):1278–1295.
- Zou Y, Lu Q, Yao Q, et al. Identification of novel prognostic biomarkers in renal cell carcinoma. Aging (Albany NY). 2020;12(24):25304–25318.
- Wang X. The expanding role of mitochondria in apoptosis. Gene Dev. 2001;15(22):2922–2933.
- Reed JC. Mechanisms of apoptosis avoidance in cancer. Curr Opin Oncol. 1999;11(1):68.
- Hensen E, Bayley J. Recent advances in the genetics of SDH-related paraganglioma and pheochromocytoma. Fam Cancer. 2011;10(2):355–363.
- Dalla Pozza E, Dando I, Pacchiana R, et al. Regulation of succinate dehydrogenase and role of succinate in cancer. Semin Cell Dev Biol. 2020;98:4–14.
- Rustin P, Munnich A, Rötig A. Succinate dehydrogenase and human diseases: new insights into a well-known enzyme. Eur J Human Genet. 2002;10(5):289–291.
- Eng C, Kiuru M, Fernandez M, et al. A role for mitochondrial enzymes in inherited neoplasia and beyond. Nat Rev Cancer. 2003;3(3):193–202.
- Gill A. Succinate dehydrogenase (SDH)-deficient neoplasia. Histopathology. 2018;72(1):106–116.
- Linehan W, Schmidt L, Crooks D, et al. The metabolic basis of kidney cancer. Cancer Discov. 2019;9(8):1006–1021.
- Li Y, Wang X, Huang Z, et al. CISD3 inhibition drives cystine-deprivation induced ferroptosis. Cell Death Dis. 2021;12(9):839.
- Li T, Fu J, Zeng Z, et al. TIMER2.0 for analysis of tumor-infiltrating immune cells. Nucleic Acids Res. 2020;48(W1):W509–W14.
- Chandrashekar D, Bashel B, Balasubramanya S, et al. UALCAN: a portal for facilitating tumor subgroup gene expression and survival analyses. Neoplasia (New York, NY). 2017;19(8):649–658.
- Tang Z, Li C, Kang B, et al. GEPIA: a web server for cancer and normal gene expression profiling and interactive analyses. Nucleic Acids Res. 2017;45(W1):W98–W102.
- Tomczak K, Czerwińska P, Wiznerowicz M. The Cancer Genome Atlas (TCGA): an immeasurable source of knowledge. Contemp Oncol (Pozn). 2015;19(1A):A68–77.
- Yoshihara K, Shahmoradgoli M, Martínez E, et al. Inferring tumour purity and stromal and immune cell admixture from expression data. Nat Commun. 2013;4(1):2612.
- Gao J, Aksoy B, Dogrusoz U, et al. Integrative analysis of complex cancer genomics and clinical profiles using the cBioPortal. Sci Signal. 2013;6(269):1.
- Szklarczyk D, Gable A, Nastou K, et al. The STRING database in 2021: customizable protein-protein networks, and functional characterization of user-uploaded gene/measurement sets. Nucleic Acids Res. 2021;49(D1):D605–D12.
- Martens M, Ammar A, Riutta A, et al. WikiPathways: connecting communities. Nucleic Acids Res. 2021;49(D1):D613–d21.
- Zhang Y, Zhang Z. The history and advances in cancer immunotherapy: understanding the characteristics of tumor-infiltrating immune cells and their therapeutic implications. Cell Mol Immunol. 2020;17(8):807–821.
- Motzer R, Escudier B, McDermott D, et al. Nivolumab versus everolimus in advanced renal-cell carcinoma. N Engl J Med. 2015;373(19):1803–1813.
- Gan B. Mitochondrial regulation of ferroptosis. J Cell Biol. 2021;220(9):9.
- Du J, Zhou Y, Li Y, et al. Identification of Frataxin as a regulator of ferroptosis. Redox Biol. 2020;32:101483.
- Gao M, Yi J, Zhu J, et al. Role of mitochondria in ferroptosis. Mol Cell. 2019;73(2):354–63.e3.
- Hsieh J, Purdue M, Signoretti S, et al. Renal cell carcinoma. Nature Reviews. Disease Primers. 2017;3:17009.
- Batavia A, Schraml P, Moch H. Clear cell renal cell carcinoma with wild-type von Hippel-Lindau gene: a non-existent or new tumour entity? Histopathology. 2019;74(1):60–67.
- Zhang H, Zhu G. Predictive Biomarkers and Novel Targets in the Treatment of Metastatic Renal Cell Carcinoma. Curr Med Chem. 2021;28(25):5213–5227.
- Khanna P, Soh H, Chen C, et al. ACE2 abrogates tumor resistance to VEGFR inhibitors suggesting angiotensin-(1-7) as a therapy for clear cell renal cell carcinoma. Sci Transl Med. 2021;13(577):577.
- Weidle U, Nopora A. Cancer genom clear cell renal carcinoma: microRNAs with efficacy in preclinical in vivo models. ics & proteomics. 2021;18(3 Suppl):349–368
- Wettersten H, Aboud O, Lara P, et al. Metabolic reprogramming in clear cell renal cell carcinoma. Nat Rev Nephrol. 2017;13(7):410–419.
- Choueiri T, Kaelin W. Targeting the HIF2-VEGF axis in renal cell carcinoma. Nat Med. 2020;26(10):1519–1530.
- Gao S, Ruan H, Liu J, et al. A novel ferroptosis-related pathway for regulating immune checkpoints in clear cell renal cell carcinoma. Front Oncol. 2021;11:678694.
- Yang Z, Peng B, Pan Y, et al. Analysis and verification of N(6)-methyladenosine-modified genes as novel biomarkers for clear cell renal cell carcinoma. Bioengineered. 2021;12(2):9473–9483.
- Xiang Z, Shen E, Li M, et al. Potential prognostic biomarkers related to immunity in clear cell renal cell carcinoma using bioinformatic strategy. Bioengineered. 2021;12(1):1773–1790.
- Srigley J, Delahunt B, Eble J, et al. The International Society of Urological Pathology (ISUP) Vancouver classification of renal neoplasia. Am J Surg Pathol. 2013;37(10):1469–1489.
- Wang Y, Wang Y, Liu F. A 44-gene set constructed for predicting the prognosis of clear cell renal cell carcinoma. Int J Mol Med. 2018;42(6):3105–3114.
- Chen B, Jiao Z, Yin X, et al. Novel insights into biomarkers associated with renal cell carcinoma. Oncol Lett. 2018;16(1):83–90.
- Fang Z, Sun Q, Yang H, et al. SDHB suppresses the tumorigenesis and development of ccRCC by inhibiting glycolysis. Front Oncol. 2021;11:639408.
- Saxena N, Maio N, Crooks D, et al. SDHB-Deficient Cancers: the role of mutations that impair iron sulfur cluster delivery. J Natl Cancer Inst. 2016;108(1):1.
- Liu S, Xiao Z, Ai F, et al. Corrigendum to “miR-142-5p promotes development of colorectal cancer through targeting SDHB and facilitating generation of aerobic glycolysis” [Biomed. Pharmacother. 92 (2017) 1119-1127]. Biomed Pharmacothe. 2018;99:1033–1036.
- Hangauer M, Viswanathan V, Ryan M, et al. Drug-tolerant persister cancer cells are vulnerable to GPX4 inhibition. Nature. 2017;551(7679):247–250.
- Li Y, Xia J, Shao F, et al. Sorafenib induces mitochondrial dysfunction and exhibits synergistic effect with cysteine depletion by promoting HCC cells ferroptosis. Biochem Biophys Res Commun. 2021;534:877–884.
- Du J, Wang T, Li Y, et al. DHA inhibits proliferation and induces ferroptosis of leukemia cells through autophagy dependent degradation of ferritin. Free Radical Bio Med. 2019;131:356–369.
- Ren X, Li Y, Zhou Y, et al. Overcoming the compensatory elevation of NRF2 renders hepatocellular carcinoma cells more vulnerable to disulfiram/copper-induced ferroptosis. Redox Biol. 2021;46:102122 .
- Du J, Wang X, Li Y, et al. DHA exhibits synergistic therapeutic efficacy with cisplatin to induce ferroptosis in pancreatic ductal adenocarcinoma via modulation of iron metabolism. Cell Death Dis. 2021;12(7):705.
- Aggarwal R, Luchtel R, Machha V, et al. Functional succinate dehydrogenase deficiency is a common adverse feature of clear cell renal cancer. Proc Natl Acad Sci U S A. 2021;118(39):39.
- Kinch L, Grishin N, Brugarolas J. Succination of Keap1 and activation of Nrf2-dependent antioxidant pathways in FH-deficient papillary renal cell carcinoma type 2. Cancer Cell. 2011;20(4):418–420.