
ABSTRACT
The purpose of this study was to explore the potential molecular mechanisms of excess homocysteine in relation to autophagic activity in the ovarian tissue of polycystic ovarian syndrome (PCOS) with hyperandrogenism.A PCOS model was constructed using ICR mice. ELISA was used to detect the Hcy levels in the serum and ovarian tissues of PCOS model. The expression level of key enzymes (Methionine synthase and Betaine-homocysteine methyltransferase, MTR and BHMT) in homocysteine metabolism and autophagy-related proteins were detected in ovarian tissues and mouse granulosa cells (mGCs) that were treated with homocysteine, androgen, autophagy inhibitors or BHMT-expressing plasmid by western blot and immunohistochemistry. Electron microscope experiments were used to evaluate autophagosomes in Hcy-treated mGCs. The prenatally androgenized (PNA) PCOS mouse model showed hyperhomocysteinemia and hyperandrogenism. Homocysteine levels displayed a significant increase, while its metabolic enzymes levels were significantly decreased in ovarian tissues of PCOS mice and dihydrotestosterone (DHT)-stimulated mGCs. The LC3II and Beclin1 expression levels were increased and the P62 and p-mTOR levels were decreased in vivo in ovarian tissue from the PCOS mice. The in vitro data were similarly with the in vivo by stimulation of mGCs with DHT or homocysteine. These effects could be diminished by the autophagy inhibitor (MHY1485), androgen receptor antagonists (ARN509) or BHMT-expressing plasmid. Androgen increases homocysteine concentration by downregulating the key enzymes in homocysteine metabolism. And then Hcy promotes GCs autophagy via the mTOR signal pathway.
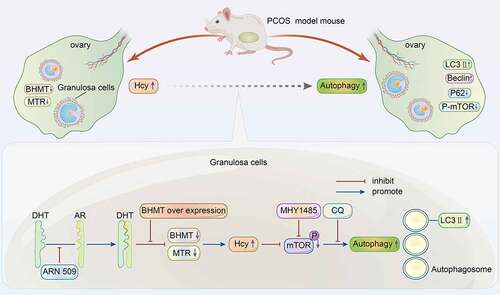
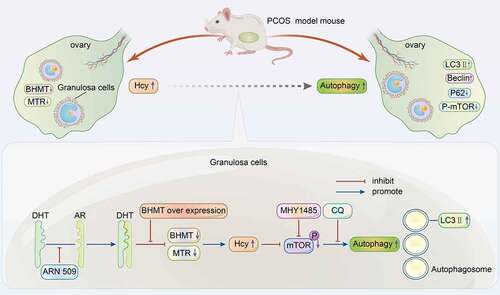
Graphical abstract
Highlights
A hyperandrogenic PCOS mouse model was established to explore the changes in Hcy and autophagy in ovarian tissues to elucidate the possible mechanism for the modulation of GC autophagy by Hcy.
HA induces an increase in the Hcy level in PCOS mice.
Androgen increases the Hcy concentration in mGCs, and then DHT and Hcy promote autophagy.
Introduction
Data from the National Institutes of Health indicate that 15–20% of women of reproductive age suffer from polycystic ovarian syndrome (PCOS), which is the main cause of reproductive and metabolic abnormalities [Citation1]. The primary pathological characteristics of PCOS include hyperandrogenism [Citation2].
Homocysteine (Hcy) occurs in high levels in the serum of patients with PCOS. Hcy is an essential amino acid and is important for the growth of cells. Under physiological conditions, Hcy is methylated by methionine synthase (MTR) and betaine-homocysteine methyltransferase (BHMT) to form methionine, and this process occurs predominantly in the liver [Citation3]. The cause and effect of hyperhomocysteinemia in PCOS patients still have not been fully elucidated. Clinical studies report that excessive androgen intake is highly correlated with increased Hcy concentrations [Citation4–6]. A previous study reported that patients suffering from hyperhomocysteinemia who underwent folic acid treatment did not exhibit a decrease in Hcy and its metabolic products in their cells [Citation7]. Hcy can be metabolized in two ways, the transsulfuration pathway, or the remethylation pathway. One is the methylation provided by the activation of Hcy and folic acid to synthesize methionine, and the activity of homocysteine metabolizing enzymes is normal. Supplementation of folic acid can reduce the concentration of Hcy [Citation3]. These findings indicate that the metabolic processes of Hcy are modulated by complex mechanisms.
Previous studies reported increased autophagy in the ovarian tissues of patients with PCOS [Citation8], but only a few studies have explored the factors leading to this increase. Autophagic imbalance is associated with the dysregulation of follicular granulosa cell (GC) death and atresia in PCOS. Light chain 3 (LC3), autophagy-specific substrate P62, and Beclin1 are widely used for monitoring the autophagy process. LC3 has two isoforms, the cytosolic form (LC3I) and the LC3-phosphatidylethanolamine conjugate (LC3II). The autophagosomal marker, LC3II, is used to determine autophagic activity [Citation9]. Beclin1 plays a role in the initiation of autophagy [Citation10]
Abnormal levels of Hcy modulate autophagy in multiple tissues [Citation11,Citation12]. However, studies have not fully explored whether Hcy activates or inhibits autophagy in ovarian tissue.
In the present study, a hyperandrogenic PCOS mouse model was established to explore the changes in Hcy and autophagy in ovarian tissues to elucidate the possible mechanism for the modulation of GC autophagy by Hcy. The findings of the study show that Hcy promotes autophagy in GCs by modulating the mammalian target of rapamycin (mTOR) signaling pathway in PCOS both in vitro and in vivo.
Materials and methods
Animals
This study was approved by the Nanjing Drum Tower Hospital Experimental Animals Welfare and Ethics Committee and followed the guidelines of the Experimental Animals Management Committee (Jiangsu Province, China). Three-week-old female ICR mice and eight-week-old ICR mice, including 12 females and 6 males, were purchased from the Animal Experimental Center of the Nanjing Medical University (China). The eight-week-old mice were bred for further experiments, and the three-week-old mice were used for the GC culture. The mice were housed in individual ventilated cages with a light/dark cycle of 12 h at 22 ± 2°C. The first day of the copulatory plug check was considered gestation. Pregnant mice at 16.5–18.5 days gestation were injected with 350 μg of DHT (20,649, MCE, China) that had been dissolved in 50 µl of sesame oil. The offspring were born, and the female offspring were fed for 8–9 weeks. The normal estrous cycle was divided into four stages [Citation13]: proestrus, estrus, metestrus, and diestrus. Vaginal smears were observed daily for 10 days when the PCOS and control mice reached seven weeks old. Mice that exhibited two consecutive normal four-day estrous cycles were used in the control group. The body weight and anogenital distance of the mice were measured, ovaries were collected, and blood was harvested. All animals were anesthetized with pentobarbital.
Intraperitoneal glucose tolerance test
Glucose tolerance was measured by intraperitoneal glucose tolerance test (IPGTT). The mice were fasted overnight and injected intraperitoneally with glucose at 1.5 g/kg. Blood samples were collected from the tail vein at 0, 30, 60,90, and 120 min after injection and tested for glucose. The plasma glucose of every animal was measured using the glucometer (YUWELL; Shanghai, China). The mean area under the receiver operating characteristic curve was estimated for glucose.
Hematoxylin and eosin staining and the quantification of follicles
The ovaries were cut into sections with a thickness of 5 μm, and every fifth section was stained with hematoxylin and eosin. The follicles containing an oocyte nucleus were counted. The primordial, primary, secondary, and antral follicles were described in a previous report [Citation14].The total number of follicles in each group was then multiplied by five.
Homocysteine measurements in serum, ovary homogenate, and cultured supernatants
Blood was collected from the posterior orbital venous plexus, refrigerated overnight at 4°C and centrifuged at 5000 rpm for 10 min at 4°C. Phosphate buffered saline(PBS,1 ml) was added to the ovarian tissue, and a tissue crusher was used for tissue homogenization. The homogenate was centrifuged at 5000 rpm for 5 min at 4°C. The supernatant samples were transferred to new separate tubes and stored at −80°C. The serum, ovary homogenate (assayed at a 1:50-fold dilution), and culture medium levels of Hcy were detected using an ELISA kit (Cusabio Technology LLC, Wuhan, China).
Immunohistochemistry
The expression of MTR, BHMT, LC3B, and P62 in the ovaries was detected using IHC. The sections were baked at 65°C in an oven, dehydrated with alcohol, incubated with 3% H2O2, boiled in 10 mM citrate buffer (pH 6.0) for antigen retrieval, rinsed in Tris-buffered saline (TBS) three times, added to solution A (for biotin block), and washed three more times in TBS. Sections were incubated in goat serum for 1 h at room temperature, and were then incubated separately with anti-MTR (1:200, ab66039, Abcam, UK), anti-BHMT (1:200, ab243698, Abcam, UK), anti-LC3B (1:300, ab48394, Abcam, UK), and anti-P62 (1:200, F032602, Abways Technology) overnight at 4°C. Samples were then washed in PBS. Sections were incubated with a goat anti-rabbit secondary antibody at 37°C for 30 min, and the sections were then stained with 3,3'-diaminobenzidine and counterstained with hematoxylin at room temperature. The negative control sections were incubated in biotinylated goat antirabbit immunoglobulin G (1:200 dilution) and stained with the experimental sections. Densitometric quantification was performed using ImageJ software.
Primary granulosa cell culture
The three-week-old mice were used for the GC culture. Ovaries were cultured in Dulbecco’s Modified Eagle Medium/Nutrient Mixture F-12 (Gibco BRL Life Technologies, Invitrogen, USA) supplemented with 10% fetal bovine serum (HyClone laboratories, USA), 1 mM sodium pyruvate, 2 mM glutamine, 100 IU/ml penicillin, and 100 μg/ml streptomycin from three-week-old ICR mice following a method described previously [Citation15]. Syringe needles (1 mL) were used to puncture the ovaries, and the oocytes were then filtered using a 40 μm cell strainer. GCs were incubated at 37°C in 5% CO2. In some groups mGCs were cultured in a medium containing Hcy (Sigma, USA), DHT (20,649, MCE, China), CQ (Sigma, USA), mTOR activator (MHY1485), apalutamide (ARN509), or BHMT plasmid for 24 or 48 h.
Western blot analysis
Lysates from ovarian tissue and mGCs were separated by sodium dodecyl sulfate–polyacrylamide gel electrophoresis and transferred to polyvinylidene difluoride membranes. The membranes were incubated with MTR antibody (1:2000, ab66039, Abcam, UK), BHMT antibody (1:200, ab243698, Abcam, UK), LC3B antibody (1:1000, ab48394, Abcam, UK), P62 antibody (1:1000, F032602, Abways Technology), Beclin-1 antibody (D40C5, 1:500, 3495s, Cell Signaling Technology, Inc.), mTOR (s2442) antibody (1:1000, BS3611, bioWORLD), and p-mTOR antibody (1:1000, BS4706, bioWORLD). In addition, samples were incubated with peroxidase-conjugated secondary antibody, and an enhanced chemiluminescence detection kit (Amersham Pharmacia Biosciences, Inc.) was used for visualization. Protein levels were quantified and normalized using glyceraldehyde 3-phosphate dehydrogenase (1:10,000, AB0037, Abways Technology) as internal control.
Transmission electron microscopy
After being fixed, dehydrated, and embedded according to standard procedures, cells were observed under an HT7700 electron microscope (Hitachi, Ltd., Chiyoda, Japan).
Statistical analysis
Each experiment was repeated at least three times. Statistical analysis was carried out using GraphPad Prism 8, and values are expressed as mean ± standard deviation (SD). Student’s t-tests were used for comparisons between two groups, and one-way analysis of variance followed by Dunnett’s multiple comparison tests were used for comparisons between more than two groups. Statistical significance was defined as p < 0.05.
Results
High concentration of homocysteine is observed in the serum and ovarian tissue of polycystic ovary syndrome mice
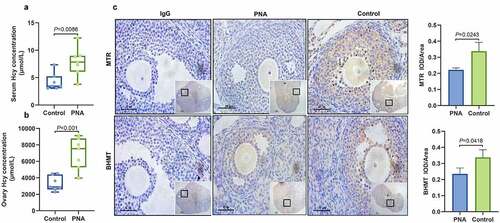
Several animal models have been used to study PCOS [Citation16,Citation17]. A prenatally androgenized PCOS mouse model was established in the current study. Analysis showed that the PCOS model exhibited hyperandrogenism, implying that the model was constructed successfully (see Supplemental Data 1). To explore the level of Hcy in PCOS mice with hyperandrogenism, Hcy levels were determined in the serum and ovarian tissues using enzyme-linked immunosorbent assay (ELISA). When comparing the PCOS mice with the control group, the Hcy levels in the serum (7.86 ± 0.99 and. 4.24 ± 0.59 μmol/L, respectively) and ovarian tissue (6980 ± 722.4 vs. 3300 ± 341.4 μmol/L, respectively) were significantly higher in the PCOS group than in the control group (see –b). To further explore the role of MTR and BHMT in Hcy metabolism in PCOS mice, immunohistochemistry (IHC) was performed, and the findings showed that MTR and BHMT were highly expressed in GCs, but theca cells or stroma showed low expression levels. In addition, MTR and BHMT were mainly localized in the cytoplasm and only low levels were observed in the nucleus. The expression levels of MTR and BHMT were lower in the PCOS mice than in the control group (see ). These findings indicate that increased Hcy levels may be associated with hyperandrogenism.
Figure 1. Increased homocysteine levels and decreased methionine synthase and betaine-homocysteine methyltransferase in ovarian tissues were detected in polycystic ovary syndrome mice. (a and b) Levels of homocysteine in the serum (a) and ovarian tissues (b) of polycystic ovary syndrome mice as determined by enzyme-linked immunosorbent assay. (c) Expression levels of methionine synthase and betaine-homocysteine methyltransferase in the ovarian tissues of polycystic ovary syndrome mice as determined by immunohistochemical analysis. Low magnification scale bar = 200 µm and high magnification scale bar = 50 µm. Data are presented as mean ± SD.
Ovarian tissue of polycystic ovary syndrome mice exhibits high autophagic activity
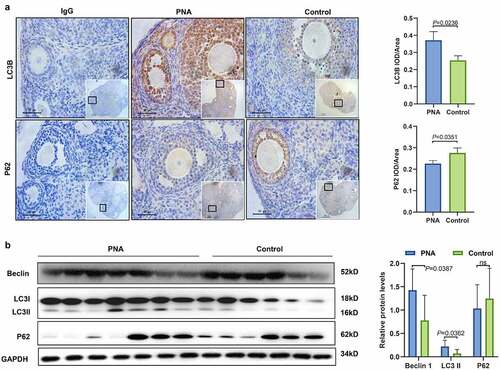
Previous studies have shown that Hcy is implicated in the regulation of autophagy [Citation18–21]. The expression levels of autophagy-related markers were determined to explore the level of autophagy in the ovarian tissues of PCOS mice. IHC results showed that LC3B and P62 were mainly expressed in GCs in the ovarian tissues (see ). The findings showed an upregulation in the expression of LC3II and Beclin1 and a downregulation of the autophagy substrate P62 in the ovarian tissue of the PCOS mice (see ). These findings indicate that high levels of Hcy may activate autophagy in the ovarian tissues of PCOS mice.
Figure 2. Autophagy level in the ovarian tissues of polycystic ovary syndrome mice. (a) Expression level of light chain 3 and P62 in ovarian tissues of polycystic ovary syndrome mice as determined by immunohistochemical analysis. Low magnification scale bar = 200 µm, high magnification scale bar = 50 µm, and ns = no statistical significance. (b) Expression levels of Beclin 1, light chain 3-II, and P62 proteins in the ovarian tissues of polycystic ovary syndrome mice and control mice as determined by western blot analysis. Data are presented as mean ± SD.
High levels of homocysteine promote the activation of autophagy in mouse granulosa cells
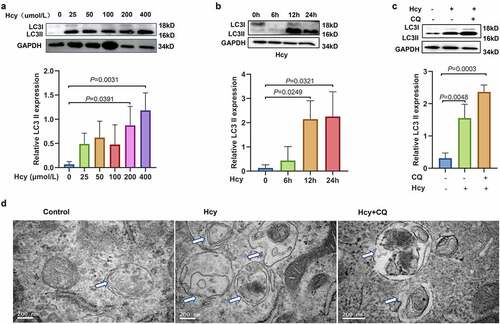
The analysis showed a high concentration of Hcy in the ovarian tissue of PCOS mice and a downregulation the key enzymes, MTR and BHMT, in the GCs. To further explore whether increased levels of Hcy modulate autophagic activity in mouse granulosa cells (mGCs), mGCs were treated with different concentrations of Hcy (0, 25, 50, 100, and 200 µmol/L) for 24 h. Treatment with 200 and 400 µmol/L of Hcy significantly increased the levels of LC3II (see ). mGCs were then treated with 200 µmol/L Hcy for various durations (0, 6, 12, and 24 h). The findings showed that the expression of LC3II was significantly upregulated in mGCs treated with 200 µmol/L Hcy for 12 and 24 h (see ). Therefore, this dose was selected for subsequent experiments. To further explore the level of autophagy after treatment with Hcy, mGCs were treated with different concentrations (0, 25, 50, or 100 µmol/L) of the autophagy inhibitor chloroquine (CQ) for 2 h. The analysis showed that the expression of LC3II was significantly increased in mGCs after treatment with 100 µmol/L of CQ for 2 h (see Supplemental Data 2A). Therefore, this concentration was utilized for further assays. CQ inhibits the fusion process of autophagosomes and lysosomes, thus autophagy cannot be completed, resulting in the accumulation of LC3II. After treatment with CQ for 2 h, the cells were cultured with CQ and Hcy for another 24 h. The results showed that the level of LC3II in mGCs treated with CQ and Hcy was higher than in those treated with CQ alone. This further suggests that Hcy still initiates autophagy when the fusion process of autophagosomes and lysosomes is inhibited (see ). Transmission electron microscopy showed that the number of autophagosomes increased significantly after treatment with Hcy in mGCs (see ). These findings indicate that Hcy induces autophagy in mGCs.
Figure 3. Homocysteine promotes the activation of autophagy in mouse granulosa cells. (a) Protein expression levels of light chain 3-II in mouse granulosa cells treated with different concentrations of homocysteine (0, 25, 50, 100, and 200 µmol/L) for 24 h, as determined by western blot analysis. (b) Protein expression level of light chain 3-II in mouse granulosa cells treated with 200 µmol/L homocysteine for 0, 6, 12, and 24 h, as determined by western blot analysis. (c) Protein expression level of light chain 3-II in mouse granulosa cells treated with 200 µmol/L homocysteine and/or 100 µmol/L chloroquine, as determined by western blot analysis. (d) Representative images of autophagosomes in mouse granulosa cells treated with 200 µmol/L homocysteine and/or 100 µmol/L chloroquine, as detected by transmission electron microscopy. Scale bar = 200 nm. Data are presented as mean ± SD, and experiments were repeated at least three times.
Homocysteine induces autophagy by inhibiting the mammalian target of rapamycin signaling pathway in mouse granulosa cells
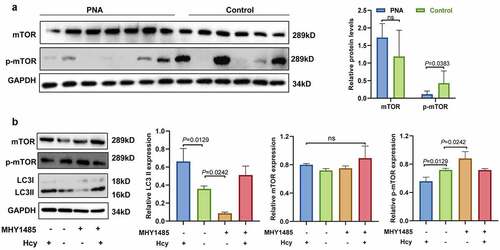
mTOR could participated in the induction, processing, and termination of autophagy [Citation22]. The expression levels of phosphorylated-mTOR (p-mTOR) and mTOR in the ovarian tissues of the PCOS mice and the control group were evaluated to explore whether the mTOR signaling pathway is involved in autophagy. When compared with the control group, p-mTOR expression was significantly lower in the ovaries of the PCOS mice (see ). However, the analysis showed no significant difference in mTOR expression between the PCOS mice and the control group. In vitro cell experiments were performed to further verify the findings. mGCs were treated with mTOR activator MHY1485 (0, 5, 10, or 20 µmol/L; see Supplemental Data 3A) and/or 200 µmol/L of Hcy (see ). MHY1485 is an mTOR activator that inhibits the fusion of autophagosomes and lysosomes by upregulating the expression of p-mTOR. However, it does not change the total mTOR levels [Citation23]. The findings showed that Hcy did not affect mTOR expression, but it significantly inhibited p-mTOR expression in Hcy-treated mGCs when compared with the control group (see ). The analysis showed that the high LC3II expression in the mGCs was abrogated after cotreatment with 200 µmol/L of Hcy and 10 µmol/L of MHY1485. These findings further indicate that Hcy partly induces autophagy by inhibiting the mTOR signaling pathway in mGCs.
Figure 4. Homocysteine induces autophagy by inhibiting the mammalian target of rapamycin signaling pathway in mouse granulosa cells. (a) Protein expression level of mammalian target of rapamycin and phosphorylated mammalian target of rapamycin in the ovarian tissues of polycystic ovary syndrome mice and controls. (b) Representative western blot results showing protein expression levels of mammalian target of rapamycin, phosphorylated mammalian target of rapamycin, and light chain 3-II in mouse granulosa cells treated with 200 µmol/L of homocysteine and/or 10 µmol/L MHY1485 for 24 h (ns = not significant). The quantitative puncta analysis is presented on the right panel. The data are presented as mean ± SD, and experiments were repeated at least three times.
Dihydrotestosterone activated autophagy in mouse granulosa cells and downregulated methionine synthase and betaine-homocysteine methyltransferase
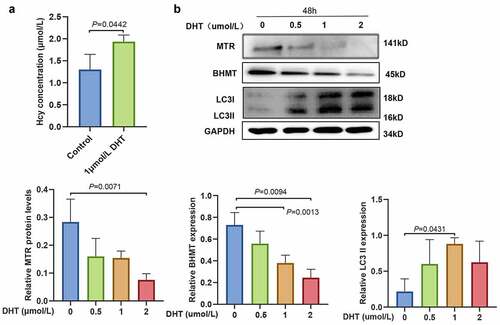
Hyperandrogenemia (HA) is the main characteristic of PCOS mice and can affect other metabolic processes. mGCs were treated with different concentrations of DHT (0, 0.5, 1, and 2 µmol/L) for 24 or 48 h to further explore the relationship between HA and increased Hcy levels. The analysis showed no significant differences in LC3II expression between mGCs treated with DHT for 24 h and untreated cells (see Supplemental Data 4A). ELISA results showed that the treatment of mGCs with 1 µmol/L of DHT for 48 h significantly increased Hcy levels (see ). The analysis showed that the expression of LC3II was significantly upregulated in mGCs treated with 1 μmol/L of DHT for 48 h (see ). Therefore, this concentration was used for further experiments. In addition, the expression of MTR and BHMT was significantly downregulated in a concentration-dependent manner, as indicated by the western blot analysis (see ).
Figure 5. Androgen inactivates the homocysteine metabolizing enzymes (methionine synthase and betaine-homocysteine methyltransferase) and increases homocysteine levels in mouse granulosa cells. (a) Homocysteine levels in mouse granulosa cells treated with 1 µmol/L dihydrotestosterone as determined by enzyme-linked immunosorbent assay. (b) The expression level of methionine synthase, betaine-homocysteine methyltransferase, and light chain 3-II proteins in mouse granulosa cells treated with different concentrations of dihydrotestosterone (0, 0.5, 1, and 2 µmol/L) for 48 h, as determined by western blot analysis. The quantitative puncta analysis is presented on the lower panel, data are expressed as mean ± SD, and experiments were repeated at least three times.
Blockage of androgen may reverse dihydrotestosterone-induced homocysteine and autophagic changes in mouse granulosa cells
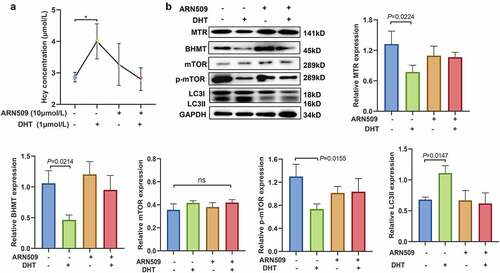
For further analysis, 10 µmol/L of the androgen receptor inhibitor ARN509 was used to block androgens in mGCs. ELISA results showed that ARN509 reversed the significant increase in Hcy levels in mGCs caused by DHT (see ). Notably, the level of expression of MTR and BHMT in mGCs was not affected after treatment with ARN509 and DHT (see ). In addition, no significant differences were observed in mTOR expression in mGCs treated with DHT or ARN509 (see ). DHT significantly upregulated LC3II and downregulated p-mTOR in mGCs (see ). The expression levels of p-mTOR and LC3II were not significantly altered after mGCs were treated with DHT and ARN509. These finding show that blocking androgen reverses DHT-induced Hcy and autophagic changes in mGCs.
Figure 6. The inhibition of androgen reverses dihydrotestosterone-induced homocysteine and autophagy changes in mouse granulosa cells. (a) Homocysteine levels in mouse granulosa cells treated with 10 µmol/L ARN509 and/or 1 µmol/L dihydrotestosterone, as determined by enzyme-linked immunosorbent assay (*: <0.05). (b) The expression levels of methionine synthase, betaine-homocysteine methyltransferase, mammalian target of rapamycin, phosphorylated mammalian target of rapamycin, and light chain 3-II in mouse granulosa cells treated with 10 µmol/L of ARN509 and/or 1 µmol/L of dihydrotestosterone, as determined by western blot analysis (ns = not significant). The quantitative puncta analysis is presented on the right and lower panels, data are expressed as mean ± SD, and experiments were repeated at least three times.
Betaine-homocysteine methyltransferase overexpression reverses the dihydrotestosterone-induced increase in homocysteine and the activation of autophagy
mGCs were transfected with plasmids overexpressing BHMT to explore the effect of androgen on BHMT. The level of Hcy in the culture medium was not detectable (see ). Western blot analysis showed that BHMT expression was upregulated in mGCs (see ). Treatment of mGCs with DHT and transfection with BHMT plasmid resulted in no significant differences in the mTOR, p-mTOR, or LC3II levels (see ). The findings observed for BHMT-overexpressing cells were not consistent with the findings on the effects of DHT. These findings further indicated that androgens downregulate the expression of Hcy-metabolizing enzymes and increase Hcy levels in mGCs. DHT and Hcy promote autophagy in mGCs by modulating the mTOR signal pathway (see ).
Figure 7. Betaine-homocysteine methyltransferase overexpression reverses dihydrotestosterone-induced homocysteine increase and autophagy activation. (a) Levels of homocysteine in mouse granulosa cells transfected with betaine-homocysteine methyltransferase overexpression plasmid and/or 1 µmol/L dihydrotestosterone, as determined by enzyme-linked immunosorbent assay. (b) Expression level of betaine-homocysteine methyltransferase, mammalian target of rapamycin, phosphorylated mammalian target of rapamycin, and light chain 3-II in mouse granulosa cells transfected with betaine-homocysteine methyltransferase overexpression plasmid and/or 1 µmol/L dihydrotestosterone, as determined by western blot analysis. Quantitative puncta analysis is presented on the right and lower panel, data are presented as mean ± SD, and experiments were repeated at least three times.
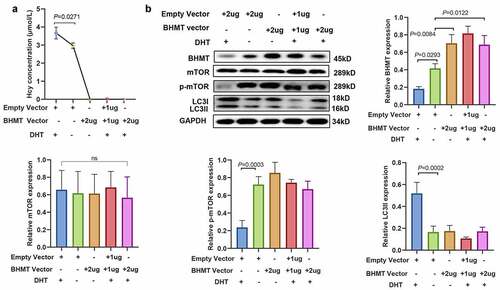
Figure 8. Summary diagram showing that androgen increases homocysteine concentration by downregulating key enzymes in homocysteine metabolism. Dihydrotestosterone and homocysteine promote autophagy in granulosa cells by modulating the mammalian target of rapamycin signaling pathway.
Discussion
The findings of the current study showed that increased levels of Hcy in ovarian tissues activated autophagy partly through the inhibition of the mTOR signaling pathway in PCOS mice and treated mGCs. High Hcy concentrations can be attributed to decreased expression levels of BHMT and MTR in mGCs. The findings relating to the Hcy-induced modulation of autophagy in mGCs provides a new experimental basis for factors affecting ovulation in PCOS.
In the mice, the concentration of Hcy was several hundred times higher in the ovarian tissues than in the serum. Significant differences in Hcy concentration were observed between PCOS mice and the control group.These findings indicate that disorders in Hcy metabolism in GCs may be more severe than in serum. Our previous study reported that the expression levels of BHMT and MTR were decreased in the ovarian tissue of PCOS mice and the GCs of patients with PCOS [Citation24]. In the current study, the relationship between androgen and changes in Hcy concentration in mGCs was explored. The findings showed that androgen increased Hcy concentrations by downregulating MTR and BHMT in mGCs in vitro. In vivo, high Hcy concentrations were correlated with high androgen levels in the ovarian GCs of patients with PCOS [Citation25]. In addition, a disturbance in the Hcy metabolism in the GCs leads to increased Hcy concentration in the follicular fluid [Citation26]. Follicular fluid originates both from the trans-exudate molecules of the blood and secretions from ovarian follicular cells [Citation27].
A clinical correlation analysis indicated that excessive androgen is correlated with Hcy metabolism. The long-term (> 20 y) intake of excess synthesized androgen in males results in increased serum Hcy concentration, decreased sex hormone binding globulin, and an increased risk of thromboembolism [Citation6], which is supported by findings obtained from experiments using Wistar mice. A six-week treatment with synthesized androgen (Nandrolone) caused an increase in the Hcy concentration and lipid peroxidation in the cardiac tissues [Citation28]. These findings indicate that androgen significantly affects Hcy metabolism.
Autophagy is essential for maintaining the balance between cellular homeostasis and survival [Citation29]. In physiological conditions, autophagy serves various functions, including equilibrating ovulation and follicular atresia, which is involved in follicular development. Abnormal activation of autophagy in the ovaries leads to follicular atresia and premature ovarian failure [Citation30]. The findings of the current study showed that autophagy was activated in the ovarian tissues of PCOS mice and DHT-treated mGCs. Androgen-induced autophagy has previously been detected in the skeletal muscles of a PCOS mouse model [Citation31] and in GCs derived from in-vitro fertilization (IVF) in patients with PCOS [Citation11]. However, there are differences between the cells used in the current study and those used previously. The primary cultures of mGCs were stimulated in the study, which is different from the human GCs derived from IVF used in the previous study. mGCs can be used to further explore the biomolecular mechanisms of autophagy.
The findings show that Hcy mediates androgen-induced autophagy. Hcy modulates autophagy in various cells [Citation11,Citation12,Citation32]. Hyperhomocysteinemia induces cellular oxidative stress and protein aggregation and dysfunction, promotes inflammation, and impairs autophagy [Citation5,Citation33]. Excess Hcy promotes the upregulation of the fission marker DRP-1, leading to mitochondrial remodeling. The dysregulation leads to the increased activation of autophagy and cell toxicity in mouse brain endothelial cells [Citation32]. The findings of the current study show that Hcy promotes autophagosome accumulation in mGCs and decreases the degradation of cellular components, as shown by transmission electron microscopy analysis. These changes may lead to a disturbance in the functioning of GCs. Follicular growth and atresia are highly correlated with the status of GCs [Citation34]. An increase in GC autophagy may lead to follicular atresia during the process of folliculogenesis [Citation35]. Hcy induces the downregulation of the expression of the hairy and enhancer of split-1 and P62 in the cortical neurons of mice [Citation36] and accumulation of LC3 and P62 in the astrocyte cells of humans and mice [Citation37]. Hcy-induced autophagy in GCs may induce the ovulatory disturbances observed in PCOS. In addition, the changes observed can contribute to the poor quality of embryos and high miscarriage rate [Citation38,Citation39], which may be caused by Hcy-induced impaired autophagic flux.
Autophagy is a complicated process and mTOR is one of its most important regulators. mTOR represses nuclear translocation of the transcription factor EB through phosphorylation, thus promoting the formation of lysosomes [Citation40]. In addition, mTOR promotes anabolism and cellular growth. Starvation or other extreme stimulation represses the synthesis of mTOR and related proteins and activates autophagy to preserve energy [Citation41]. The analysis in the current study shows that p-mTOR expression was significantly lower in the ovaries of PCOS mice when compared with the control group. In addition, differences in p-mTOR expression between individual mice were relatively large. Notably, some mice did not exhibit the expression of p-mTOR, probably because phosphorylation is a dynamic process [Citation42], and it was challenging to determine an optimal time for the analysis of the chronic PCOS model. Therefore, p-mTOR expression was determined in mGCs treated with DHT or Hcy in vitro, and the results were consistent with the in vivo results. Autophagy was activated and p-mTOR was downregulated in Hcy- and DHT-treated mGCs in vitro. A decrease in mTOR signaling may play a negative role in follicular growth, which can lead to follicular atresia and the inhibition of meiosis in oocytes [Citation43].
Currently, several different treatment interventions exist for ovulation disorders. Therapy to lower Hcy and androgen levels can help to reverse ovulation disorders. However, the efficacy of therapies targeting autophagy in GCs should be explored further. Systemic BHMT-expressing plasmid can be considered as a novel therapy for hyperhomocysteinemia.
However, the mechanism of the Hcy-induced disturbance of autophagy is complex and future studies should explore this mechanism in GCs. The findings of the current study show that an increase in Hcy modulated androgen-activated autophagy by suppressing the mTOR pathway in the GCs of PCOS mice.
Conclusion
The findings indicate that HA induces an increase in the Hcy level in PCOS mice. High Hcy levels modulate androgen-induced autophagy by suppressing the mTOR signaling pathway. These findings imply that the Hcy-induced modulation of autophagy may cause follicular stasis and ovulation disorders in PCOS.
Supplemental Material
Download Zip (5 MB)Disclosure statement
No potential conflict of interest was reported by the author(s).
Supplementary material
Supplemental data for this article can be accessed here
Additional information
Funding
Related Research Data
References
- Stener-Victorin E, Padmanabhan V, Walters KA, et al. Animal models to understand the etiology and pathophysiology of polycystic ovary syndrome. Endocr Rev. 2020;41(4). DOI:10.1210/endrev/bnaa010.
- Teede HJ, Misso ML, Costello MF, et al. Recommendations from the international evidence-based guideline for the assessment and management of polycystic ovary syndrome. Fertil Steril. 2018;110(3):364–379.
- Li D, Liu H-X, Fang -Y-Y, et al. Hyperhomocysteinemia in polycystic ovary syndrome: decreased betaine-homocysteine methyltransferase and cystathionine β-synthase-mediated homocysteine metabolism. Reprod Biomed Online. 2018;37(2):234–241.
- Yesilova Z, Ozata M, Oktenli C, et al. Effect of supraphysiologic doses of testosterone on fasting plasma total homocysteine concentrations in men with Klinefelter’s syndrome. Fertil Steril. 2004;81(5):1278–1282.
- Prudova A, Albin M, Bauman Z, et al. Testosterone regulation of homocysteine metabolism modulates redox status in human prostate cancer cells. Antioxid Redox Signal. 2007;9(11):1875–1881.
- Graham MR, Grace FM, FMBoobier , W Hullin , D Kicman , A, Cowan D, et al. Homocysteine induced cardiovascular events: a consequence of long term anabolic-androgenic steroid (AAS) abuse. Br J Sports Med. 2006;40(7):644–648.
- Hannibal L, Blom HJ. Homocysteine and disease: causal associations or epiphenomenons? Mol Aspects Med. 2017;53:36–42.
- Li D, You Y, Bi -F-F, et al. Autophagy is activated in the ovarian tissue of polycystic ovary syndrome. Reproduction. 2018;155(1):85–92.
- Runwal G, Stamatakou E, Siddiqi FH, et al. LC3-positive structures are prominent in autophagy-deficient cells. Sci Rep. 2019;9(1):10147.
- Hill SM, Wrobel L, Rubinsztein DC. Post-translational modifications of beclin 1 provide multiple strategies for autophagy regulation. Cell Death Differ. 2019;26(4):617–629.
- Li X, Qi J, Zhu Q, et al. The role of androgen in autophagy of granulosa cells from PCOS. Gynecol Endocrinol. 2019;35(8):669–672.
- Bossenmeyer-Pourié C, Pourié G, Koziel V, et al. Early methyl donor deficiency produces severe gastritis in mothers and offspring through N -homocysteinylation of cytoskeleton proteins, cellular stress, and inflammation. Faseb J. 2013;27(6):2185–2197.
- Cora MC, Kooistra L, Travlos G. Vaginal cytology of the laboratory rat and mouse: review and criteria for the staging of the estrous cycle using stained vaginal smears. Toxicol Pathol. 2015;43(6):776–793.
- Myers M, Britt KL, Wreford NGM, et al. Methods for quantifying follicular numbers within the mouse ovary. Reproduction. 2004;127(5):569–580.
- Zhang Q, Sun H, Jiang Y, et al. MicroRNA-181a suppresses mouse granulosa cell proliferation by targeting activin receptor IIA. PLoS One. 2013;8(3):e59667.
- Ryu Y, Kim SW, Kim YY, et al. Animal models for human polycystic ovary syndrome (pcos) focused on the use of indirect hormonal perturbations: a review of the literature. Int J Mol Sci. 2019;20(11):2720.
- Ryu Y, Kim Y, Kim Y, et al. Consecutive low doses of streptozotocin induce polycystic ovary syndrome features in mice. Int J Mol Sci. 2021;22(3):1299.
- Zinellu A, Sotgia S, Pisanu E, et al. LDL S-homocysteinylation decrease in chronic kidney disease patients undergone lipid lowering therapy. Eur J Pharm Sci. 2012;47(1):117–123.
- Vacek TP, Vacek JC, Tyagi N, et al. Autophagy and heart failure: a possible role for homocysteine. Cell Biochem Biophys. 2012;62(1):1–11.
- Yang A, Jiao Y, Yang S, et al. Homocysteine activates autophagy by inhibition of CFTR expression via interaction between DNA methylation and H3K27me3 in mouse liver. Cell Death Dis. 2018;9(2):169.
- Zhao Y, Huang G, Chen S, et al. Homocysteine aggravates cortical neural cell injury through neuronal autophagy overactivation following rat cerebral ischemia-reperfusion. Int J Mol Sci. 2016;17(8):1196.
- Kim YC, Guan, K.l K-L. Guan, mTOR: a pharmacologic target for autophagy regulation. J Clin Invest. 2015;125(1):25–32.
- Rakhmanova V, Jin M, Shin J. Inhibition of mast cell function and proliferation by mTOR activator MHY1485. Immune Netw. 2018;18(3):e18.
- Lei L, Ding L, Su J, et al. Attenuated expression of MTR in both prenatally androgenized mice and women with the hyperandrogenic phenotype of PCOS. PLoS One. 2017;12(12):e0187427.
- Hayes MG, Urbanek M, Ehrmann DA, et al. Genome-wide association of polycystic ovary syndrome implicates alterations in gonadotropin secretion in European ancestry populations. Nat Commun. 2015;6(1):7502.
- Jia L, Li J, He B, et al. Abnormally activated one-carbon metabolic pathway is associated with mtDNA hypermethylation and mitochondrial malfunction in the oocytes of polycystic gilt ovaries. Sci Rep. 2016;6(1):19436.
- Fortune JE. Ovarian follicular growth and development in mammals. Biol Reprod. 1994;50(2):225–232.
- Tofighi A, Shirpoor M, Ansari MHK, et al. The effect of nandrolone treatment with and without enforced swimming on histological and biochemical changes in the heart and coronary artery of male rats. Anatol J Cardiol. 2017;17(3):176–183.
- Levine B, Kroemer G. Biological functions of autophagy genes: a disease perspective. Cell. 2019;176(1–2):11–42.
- Yadav AK, Yadav PK, Chaudhary GR, et al. Autophagy in hypoxic ovary. Cell Mol Life Sci. 2019;76(17):3311–3322.
- Song X, Shen Q, Fan L, et al. Dehydroepiandrosterone-induced activation of mTORC1 and inhibition of autophagy contribute to skeletal muscle insulin resistance in a mouse model of polycystic ovary syndrome. Oncotarget. 2018;9(15):11905–11921.
- Vacek JC, Behera J, George AK, et al. Tetrahydrocurcumin ameliorates homocysteine-mediated mitochondrial remodeling in brain endothelial cells. J Cell Physiol. 2018;233(4):3080–3092.
- He C, Klionsky DJ. Regulation mechanisms and signaling pathways of autophagy. Annu Rev Genet. 2009;43:67–93.
- Tatone C, Amicarelli F. The aging ovary–the poor granulosa cells. Fertil Steril. 2013;99(1):12–17.
- Zhou J, Peng X, Mei S. Autophagy in ovarian follicular development and atresia. Int J Biol Sci. 2019;15(4):726–737.
- Zhang JW, Yan R, Tang Y-S, et al. Hyperhomocysteinemia-induced autophagy and apoptosis with downregulation of hairy enhancer of split 1/5 in cortical neurons in mice. Int J Immunopathol Pharmacol. 2017;30(4):371–382.
- Tripathi M, Zhang CW, Singh BK, et al. Hyperhomocysteinemia causes ER stress and impaired autophagy that is reversed by vitamin B supplementation. Cell Death Dis. 2016;7(12):e2513.
- Forges T, Monnier-Barbarino P, Alberto JM, et al. Impact of folate and homocysteine metabolism on human reproductive health. Hum Reprod Update. 2007;13(3):225–238.
- Berker B, Kaya C, Aytac R, et al. Homocysteine concentrations in follicular fluid are associated with poor oocyte and embryo qualities in polycystic ovary syndrome patients undergoing assisted reproduction. Hum Reprod. 2009;24(9):2293–2302.
- Roczniak-Ferguson A, Petit CS, Froehlich F, et al. The transcription factor TFEB links mTORC1 signaling to transcriptional control of lysosome homeostasis. Sci Signal. 2012;5(228):ra42.
- Schmeisser K, Parker JA. Pleiotropic effects of mTOR and autophagy during development and aging. Front Cell Dev Biol. 2019;7:192.
- Wang T, Zhang J, Li P, et al. NT-4 attenuates neuroinflammation via TrkB/PI3K/FoxO1 pathway after germinal matrix hemorrhage in neonatal rats. J Neuroinflammation. 2020;17(1):158.
- Guo Z, Yu Q. Role of mTOR signaling in female reproduction. Front Endocrinol (Lausanne). 2019;10:692.