
 ?Mathematical formulae have been encoded as MathML and are displayed in this HTML version using MathJax in order to improve their display. Uncheck the box to turn MathJax off. This feature requires Javascript. Click on a formula to zoom.
ABSTRACT
Antibody–drug conjugates (ADCs) can improve therapeutic indices compared to plain monoclonal antibodies (mAbs). However, ADC synthesis is complex because the components are produced separately in CHO cells (mAb) and often by chemical synthesis (drug). They are individually purified, coupled, and then the ADC is purified, increasing production costs compared to regular mAbs. In contrast, it is easier to produce recombinant fusion proteins consisting of an antibody derivative, linker and proteinaceous toxin, i.e. a recombinant immunotoxin (RIT). Plants are capable of the post-translational modifications needed for functional antibodies and can also express active protein toxins such as the recombinant mistletoe lectin viscumin, which is not possible in prokaryotes and mammalian cells respectively. Here, we used Nicotiana benthamiana and N. tabacum plants as well as tobacco BY-2 cell-based plant cell packs (PCPs) to produce effective RITs targeting CD64 as required for the treatment of myelomonocytic leukemia. We compared RITs with different subcellular targeting signals, linkers, and proteinaceous toxins. The accumulation of selected candidates was improved to ~ 40 mg kg−1 wet biomass using a design of experiments approach, and corresponding proteins were isolated with a purity of ~ 80% using an optimized affinity chromatography method with an overall yield of ~ 84%. One anti-CD64 targeted viscumin-based drug candidate was characterized in terms of storage stability and cytotoxicity test in vitro using human myelomonocytic leukemia cell lines. We identified bottlenecks in the plant-based expression platform that require further improvement and assessed critical process parameters that should be considered during process development for plant-made RITs.
Highlights
Toxin type and domain sequence affect accumulation of recombinant immunotoxins.
Transient expression in plant cell packs and intact plants correlates well.
IC50 values of toxicity correlate with the cell surface receptor concentration
Introduction
Acute and chronic myelomonocytic leukemia (AML M4/5 and CMML) are heterogeneous neoplasms characterized by the aberrant growth of myeloid precursor cells in the bone marrow and peripheral blood [Citation1]. The median age of patients diagnosed with CMML is ~70 years with a survival period of only ~2 years, so standard therapeutic interventions such as chemotherapy or bone marrow transplants are risky for elderly patients [Citation2,Citation3]. Moreover, there are no effective immunotherapeutic (antibody-based) treatments available for CMML/AML M4/5 [Citation3] that would increase therapeutic specificity and reduce toxic side effects compared to conventional chemotherapy [Citation4]. However, CD64 is a promising surface antigen target for antibody-based drugs because it is abundantly expressed by differentiated monocytoid AML subtypes [Citation5] but usually not by normal hematopoietic stem cells [Citation6,Citation7]. For example, CD64-targeting drugs killed CD64+ AML-derived tumor cell lines as well as patient-derived primary AML cells selectively, providing the basis for a novel therapeutic strategy for the treatment of leukemia [Citation8,Citation9]. Similarly, the cell-surface Fc receptor CD89 is also a potential immunotherapeutic target displayed on malignant monocytic cells [Citation10,Citation11].
The relevance of immunotherapeutics is underlined by the market volume of €110 billion in 2017 for antibodies alone with > 130 approved products in total [Citation12] and > 20 new products within the last 6 years [Citation13]. In this context, antibody – drug conjugates (ADCs) and recombinant immunotoxins (RITs) combine the target selectivity of monoclonal antibodies (mAbs) directed against tumor cell surface antigens with the cytotoxicity of anti-cancer drugs [Citation14]. Whereas the manufacture of ADCs is complex because Chinese hamster ovary (CHO) cells are required for mAbs and another system for the manufacture of the toxic cargo, RITs can reduce production complexity and costs because the selectivity-mediating component (usually a mAb) and toxin are produced as a single fusion protein [Citation14]. RITs can be produced in bacteria but may aggregate as insoluble inclusion bodies, which require a lengthy, low-recovery refolding procedure [Citation15]. This is because microbial systems often lack the ability to introduce post-translational modifications (PTMs) required for mAb folding, stability and activity [Citation11,Citation14,Citation16]. Instead, functional RITs can be produced in plants [Citation16,Citation17], where recombinant proteins levels up to ~6 g kg−1 wet plant biomass have been reported for protease inhibitors when using transient expression in Nicotiana benthamiana [Citation18]. Good manufacturing practices (GMP) have been established for this system too [Citation19]. Differences in glycosylation between plants and humans do not appear to pose a health risk in clinical trials [Citation20], but the plant glycosylation machinery can be humanized if necessary [Citation21]. Furthermore, plants can tolerate the expression of some toxins that cannot be produced in mammalian cells, such as the mistletoe toxin and anti-cancer agent viscumin [Citation22]. Viscumin expression levels of ~7 mg kg−1 wet plant biomass have been reported, which may serve as a threshold of accumulation levels for RITs given that little is known about the specific capabilities of plants for RIT production, even in model systems such as tobacco (N. tabacum) [Citation14]. Overall, plants are often regarded as a sustainable alternative to established microbial and mammalian hosts because production in the former is rapid (in case of transient expression <2 months [Citation23]), easy to scale-up [Citation24], inherently safe [Citation25] and compatible with cascading biomass use [Citation26]. This potential was recently underlined by the first approval of a biopharmaceutical protein (a virus-like particle-based vaccine against SARS-CoV-2) produced in intact plants by the Canadian regulatory authorities [Citation27].
We therefore systematically designed a set of RITs, evaluated and optimized their expression in plant cell packs (PCPs) derived from tobacco BY-2 cells [Citation28] and scaled-up production in differentiated N. benthamiana plants, including downstream protein purification (Figure S1). We tested the potency and efficacy of one purified RIT in human AML cell lines in vitro. Our results shed light on the mechanisms underlying RIT expression in plants and can form the basis for GMP-compliant RIT production in the future [Citation19,Citation29].
Materials and methods
Molecular cloning and plant expression vectors
The pTRAc plasmid was treated with NcoI and XhoI (New England BioLabs, Ipswich, USA) and the excised fragment was replaced with RIT sequences amplified by PCR using primers containing the compatible restriction sites (). DNA was amplified by polymerase chain reaction (PCR) in a Flex Cycler2 PCR heat cycler (Analytik Jena, Jena, Germany) using Q5-HF-polymerase (New England Biolabs, Ipswich, USA) according to the standard pipetting scheme described by the manufacturer [Citation30,Citation31]. The DNA fragments were purified using a NucleoSpin kit (Machery-Nagel) and ligated using T4 DNA ligase (New England BioLabs). The resulting plasmids () were purified using a 1.2% [m m−1] agarose gel electrophoresis with 0.5 mg L−1 ethidium bromide (Sigma Aldrich, St. Louis, USA) and subsequent gel isolation using the NucleoSpin kit (Machery-Nagel) according to the manufacturer’s instruction [Citation32]. Then, purified plasmid DNA was introduced into chemically competent Escherichia coli DH5α cells and electro-competent Rhizobium radiobacter (formerly Agrobacterium tumefaciens) GV3101 cells. Cloning was verified by PCR and sequencing of the inserts. R. radiobacter cell cultures were used to prepare 25% (v v−1) glycerol stocks by thoroughly mixing 500 µL of R. radiobacter cell culture with 500 µL of 50% (v v−1) sterile glycerol solution, with a final OD600 nm of 1.0, which were stored at −80°C.
Table 1. Primers used to clone RIT variants.
Table 2. Plasmids for transient RIT expression in PCPs and differentiated plants. All pTrac vectors contain the double enhanced cauliflower mosaic virus 35S promoter (CaMV35SS). Both, the anti-CD64 and anti-CD89 scFv are humanized versions of antibodies originating from mice.
Preparation and extraction of PCPs
Nicotiana tabacum L. cultivar Bright Yellow 2 (BY-2) cells were obtained from the Leibniz-Institute DSMZ Deutsche Sammlung von Mikroorganismen und Zellkulturen GmbH on the 20th of January 2020 (ID PC 1181). BY-2 cells from a continuous cell suspension culture were expanded in 0.5-L shake flasks containing 0.2 L of plant cell cultivation medium (4.3 g L−1 Murashige-Skoog basal salts, 88 mM sucrose, 1.47 mM monopotassium phosphate, 3.0 µM thiamin-hydrochloride, 0.55 mM myo-inositol, 0.9 µM 2,4-dichlorophenoxyacetic acid) for 5 days at 26°C, shaking at 160 rpm in an ISFX-1 shaker (Adolf Kühner, Birsfelden, Switzerland), to reach a cell wet mass of ~200 g L−1. In parallel, R. radiobacter was grown in 200-mL culture flasks (Schott, Mainz, Germany) with 50 mL yeast extract broth (YEB) medium (5.0 g L−1 beef extract, 1.0 g L−1 yeast extract, 5.0 g L−1 soy peptone, 5.0 g L−1 sucrose, 0.5 g L−1 magnesium sulfate, pH 7.0), supplemented with kanamycin (25 mg L−1), rifampicin (25 mg L−1) and carbenicillin (50 mg L−1) at 27°C for two days on a shaker at 160 rpm after inoculation with 200 µL of R. radiobacter glycerol stock solution [Citation33]. The R. radiobacter culture was adjusted to an OD600 nm of 0.1–1.3 according to the experimental plan using infiltration buffer (0.5 g L−1 Murashige-Skoog salts M0221, 50.0 g L−1 sucrose, 2.0 g L−1 glucose monohydrate, 0.04 g L−1 acetosyringone, pH 5.6) and then used for infiltration of PCPs [Citation28]. PCPs were cast from 300 µL of a continuous BY-2 cell culture grown in 200-mL Erlenmeyer glass flasks with ~200 g L−1 wet biomass [Citation28]. Briefly, the BY-2 cell suspension was transferred to AcroPrep Advance PP/PE 30–40 µm multi-well filter plates (Pall, Dreieich, Germany) and the culture medium was removed by centrifugation (1800 × g, 1 min, 20°C). R. radiobacter cultures were harvested by centrifugation (16,000 × g, 1.5 min, 20°C) and the pellet was re-suspended in 1.0 mL infiltration buffer (0.5 g L−1 Murashige and Skoog (MS) salts, 50 g L−1 sucrose, 2 g L−1 glucose monohydrate, 15 mM MES, 200 µM acetosyringone, pH 5.6). The cell suspension was then diluted to a final infiltration OD600 nm of 0.4 with the same infiltration buffer and incubated on a rotary shaker at 22°C and 50 rpm for 1 h. We transferred 100 µL of the solution onto individual PCPs and incubated for 1 h at 22°C before removing the liquid by centrifugation (1600 × g, 1 min, 22°C) [Citation33]. The PCPs were incubated at ~ 26°C in the dark, harvested 3–7 days post-infiltration (dpi) and homogenized by bead-mill extraction using an MM300 mixer (Retsch, Haan, Germany). We added three volumes (v m−1) of extraction buffer (20 mM sodium phosphate, 500 mM sodium chloride, 10 mM sodium bisulfite, pH 8.0) then applied three 30-s pulses at 28 Hz. After centrifugation (4000 × g, 8 min, 21°C), the supernatant was analyzed or stored at −20°C. Alternatively, PCPs were harvested after 3–7 dpi and used for BY-2 cell viability measurements.
Preparative PCP (pPCPs)
We transferred 10.0 mL of BY-2 cells from a continuous shake flask suspension culture at a density of ~200 g L−1 to a 10-mL syringe (Braun, Melsungen, Germany) equipped with a custom-made filter layer prepared from thick blotting paper (Bio-Rad, Hercules, USA). Residual medium was removed by applying a pressure of ~ 0.2 MPa and the preparative PCP (pPCP) was infiltrated with 6.0 mL R. radiobacter suspension prepared as described above and incubated for 1 h at 22°C. The infiltration suspension was removed and the pPCPs were incubated for 4 days at 26°C and a relative humidity of ~ 55%. Samples were extracted by sonication using a SonoPuls device equipped with a SonoPuls MS73 titanium alloy microtip (Bandelin, Berlin, Germany) at 40 W for 2 × 30 s with a 0.9-s interval. Extracts were clarified by two rounds of centrifugation (4200 × g, 10 min, 10°C) and the supernatant was passed through a hydrophilic 0.2-µm MiniSart syringe sterile filter (Sartorius, Göttingen, Germany) before the chromatography step.
Viability of infiltrated PCPs
BY-2 cells from PCPs were harvested 3–5 days dpi with R. radiobacter and 50 mg PCP mass was dispersed in 1.0 mL PBS (137 mM sodium chloride, 2.7 mM potassium chloride, 10 mM disodium hydrogen phosphate, 1.8 mM sodium dihydrogen phosphate, pH 7.2) before adding 50 µL of Evans blue dye (Sigma-Aldrich, St. Louis, USA). After incubation for 10 min at 22°C, we transferred 5.0 µL of the cell suspension to a Fuchs-Rosenthal counting chamber (height = 0.2 mm, area = 16 mm2; Brand, Wertheim, Germany) and applied a glass coverslip (Carl Roth, Karlsruhe, Germany). The living cells were quantified by counting stained and unstained cells in five group quadrates per sample using an Olympus CKX41 microscope (Olympus, Tokyo, Japan) equipped with a ProgRes CFcool camera. Data were acquired and evaluated using ProgRes CapturePro v2.8.8 camera control software (Jenoptik, Jena, Germany).
Transient expression in differentiated tobacco plants
Seeds from tobacco plants were a donation from the RWTH Aachen University in 2006. Wild type N. tabacum K326 and N. benthamiana seeds were germinated on stone wool blocks soaked with 1.0 g L−1 Ferty 2 Mega fertilizer solution (Planta Düngemittel, Regenstauf, Germany) and incubated for 7 days before transfer to custom-made plastic trails and incubation in a greenhouse setting at 25/22°C light/dark and ~ 70% relative humidity with a ~14 h photoperiod. Natural light was augmented using 400-W IP65 sodium discharge lamps (Phillips, Amsterdam, Netherlands) and SON-K artificial light (Phillips) if required, depending on the weather conditions [Citation34,Citation35]. The plants were irrigated with 1.0 g L−1 Ferty 2 Mega fertilizer solution for 12 min ~ 2–4 times per day using an ebb-and-flow hydroponic system that removed residual liquid after each watering phase. Plants were harvested 42 days after seeding and infiltration was performed by injecting R. radiobacter infiltration suspension into the leaves using a needleless 0.5-mL syringe (Braun) as previously described [Citation36]. The plants were covered in plastic film with a ventilation opening at the top and incubated in a phytotron for 3–6 days at 22.0°C, a relative humidity of 70%, and irrigation with water on days 2 and 4. Light was provided for 14 h per day using metal halide lamps (256 or 150 µmol m−2 s−1 photosynthetically active radiation, without or with covering plastic film, respectively).
Extraction of plant leaf material
Target proteins were extracted from freshly harvested N. benthamiana or N. tabacum leaves by homogenization in a ProBlend 3 blender (Phillips, Amsterdam, Netherlands). We added 3 mL extraction buffer g−1 biomass and applied three pulses of 30 s interspersed with pauses for 30 s. We measured the conductivity, turbidity and pH of the homogenate and adjusted to pH 8.0 with 0.4 M trisodium phosphate. The turbidity of a 20-fold dilution was measured using a 2100P ISO turbidimeter (Hach, Loveland, USA) to reach a value below 1000 nephelometric turbidity units (NTU). Coarse particles were removed from the homogenate by filtration through a double layer of Miracloth (Merck Millipore, Burlington, USA) with a pore size of 22–25 µm. Fine particles were then removed by centrifugation (4200 × g, 20 min, 10°C) in a MegaFuge (Thermo Fisher Scientific, Waltham, USA) [Citation37]. A depth filter layer combination of V700P and V100P with a nominal retention rating of 8–20 and 1–3 µm respectively with a filter area of 56 cm2 were mounted in VelaPad filter housing (Pall, Port Washington, USA), pre-wetted with 200 mL extraction buffer and depth filtration was performed using a Masterflex peristaltic pump (Masterflex SE, Gelsenkirchen, Germany) at a constant volumetric flux of 28 mL min1 up to a maximum backpressure of 0.2 MPa.
The clarified extracts were passed through a Sartopore2 150 sterile filter (Sartorius) with a filter area of 0.015 cm2 and a pore size combination of 0.45 + 0.2 µm. A hydrophilic 0.2 µm MiniSart syringe sterile filter (Sartorius) was used for volumes <100 mL.
Protein L affinity chromatography
Sterile extracts were purified by Capto L affinity chromatography (Cytiva, Marlborough, USA) using up to eight parallelized 0.2-mL RoboColumns on a JANUS liquid handling station (Perkin Elmer, Waltham, USA) for high-throughput screening of optimal buffer conditions or on 1.0-mL pre-packed Capto L columns (Repligen, Waltham, USA) for preparative chromatography on an ÄKTA pure system (Cytiva). A similar method was used for the scale-down model. Columns were equilibrated in five column volumes (CV) of equilibration buffer (20 mM sodium phosphate, 150 mM sodium chloride, pH 7.2), followed by the loading of clarified extracts in 20 CV. We then applied 5 CV of wash buffer (20 mM phosphate, 5 mS cm−1, pH 8.0) and 5 CV of elution buffer (25 mM acetate, 650 mM sodium chloride (55 mS cm−1), pH 2.1 or 10 mM sodium hydroxide, pH 12.3). We used a flow rate of 0.3 mL−1 min (0.91 m h−1) for the JANUS station (the lowest possible flow rate on that device) and 0.25 mL min−1 (0.29 m h−1) on the ÄKTA system. The 1.0-mL fractions were immediately neutralized and used for RIT quantification.
RIT stability evaluation
Purified RIT VisA-anti-CD64 produced in pPCPs or N. benthamiana plants was exchanged into PBS using a Vivaspin 20 centrifugal filter with a molecular mass cutoff of 10 kDa (Sartorius), the final concentration was adjusted to ~10 mg L−1 and the solution was incubated for up to 3 days at 4°C or 37°C, or for up to 365 days at −20°C. In the latter case, we tested preparations with and without 10% (v v−1) glycerol. Residual protease activity in RIT preparations was determined using a colorimetric protease assay as described previously [Citation34].
Protein quantification
Samples were analyzed by lithium dodecylsulfate polyacrylamide gel electrophoresis (LDS-PAGE) [Citation35]. NuPAGE 4–12% Bis-Tris LDS-PAGE gels (Thermo Fisher Scientific, Waltham, MA, USA) with 10, 12, 15 or 26 gel slots were used according to the manufacturer’s instructions. Samples containing 1× reducing agent (Thermo Fisher Scientific) and 1× LDS loading buffer (Thermo Fisher Scientific) were denatured for 10 min at 70°C on a Techne shaking Dri-Block DB-3 heat block (Bibby Scientific, Stone, UK) or alternatively on a Biometra-TRIO PCR cycler (Biometra, Göttingen, Germany). Samples containing salt concentrations ≥2 M sodium chloride were heated for another ~ 30 s before loading onto the gels to avoid phase separation of the protein and buffer. Volumes of 10 µL sample solution or 5 µL 10–180 kDa PageRuler pre-stained protein standard (Thermo Fisher Scientific) were loaded per gel slot. Electrophoresis was carried out in a PowerPac HC electrophoresis module (Bio-Rad Laboratories, Hercules, CA, USA) at 200 V for 37 min. Gels were washed for 15 min with water and stained with SimplyBlue SafeStain (Thermo Fisher Scientific) for 1 h at 22°C on a rocker (Bibby Scientific, Stone, UK) at 19 rpm. After 1–2 h of destaining in water, gels were transferred onto plastic foil and scanned using a CanoScan 5600F (Canon, Tokyo, Japan) film scanner and Adobe Photoshop CS5.1 (Adobe, San Jose, CA, USA) at 600 dots per inch.
LDS-PAA gels after electrophoresis and blotting membranes (0.2 µm nitrocellulose membranes, Life Technologies) were equilibrated in blotting buffer (0.6 g L−1 TRIS, 14.6 g L−1 glycine, pH 8.3) for 5 min before plotting with 40 V for one hour in a blotting module (GE Healthcare). The membrane was blocked in 5% (m v−1) milk powder solution in PBS-T buffer (8.0 g L−1 sodium chloride, 0.2 g L−1 potassium chloride, 1.2 g L−1 disodium chloride, 0.15 g L−1 monopotassium phosphate, 0.05% (v v−1) Tween-20) for one h at 21°C. Primary antibody was added to the blocking solution and (5.0% (m v−1) milk powder in PBS-T) incubated for one h at 21°C on a rocker (Barloworld Scientific) at 16 rpm or overnight at 4°C. The membranes were washed three times for 5 min with ~10 mL PBS-T buffer. The secondary antibody was added into 10 mL milk powder blocking solution, blotting membranes were added and equilibrated for one h at 21°C. The membranes were washed again for 5 min with ~10 mL of PBS-T buffer and were then equilibrated in alkaline phosphatase (AP) buffer (12.1 g L−1 TRIS, 5.8 g L−1 sodium chloride, 5.0 g L−1 magnesium chloride, pH 9.6) for ~5 min. The nitroblue tetrazolium (NBT) and 5-bromo-4-chloro-3-indolyl-phosphate (BCIP) substrate solution dissolved in dimethylformamide in concentrations of 0.33 and 0.165 g L−1, respectively (Carl Roth, Karlsruhe, Germany) was added to the AP buffer as a 1:100 (v v−1) dilution. The reaction was stopped by washing the blotting membranes with water. The blots were dried and scanned using a CanoScan 5600F (Canon) scanner and Adobe Photoshop (Adobe, San Jose, USA) at 600 dots per inch. For dot blots 5 µL of sample were pipetted onto a dry blotting membrane and treated as described above starting with the blocking procedure [Citation30,Citation38]. Protein standards with concentration ranging from 1–100 g L−1 of Viscumin A or ETA′-anti-CD64 fusion proteins were used to quantify RIT concentration via western blotting. Samples containing RITs were also stained using primary antibodies specific for mCherry, VisA or ETA′ () and alkaline phosphatase (AP)-labeled secondary antibodies. Extracts of constructs containing mCherry mock RITs were also quantified by fluorimetry [Citation35]. Target proteins and their degradation products were quantified using AIDA software (Elysia-Raytest, Angleur, Belgium). We also used a colorimetric Pierce protease assay (Thermo Fisher Scientific) [Citation34].
Table 3. Primary and secondary IgG antibodies used for the immunodetection of RITs.
In vitro cell culture and activity measurements
The cell lines MonoMac-I (DSMZ Nr. ACC 252), THP-I (DSMZ Nr. ACC 16), HL-60 (DSMZ Nr. ACC 3) and Ramos (DSMZ Nr. ACC 603) were supplied by DSMZ (German Collection of Microorganisms and Cell Cultures GmbH, Braunschweig, Germany). Human AML cell lines were cultured in sterile Nunc T-flasks (Thermo Fisher Scientific) at 37°C and ~ 95% relative humidity in a Binder (Tuttlingen, Germany) cell culture incubator with a 5.0% (v v−1) carbon dioxide atmosphere. The cells were cultured in R10 medium (Gibco RPMI 1640 + GlutaMAX with 10% (v v−1) fetal calf serum, 1000 U mL−1 penicillin and 10 mg L−1 streptomycin) at a density of ~ 1–5 × 10⁶ cells mL−1 and passaged ~ 2–3 times per week. The morphology of cultured cells was monitored using an Olympus CKX41 microscope equipped with a ProgRes CFcool camera and ProgRes CapturePro v2.8.8 camera control software for data acquisition as described above.
For leukemia surface marker presentation tests, cells were stimulated with 0–1400 U mL−1 and for RIT activity tests with 1000 U mL−1 recombinant human tumor necrosis factor α (TNFα) (Thermo Fisher Scientific) for 24 h in 16-well culture plates (Greiner Bio-One, Kremsmünster, Austria). The medium was removed by centrifugation (18 × g, 10 min, 21°C) and the cells were resuspended in PBS at a density of 1–2 × 10⁶ cells mL−1. The cells were labeled with antibodies () for 30–45 min at 4°C in the dark. Unbound antibodies were removed by centrifugation as above before resuspending the cell pellet in fresh PBS. Labeled cells and unlabeled controls were analyzed in triplicate by flow cytometry.
Table 4. FITC-conjugated antibodies used to label AML-specific CD markers in flow cytometry.
Flow cytometry
Fluorescent signals were measured using a FACSVerse (BD Biosciences, Franklin Lakes, USA) after quality control and calibration using the CS & T research beads (BD Biosciences) before each experiment. The voltage of the photomultiplier tube was calibrated so that untreated viable cells appeared in the first decade (10°–101) in a log-scale side vs forward scatter (SSC/FSC) plot. Circular gating was used to exclude cell fragments (Figure S2). FITC-labeled (519 nm emission wavelength) cells were detected in 300-µL samples containing ~ 1–2 × 10⁴ cells (3.3–6.6 × 10⁷ cells L−1) using identical settings and a combination of excitation lasers and emission filters (). Data were acquired and visualized using FACSSuite Software (BD Biosciences).
AML cell viability assay
The viability of human AML cell lines after RIT treatment was determined using an XTT cell proliferation assay based on the reagent 2,3-bis-(2-methoxy-4-nitro-5-sulfophenyl)-2 H-tetrazolium-5-carboxanilide (Servas Electrophoresis, Heidelberg, Germany). Cells were seeded into 96-well transparent culture plates (Greiner Bio-One) at a density of 104–105 cells in 200 µL per well (1 × 10⁷ cells L−1), stimulated with 1000 U mL−1 recombinant human TNFα and incubated for 24 h at 37°C in a 5.0% (v v−1) carbon dioxide atmosphere. The cells were then treated with 20 µL of RIT serial dilutions in PBS with effective concentrations of 0.01–1000 mg L−1. We used ≥ 6 replicates of 150 mg L−1 puromycin as positive controls and PBS as a negative control. The cells were incubated for 48 h at 37°C in a 5.0% (v v−1) carbon dioxide atmosphere before the XTT assay. Absorbance was measured twice each at 450 nm and 650 nm (blank for background adsorption) on a ClarioStar plate reader (BMG Labtech, Freiburg, Germany) using ClarioStar v5.40 software for data acquisition and export. The AML cell viability data were normalized by subtracting the blank values of negative controls and the background adsorption from the measured values of treated cells (Equation 1).
where A is the normalized absorbance signal and the subscript numbers indicate the wavelengths used during measurement. The normalized data were fitted using a dose – response function (Equation 2) for the determination of half maximal inhibitory concentrations (IC50).
where A1 is the minimal value at zero concentration, A2 the maximum value at infinite concentration, log10(x0) is the center (i.e. the concentration at half maximal response, IC50), (A1+A2)/2) is the half-maximal response and p is the Hill slope (i.e. the slope of the tangent to the curve at half-maximal response).
Statistical analysis
The α‐level was 0.05 in all cases unless stated otherwise. For comparison of multiple groups of samples a one-way or two-way analysis of variance (ANOVA) with Bonferroni correction was performed. Comparison of two samples was performed using (i) the Shapiro-Wilk test to ensure normal distribution, (ii) a two‐sample f-test to confirm equal variances followed by (iii) a two‐sample two‐sided Student’s t test to investigate differences between samples. For samples with unequal variances a Welch’s t-test was applied. We described the number of replicates, i.e. individual sample size, as n and the statistical population, i.e. the total sample size, as N. All descriptive models compiled during this study were evaluated using Design Expert v.11 or v.12 (Stat-Easy, Minneapolis, USA). The Design of Experiments (DoE) methodology is described elsewhere [Citation39].
Results and discussion
Screening RIT variants in PCPs
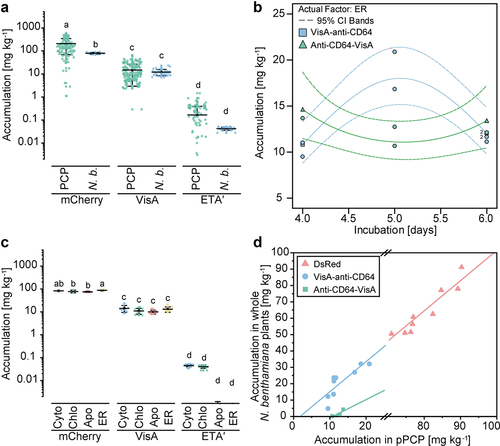
The toxic component of RITs significantly reduced the accumulation of these proteins in PCPs compared to nontoxic counterparts such as the fluorescent protein mCherry (Table S2; ). For example, fusing the A chain of the mistletoe lectin viscumin (VisA) to an anti-CD64 scFv (Table S2) reduced the yields 10-fold to 13.7 ± 11.5 mg kg1 plant mass (± SD, n = 257), whereas the truncated version of Pseudomonas aeruginosa exotoxin A (ETA′) (Table S2) reduced RIT expression to 0.2 ± 0.2 mg kg−1 (± SD, n = 171), which was three orders of magnitude less than the nontoxic fusion protein (). Similarly, the accumulation of full-length mistletoe viscumin reached only ~7 mg kg−1 in tobacco plants [Citation40] and the type-I ribosome inactivating protein (RIP) saporin was not detected at all in tobacco protoplasts by SDS-PAGE, with an approximate detection limit of ~ 0.1–0.5 µg [Citation41,Citation42]. These results indicate that even if toxin accumulation is directed to plant cell organelles devoid of the primary toxin targets, toxic protein domains can nevertheless affect product yields.
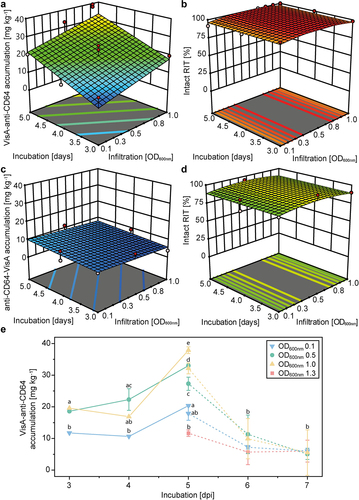
Figure 1. High-throughput screening of RIT accumulation in PCPs for the identification of drug candidates. (a) RIT accumulation in different subcellular compartments. Fusions with N-terminal payload are plotted in light colors and with C-terminal payload in dark colors. Different letters indicate a significant difference for fusions with N-terminal payload (letter before slash) and C-terminal payload (letter after slash). (b) Impact of different scFv antibodies (anti-CD64 and anti-CD89) on the accumulation of RITs based on mCherry, VisA and ETA′ in PCPs. (c) Impact of the RIT orientation on the accumulation of RITs based on mCherry, VisA and ETA′ using the CHS 5′-UTR. Microscopic images of BY-2 cells from PCPs 4 days post-infiltration (dpi) with R. radiobacter carrying plasmids for the expression of mCherry-anti-CD64 (d), treated with harsh extraction buffer (em PCPs harvested 3 dpi (green data points) or 4 dpi (blue data points). Viability was assessed by microscopic analysis of cells after Evans blue staining. Negative controls were non-infiltrated PCPs and positive controls were treated with harsh extraction buffer [Citation28] for 20 min. PCPs were mock infiltrated with R. radiobacter carrying plasmids for the expression of mCherry-anti-CD64. N-terminal and C terminal VisA and ETA′ fusions were targeted to different compartments. Error bars represent standard deviations with n ≥ 4 and N = 456 (a), n ≥ 12 and N = 660 (b), n ≥ 12 and N = 161 (c) or n = 10 (h) biological replicates. Statistical testing was based on two-way ANOVA with Bonferroni correction at a significance level of α = 0.05.Samples with no significant differences are labeled with identical letters. Cyto, cytosol; Chlo, chloroplasts; Apo, apoplast; ER, endoplasmic reticulum.
![Figure 1. High-throughput screening of RIT accumulation in PCPs for the identification of drug candidates. (a) RIT accumulation in different subcellular compartments. Fusions with N-terminal payload are plotted in light colors and with C-terminal payload in dark colors. Different letters indicate a significant difference for fusions with N-terminal payload (letter before slash) and C-terminal payload (letter after slash). (b) Impact of different scFv antibodies (anti-CD64 and anti-CD89) on the accumulation of RITs based on mCherry, VisA and ETA′ in PCPs. (c) Impact of the RIT orientation on the accumulation of RITs based on mCherry, VisA and ETA′ using the CHS 5′-UTR. Microscopic images of BY-2 cells from PCPs 4 days post-infiltration (dpi) with R. radiobacter carrying plasmids for the expression of mCherry-anti-CD64 (d), treated with harsh extraction buffer (em PCPs harvested 3 dpi (green data points) or 4 dpi (blue data points). Viability was assessed by microscopic analysis of cells after Evans blue staining. Negative controls were non-infiltrated PCPs and positive controls were treated with harsh extraction buffer [Citation28] for 20 min. PCPs were mock infiltrated with R. radiobacter carrying plasmids for the expression of mCherry-anti-CD64. N-terminal and C terminal VisA and ETA′ fusions were targeted to different compartments. Error bars represent standard deviations with n ≥ 4 and N = 456 (a), n ≥ 12 and N = 660 (b), n ≥ 12 and N = 161 (c) or n = 10 (h) biological replicates. Statistical testing was based on two-way ANOVA with Bonferroni correction at a significance level of α = 0.05.Samples with no significant differences are labeled with identical letters. Cyto, cytosol; Chlo, chloroplasts; Apo, apoplast; ER, endoplasmic reticulum.](/cms/asset/08d7374a-bdd7-40e8-a112-4de3fd13a6ce/kbie_a_2244235_f0001_oc.jpg)
The expression of VisA-based RITs (Table S2) was on average 80-fold higher (p = 5.5 × 10−65; heteroscedastic t-test for unequal variances) than that of ETA′-based RITs (). This probably reflected the immediate degradation of the ETA′-based proteins we observed by western blot (Figure S3) because we found four specific cleavage sites for the cysteine protease cathepsin K (positions 22, 77, 178 and 227 in the ETA′ amino acid sequence) with scores > 0.95 (scores >0.8 are considered relevant) using PROSPER software [Citation43]. Such cysteine proteases have been linked to the degradation of recombinant proteins produced in plants [Citation34,Citation44]. However, the translocation sequence inherently present in the ~ 40 kDa ETA′ toxin domain [Citation45] may have allowed the recombinant protein to escape from its subcellular compartment [Citation46], potentially triggering the inactivation of protein synthesis in the cytosol and reducing product accumulation.
In this context, targeting RITs to different compartments had only a significant effect on RITs with an N-terminal toxin (). For example, VisA fusion proteins yielded 26.1 ± 8.2 mg kg−1 in the endoplasmic reticulum (ER) (± SD, n = 11) (), which was up to four-fold more than the other compartments, e.g. 6.7 ± 2.8 mg kg−1 in the chloroplast. In contrast, the N-terminal ETA′ and mCherry anti-CD64 fusions accumulated to the highest levels when targeted to the chloroplast (0.3 ± 0.2 mg kg−1; ± SD, n = 85) and apoplast (298.2 ± 119.6 mg kg−1; ± SD, n = 31), respectively. We concluded that the toxin component can have a relevant impact on the conditions corresponding to the highest accumulation levels and therefore the individual screening and optimization of RIT variants is necessary.
This assumption was supported by our observation that RITs adhering to the native domain sequence (i.e. VisA at the N-terminus and ETA′ at the C-terminus) accumulated to 1.4-fold higher levels than the reversed sequence (). However, analysis of variance (ANOVA) indicated that the difference was not significant (, N = 161). Similar results have been described for antibody-toxin fusions produced in E. coli, where unfavorable domain orientations inhibited RIT binding to the target antigen [Citation47,Citation48].
Interestingly, exchanging the scFv of a RIT did not significantly affect the accumulation levels in PCPs (), probably because the differences in structure and physicochemical properties were small, especially compared to the variability of the toxin component. This robustness toward scFv replacement is important because it can facilitate the prompt exchange of the selectivity domain without substantial re-screening of RIT candidates, as in the context of personalized cancer treatment applications [Citation49]. Ultimately, the high-throughput PCP production platform and R. radiobacter -mediated transient expression in whole plants could serve as a rapid manufacturing method for anti-cancer biologicals under GMP conditions [Citation28,Citation50].
The viability of BY-2 cells used for the expression of mock RITs was similar to that of non-infiltrated controls (), suggesting that the infiltration process with R. radiobacter did not induce significant host cell damage within an incubation time of up to 4 days. Compared to the mock RIT, N-terminal or C-terminal VisA fusion reduced BY-2 viability in PCPs at 4 dpi by ~ 2-fold, with cytosolic targeting having the most detrimental effect, leading to viabilities as low as ~ 50% (). From our perspective, this indicated the residual toxicity of VisA RITs in plants. The target of VisA is an rRNA found in 28S ribosomes (located in the cytosol and on the surface of the ER), thus compromising protein biosynthesis and triggering cell death [Citation51]. Interestingly, the RIT appeared to be active in this compartment even though the reducing conditions in the cytosol should not support the formation of the two disulfide bonds (one in each domain of the Fv chains; Figure S4) [Citation52]. We assume that VisA-anti-CD64 was active when produced in the cytosol because the scFv can adopt a stable structure even without disulfide bond formation [Citation53,Citation54], and because even only a correctly folded toxin domain would trigger toxicity. The loss of viability observed for ER-targeted RITs may be due in part to the imperfect targeting of the protein, leaving a fraction in the cytosol, as described for ER-targeted saporin expressed in tobacco protoplasts [Citation41], ER-targeted avidin expressed in transgenic sugarcane plants [Citation55], and the partial mis-targeting of plant-made antibodies [Citation56].
RITs containing C-terminal ETA′ triggered a significantly greater loss of cell viability than VisA counterparts, in some cases killing ~ 90% of the cells, which was comparable only to the effects of a harsh chemical extraction buffer (positive control, ). The degradation we observed for ETA′ RITs may have contributed to their apparent toxicity because free toxin domains can penetrate membranes and refold more easily than full-length RITs (Figure S3) [Citation45].
Overall, we observed no significant difference in BY-2 viability when increasing the PCP incubation time from 3 to 4 dpi, but in most cases the average viability was slightly lower on day 4 probably reflecting the stress of the incubation process (). Microscopic images of BY2 cells after PCP infiltration and incubation showed less intense diffraction around the cell wall when ETA′ fusions were expressed (). This was similar to PCPs treated with a harsh extraction buffer that causes cell wall lysis, and appears to indicate the onset of apoptosis (). In contrast, the cell wall of BY-2 cells expressing VisA-based RITs in PCPs () was similar to that of the mock infiltrated control (). These results supported our BY-2 cell viability data ().
Because active product or fragments thereof (e.g. free toxin) can trigger host cell damage and thus inhibit transient expression, it is important to optimize product stability (e.g. toward proteases) and harvest time [Citation57]. We concluded that the VisA fusions were the most promising RIT candidates in terms of accumulation when targeted to the ER. We used this toxin in combination with an anti-CD64 scFv for further optimization because CD64 was present on all three human cancer cell lines (excluding the Ramos control) as well as on a wide range of AML subtypes [Citation58], whereas CD89 was not [Citation11].
Optimizing process parameters for VisA-anti-CD64 production in PCPs
Next, we used the VisA RITs to optimize expression conditions in PCPs. We found that infiltration OD600 nm and harvest time after infiltration had a significant effect (R2 = 0.82, adjusted R2 = 0.76 and predicted R2 = 0.63) on product accumulation, increasing it ~ 4-fold up to ~40 mg kg−1 at an infiltration OD600 nm of 1.0 and after an incubation time of 5 dpi without detectable product degradation (). This behavior was similar to that of other target proteins expressed in PCPs, such as the fluorescent protein DsRed and IgG3 mAbs [Citation38]. Interestingly, the effect of the process parameters was limited to the N-terminal VisA fusion targeted to the ER whereas the C-terminal counterpart remained at ~10 mg kg−1 throughout the design space, so we think that the root-cause was the domain orientation, e.g. triggering misfolding of C-terminal fusions to some extent, but this will require further investigation (). We therefore proceeded with the N-terminal VisA fusion targeted to the ER for scale-up and purification.
Figure 2. Optimization of PCP-based expression using VisA RITs targeted to the ER. (a) Response surface indicating the impact of incubation time and infiltration OD600 nm on the accumulation of the ER-targeted VisA-anti-CD64 RIT transiently expressed in PCPs. (b) Impact of incubation time and infiltration OD600 nm on the stability of the VisA-anti-CD64 RIT produced in PCPs. (c) Impact of incubation time and infiltration OD600 nm on the accumulation level of the anti-CD64-VisA RIT produced in PCPs. (d) Impact of incubation time and infiltration OD600 nm on the stability of the anti-CD64-VisA RIT produced in PCPs. (e) Impact of incubation time and infiltration OD600 nm on VisA-anti-CD64 accumulation in PCPs. Data were derived from the DoE (solid lines) and additional experiments (dashed lines). Error bars represent the standard deviation (n ≥ 3) with groups of significantly different means based on an α-level of 0.05 and two-way ANOVA (with Bonferroni correction) shown as letters. Dark and light red dots in a – d represent experimental data points above and below the model respectively and model quality parameters are given in Table S1.
Expression of RITs in plants and preparative PCPs
In whole plants, the transient expression levels of VisA RITs were 14.2 ± 4.7 mg kg−1 (± SD, n = 8; ER-targeting) before optimization () and ~20 mg kg−1 after optimization using a DoE approach (), which was ~ 20% compared to the mCherry control (87.3 ± 2.8 mg kg−1; ± SD, n = 3). The ETA′ fusions accumulated to only ~0.05 mg kg−1, which was close to the detection limit and consistent with the small-scale screening in PCPs (). There was no significant difference in the accumulation of VisA or ETA′ fusions between plants and PCPs, but the mCherry control was up to 1.5-fold more abundant in PCPs (), in agreement with previous reports [Citation50]. Targeting RITs to different subcellular compartments did not have a significant effect on accumulation when using the VisA or ETA′ payload (). Nevertheless, the highest average level of VisA and mCherry fusions was observed in the ER of both PCPs and plants, indicating a good correlation between the two settings. For example, the incubation time resulting in the highest accumulation was 5 dpi for both VisA and mCherry (). Interestingly, the C-terminal VisA fusions accumulated to ~ 12–15 mg kg−1 regardless of the incubation time. Overall, the correlation between expression in whole plants and pPCPs (~0.01 kg per PCP) was linear, with Pearson’s r values of 0.84 (VisA-anti-CD64, R2 = 0.70, adj. R2 = 0.66), 0.87 (anti-CD64-VisA, R2 = 0.75, adj. R2 = 0.67) and 0.94 (mCherry, R2 = 0.87, adj. R2 = 0.86) (). PCPs are easier to handle compared to expression in plants, so we continued to produce RITs in pPCPs at the bench scale (milligram quantities) for subsequent in vitro activity tests and we used ER-targeted VisA-anti-CD64 for extraction and purification experiments.
Figure 3. Scalability of RIT expression to differentiated plants and preparative PCPs (pPCPs). (a) Comparison of PCPs and differentiated N. benthamiana plants for the expression of RITs with different payloads. (b) Accumulation of ER-targeted N-terminal (red dots) and C-terminal (green dots) VisA-based RITs in differentiated N. benthamiana plants according to the incubation time after infiltration (4–6 days). Dotted lines represent 95% confidence intervals (CI) for the model with a fair fit (Table S2) using a natural log transformation. (c) Accumulation of RITs in N. benthamiana plants (different subcellular compartments) for different payloads conjugated to an anti-CD64 scFv. (d) Correlation of DsRed in differentiated N. benthamiana plants and pPCPs generated from a BY-2 culture volume of 10 mL with a cell density of 200 g L−1 (m v−1) and n ≥ 7 biological replicates (N = 24). Lines represent linear fits (Table S3). Error bars represent standard deviation with n ≥ 9 (a) or n ≥ 3 (c) and N = 554 (a) or N = 77 (c) biological replicates. In a and c, statistical significance was determined by two-way ANOVA with Bonferroni correction. Samples without significant differences are marked with identical letters. Apo, apoplast; Chlo, chloroplast; Cyto, cytosol; ER, endoplasmic reticulum; N.B., N. benthamiana.
Extraction of RITs from plants and plant cells
We sonicated pPCPs expressing VisA-anti-CD64 and clarified the extracts by centrifugation, which resulted in recoveries of 90.5% ± 3.6% (n = 3) after a final sterile filtration step (, Figure S5). When VisA-anti-CD64 was extracted from N. benthamiana leaves using a blade-based homogenizer, the same clarification strategy achieved a recovery of ~ 85%, which was close to the sonication results. The centrifugation step was contained and thus compatible with the BSL-2 rating of the genetically modified R. radiobacter present at this process stage, but it was difficult to scale-up [Citation24,Citation35,Citation59].
Table 5. Extraction, clarification and purification of VisA-anti-CD64 RIT and surrogate fusion protein from pPCPs and plants.
To develop a scalable process, we used mCherry-anti-CD64 produced in N. benthamiana plants as a surrogate for downstream processing (DSP). After blade-based extraction [Citation60], clarification based on a combination of bag, depth and sterile filtration reduced the turbidity ~ 1000-fold but the recovery of the ER-targeted product fell to ~ 45%, with bag filtration and sterile filtration accounting for most of the losses. These recoveries were also lower than those achieved for an IgG1 (75%) and DsRed (90%) [Citation61], as well as a DsRed-based ligand (~70%) [Citation62], but in the same range as reported for an IgG3 (42%) [Citation38] and higher than those achieved for biofilm-degrading enzymes (~10%) [Citation46], all based on the same clarification strategy. We concluded that filtration can achieve the necessary turbidity reduction but will require product-specific optimization once the actual RIT process is scaled up, for example by modifying the buffer composition and/or filter layer selection [Citation37,Citation60,Citation63].
Purification of plant-derived RITs by chromatography
Next, we improved the performance (purity and recovery) of a Protein L purification step in a DoE approach, again using mCherry-anti-CD64 as a RIT surrogate. The corresponding predictive models were of fair to good quality, with coefficients of determination in the 0.55–0.92 range (Table S5). The models indicated that recoveries and purities > 95% were achieved if both elution buffer conductivity and elution pH were low, and when a high-pH wash buffer and low-pH elution buffer were applied (). Furthermore, reducing the elution buffer conductivity to ~5 mS cm−1 increased the purity of the RIT surrogate by ~ 65% when using an elution buffer at the low end of the design space, which coincided with conditions for high recovery. The wash buffer pH did not have a significant effect on recovery. Even though the conditions required for high purity and recovery were extreme, they were still within the operation range of the Protein L matrix according to the manufacturer. We therefore verified the suggested conditions in independent experiments using the VisA-anti-CD64 RIT produced in intact plants (), and achieved a recovery > 80% and a purity of ~ 80%, in agreement with the DoE predictions.
Figure 4. Downstream process development for scFv-based RITs produced in plants and pPCPs. (a) Response surface as a function of RIT recovery during a Capto L chromatography capture step using whole plant extracts containing mCherry-anti-CD64, showing dependence on elution buffer conductivity (5–25 mS cm−1) and elution buffer pH (2.0–3.0). The model had a good fit (Table S4). (b) Response surface as a function of RIT purity during a Capto L chromatography capture step using whole plant-derived extracts containing mCherry-anti-CD64, showing dependence on the wash buffer pH (4.0–8.0) and elution buffer pH (2.0–3.0). The model had a poor fit (Table S5). (c) LDS-PAGE and western blot analysis (gel and blot overlay) showing Protein L chromatography samples of VisA-anti-CD64 from whole plants or pPCPs using a two-step elution with pH 2.1 and 12.3. (d) Response surface as a function of VisA-anti-CD64 RIT recovery from pPCP extracts during a Protein L chromatography capture step, showing dependence on the elution buffer conductivity (40–100 mS cm−1) and elution buffer pH (2.0–3.0). The model had a good fit (Table S6). (e) LDS-PAGE and western blot analysis of pooled elution and buffer exchange samples of VisA-anti-CD64 purified from pPCPs by Protein L chromatography using a two-step elution with pH 2.1 and 12.3. Control, 25 mg L−1 VisA; marker, Pre-stained protein ladder; Hom, homogenate; Centr, centrifugation (supernatant); FT, flow through; W, wash; Elu, elution; TSP, total soluble protein; pPCP, preparative PCP.
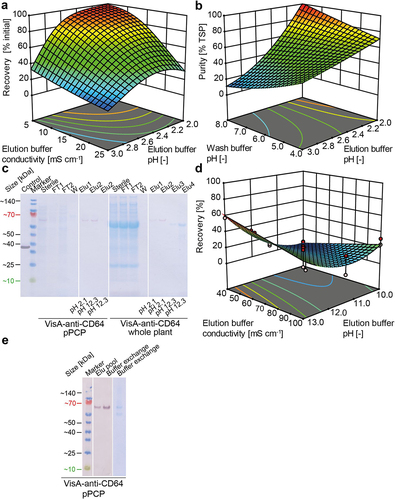
Interestingly, when we used VisA-anti-CD64 derived from pPCPs, the elution at pH 2.1 was incomplete (recovery ~40%) and a second high-pH elution step was required to restore the step recovery. It is known that Protein L-immobilized resins commonly require elution condition at lower pH values compared to Protein A resin which can be problematic for the protein stability. We optimized this second step by varying the elution pH (10–13) and the elution buffer conductivity (10–100 mS cm−1). The predictive models of recovery and purity were of good quality (Table S6) and a recovery of up to ~ 60% was achieved at pH 13.0 (). We verified these conditions in independent experiments and found that the total recovery and purity of VisA-anti-CD64 produced in pPCPs was > 80% after Protein L chromatography (). We used this protein for subsequent stability and activity tests.
RIT stability during short-term and long-term storage
ER-targeted VisA-anti-CD64 purified from BY-2 pPCPs was kept in PBS at −20°C and 4°C to evaluate stability during long-term and short-term storage, and at 37°C for the purpose of in vitro cytotoxicity assays. Less than 50% of the VisA-anti-CD64 produced in N. benthamiana plants remained in its intact form after incubation at 37°C for 2 days (48 h) (), which is the typical incubation time for a cytotoxicity assay. We therefore concluded that this preparation was inadequate for such assays. We assumed that plant-derived proteases (e.g. secreted into the intercellular space of the pPCPs or released from the vacuole [Citation64,Citation65]) were responsible for the rapid loss of intact VisA-anti-CD64 as it has been reported for the production of recombinant proteins in transgenic plants [Citation34]. A protease assay revealed that ~ 0.1 and 0.2 mg L−1 of proteases were still present after the chromatographic purification of pPCP-derived and plant-derived RITs, respectively. Although this was two orders of magnitude less than the unfiltered extract, it may explain the loss of product and agreed well with the faster loss of RIT in plant-derived compared to pPCP-based preparations. The inactivation of these proteases, for example due to auto-proteolysis, may explain why the proportion of intact product leveled out at ~ 30% after incubation for more than 2 days and adding protease inhibitors during extraction could improve the stability of RITs [Citation66], but would be expensive for large-scale processes.
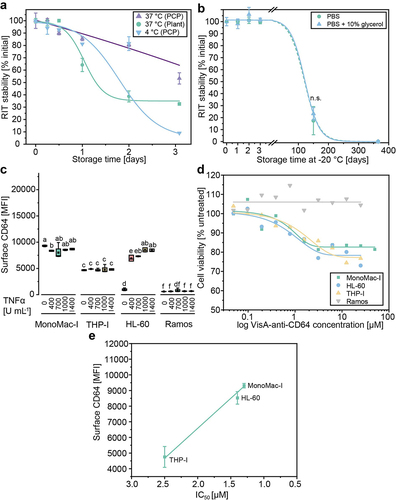
Figure 5. Evaluation of VisA-anti-CD64 stability and activity. (a) Stability of Protein L-purified VisA-anti-CD64 derived from N. benthamiana plants or BY-2 PCPs. Stability was tested at temperatures required for in vitro or in vivo activity studies (37°C) and short-term storage (4°C) based on western blot analysis (Table S5). (b) Long-term stability of purified, Ppcp-derived VisA-anti-CD64 stored at − 20°C in PBS with and without 10% (v v−1) glycerol based on western blot analysis. Measurement after 150 days with and without 10% (v v−1) glycerol were compared by Welch’s t-test (p = 0.35, α = 0.05). (c) Analysis of human AML cell lines and a CD64– control (Ramos) stimulated with TNFα for 24 h by flow cytometry. Data represent the mean fluorescence intensity (MFI) from the surface of 103 cells. Statistical significance (α = 0.05) was determined by ANOVA with Bonferroni correction. Samples without significant differences are marked with identical letters. (d) Viability of human AML cell lines treated with VisA-anti-CD64 RITs purified from PCPs based on a colorimetric XTT assay. Cells were stimulated with 1000 U mL−1 TNFα 24 h before treatment with 0.05–50 µM VisA-anti-CD64 and were incubated at 37°C in a 5% CO2 atmosphere. We used 150 mg L−1 puromycin as a positive control and PBS as a negative control. IC50 values were 1.3 µM for MonoMac-I, 1.4 µM for HL-60 and 2.5 µM for THP-I. (e) Correlation between CD64 surface presentation on human AML cell lines MonoMac-I, HL-60 and THP-I and relative IC50 values determined for VisA-antiCD64 RIT produced in pPCPs and purified using Protein L. Error bars represent standard deviation of n = 3 biological replicates. Lines represent fits using Boltzmann (a, b), dose response (d) or linear functions (e) (details in Table S5). IC50, half maximal inhibitory concentration; MFI, mean fluorescence intensity; n.S., not significant; PBS, phosphate-buffered saline; TNFα, tumor necrosis factor α.
In contrast, > 80% of VisA-anti-CD64 produced in BY-2 PCPs was present in an intact form after 2 days at both 4°C and 37°C. This increased fraction of intact product in PCP extracts was consistent with the reduced proteolytic activity reported for BY-2 cell lysates compared to plant extracts [Citation28,Citation38,Citation67,Citation68]. Interestingly, VisA-anti-CD64 extracted from PCPs, purified by Protein L chromatography and stored at 4°C lost ~ 90% of the intact form after 3 days (72 h) of storage, whereas losses were only 50% at 37°C during the same incubation period (). Whereas the initial residual protease concentration was identical in both samples, plant proteases can exhibit (local) activity maxima at ~ 37°C [Citation69], but also at temperatures as low as ~ 4°C [Citation70]. However, which proteases were responsible here is currently unknown and will require further analysis. Additionally, we think that a cold-induced denaturation of the RIT, as reported for other proteins [Citation71], may have contributed to the reduced product concentration at 4°C compared to 37°C. Furthermore, buffer incompatibility could be a reason and could be optimized in the future.
In any case, the high temperature stability of VisA-anti-CD64 at 37°C was longer than the half-life of 60 min reported for scFv-based RITs in the blood after injection [Citation14].
Long-term storage tests at −20°C indicated that the addition of 10% (v v−1) glycerol to the VisA-anti-CD64 did not affect its stability (p = 0.665, α = 0.05; ). Furthermore, there was no indication of product loss induced by freezing because stability remained at ~ 100% during the first 3 d after storage. However, only 20% of intact VisA-anti-CD64 was recovered after 150 days, and the product was completely inactive after 365 days of storage at −20°C. These results indicated that VisA-anti-CD64 prepared using our current method can be stored for about a week at 37°C or better at −20°C without substantial loss of stability, but alternative methods such as lyophilization and the use of alternative cryo-protectants such as arginine or mannitol should be tested to improve the shelf life of plant-made RITs to facilitate extended testing, such as in vivo toxicology tests and ultimately clinical trials [Citation72], which typically last for 540–720 days in the case of leukemia therapeutics [Citation73,Citation74]. Improving the purification process could help to increase product stability by removing residual host cell proteins, including proteases. For example, this can be achieved by using protein L resins that allow a gentle elution at a pH above 2.5 or the use of an orthogonal second purification step.
Cytotoxicity assessment of VisA-anti-CD64
We determined the cytotoxicity of ER-targeted VisA-anti-CD64 purified from pPCPs against the three CD64+ human AML cell lines MonoMac-I, THP-I and HL-60, as well as the CD64– Burkitt’s lymphoma cell line Ramos as a negative control [Citation75,Citation76]. We ensured that CD64 was present on the AML cells by inducing the expression of the receptor with TNFα. The cytokine did not affect CD64 levels on MonoMac-I and THP-I cells (both cell lines expressed the receptor even in the absence of TNFα according to our flow cytometry data), whereas HL-60 cells required at least 400 U mL−1 TNFα to produce CD64 ().
As expected, CD64 was not found on Ramos cells nor was it induced by TNFα. Ramos cell viability was not affected by VisA-anti-CD64 (), confirming its lack of nonspecific cytotoxicity. In contrast, the viability of all CD64+ cell lines fell by ~ 25% when exposed to 1 µM (~56 mg L−1) or more of VisA-anti-CD64. These results indicated that plants can be used manufacture functional scFv-based RITs for the targeted treatment of leukemia. On one hand, the potency of VisA-anti-CD64 was comparable to that of other RIT candidates (in the 1.3–2.5 µM range), whereas a potency of ~0.2 µM was reported for a CD64-targeting RIT on THP-I cells [Citation47]. On the other hand, ADCs often have relative IC50 values in the nM range [Citation77], but these molecules use bivalent mAbs for cell targeting which increases the avidity compared to our monovalent scFv-based VisA-anti-CD64. Accordingly, we will improve the targeting of our RIT by both maturing the affinity of the antibody (fragment) toward CD64, for example by multisite-directed mutagenesis [Citation78] or phage display [Citation79], and by replacing the scFv domain with an antibody heavy or light chain that will be co-expressed with the complementary chain to form a mAb-based RIT. Because CD64 and CD89 are co-localized on monocytic myeloid cells [Citation11,Citation80], using bivalent antibodies specific for both receptors could further increase selectivity and reduce side effects [Citation11]. In addition, the potency of RITs, and thus their toxicity toward leukemia cells, can be improved by modifying the linker sequence or by adding efficient translocation domains that increase endosomal escape rates [Citation14,Citation45,Citation81]. Including multiple domains of the same or different toxins may also increase efficacy and/or potency [Citation14]. We will test all such modifications in our high-throughput PCP platform in a follow-up study.
Interestingly, we found a linear correlation between the CD64 cell surface presentation and relative IC50 values of the RIT treatment (Pearson’s r = −0.99, R2 = 0.98), indicating that the potency of VisA-anti-CD64 was dependent on both the concentration of the RIT and the receptor density (). A similar linear correlation between CD64 surface presentation and the cytotoxic effect of immunotoxins targeting CD64 (R2 >0.89) was previously reported in patient-derived AML cells even though ex vivo marker expression is inconsistent among human patients [Citation76]. Receptor concentrations can vary between patients [Citation11,Citation76], so we will use patient-derived cells in the future to assess the activity of our RITs.
The moderate efficacy we achieved was partially due to the slow internalization of CD64 and the VisA-anti-CD64 bound to it, which would limit RIT uptake (especially once all available receptors are occupied by the RIT) and thus the effective intracellular toxin concentration. The half-life of receptor recycling can exceed 5 min [Citation82], although a recycling rate of ~ 30% after 120 min was reported for a CD5-mAb complex in human leukemia CEM cells [Citation83]. Such information is not available for the AML cell lines we used as in vitro models. The Fc receptor CD64 binds IgG-type antibodies, which are then internalized by receptor-mediated endocytosis. During native CD64 recycling, the receptor first releases attached ligands in late endosomes and is then rapidly transported back to the cell surface [Citation84]. Because RITs may not dissociate easily from CD64 due to their high affinity, the entire RIT-CD64 complex may be recycled to the cell surface [Citation83], or could undergo proteolysis as observed for CD markers such as CD64 cross-linked with antibodies [Citation85]. Such proteolysis would effectively reduce the concentration of CD64 on the cell surface after RIT treatment. Further analysis of the marker recycling rate in AML cells after RIT treatment will therefore help to determine which current bottlenecks limit the efficacy and potency of the recombinant protein. These results can then be matched against CD64 concentrations and recycling rates on the surface of cells from primary patient material to optimize RIT administration, such as the prolonged multi-dose application as shown for an anti-HER2 immuno-RNase in xenograft mouse models [Citation86]. This is especially relevant because subpopulations of AML cells carry no CD64 on their surface, as shown for < 1% of cells in vitro and ~ 30–70% of cells derived from primary patient material [Citation76]. The presence of such subpopulations may explain the emergence of drug resistance after ADC treatment [Citation87–89], which can be addressed by the use of bispecific RITs as discussed above.
Conclusions and outlook
For the first time, we have used PCP-based screening to produce RIT variants by domain exchange or swapping, showing that the system can be used to rapidly identify and optimize relevant product candidates even when expressing toxic fusion proteins. We were able to increase recombinant protein levels from ~7 mg kg−1 (previously reported for a toxin) to ~40 mg kg−1 for RITs that accumulated in an intact form in various subcellular compartments (Figure S6). We then successfully scaled up production to pPCPs and intact plants, highlighting the translatability of the approach. A DoE was used to optimize single-step purification by chromatography, achieving a high recovery and purities of > 95%, allowing us to use the RIT for subsequent stability and activity testing. The most promising toxic fusion protein was successfully tested on AML model cell lines, revealing relative IC50 values of ~1.5 µM, which are acceptable for this proof-of-concept study.
In the future, we will test additional antibody domains (e.g. full-length and bi-specifics), toxins and linkers to improve both the efficacy and potency of the RITs. One bottleneck of plant-derived RITs are the low yields which need to be further improved in subsequent experiments. We will also augment the activity testing by including primary patient material in addition to AML cell lines. Once the corresponding candidate manufacturing and activity data become available, we will also perform a preliminary cost calculation to estimate the healthcare benefits. RITs are promising additions to the arsenal of anti-cancer drugs, circumventing some of the limitations of ADC manufacturing.
Abbreviations
| 35SS | = | double enhanced cauliflower mosaic virus promoter |
| AML | = | acute monocytic leukemia |
| ANOVA | = | analysis of variance |
| BY-2 | = | Bright Yellow 2 |
| DSP | = | downstream processing |
| ER | = | endoplasmic reticulum |
| ETA | = | truncated exotoxin A from Pseudomonas aeruginosa |
| LD50 | = | median lethal dose |
| MMCO | = | molecular mass cut-off |
| nt | = | nucleotide(s) |
| OD | = | optical density |
| PCP | = | plant cell pack |
| pPCP | = | preparative plant cell pack |
| SD | = | standard deviation |
| RIT | = | recombinant immunotoxin |
| LDS | = | lithium dodecylsulfate |
| mAb | = | monoclonal antibody |
| TSP | = | total soluble protein |
| USP | = | upstream production |
| UTR | = | untranslated region |
| VisA | = | Viscumin subunit A |
| XTT | = | 2,3-bis-(2-methoxy-4-nitro-5-sulfophenyl)-2 H-tetrazolium-5-carboxanilide. |
Author contributions
MK planned and conducted the experiments, analyzed the data and wrote the manuscript. KMF performed some of the chromatography optimization experiments and LK cloned the ETA′-based RIT expression plasmids. JFB supervised the experiments, evaluated the data, revised the manuscript and secured project funding.
Supplemental Material
Download PDF (1.1 MB)Acknowledgments
We thank Dr. Richard M. Twyman for manuscript editing. We thank Patrick Opdensteinen for providing the pTRAc plant expression plasmid library and Andreas Wagner for cultivating the plants. We thank Benjamin Gengenbach for providing plasmids carrying the VisA sequences, Christina Dickmeis for providing the mCherry sequence, and Alexander Croon for supplying the TA-5 anti-VisA antibody. We thank Reinhard Rosinke for support during the in vitro work and for providing ETA′ control samples.
Disclosure statement
No potential conflict of interest was reported by the authors.
Data availability statement
The data that support the findings of this study are available from the corresponding author upon reasonable request.
Supplemental material
Supplemental data for this article can be accessed online at https://doi.org/10.1080/21655979.2023.2244235
Additional information
Funding
References
- Itzykson R, Fenaux P, Bowen D, et al. Diagnosis and treatment of chronic myelomonocytic leukemias in adults: recommendations from the European hematology association and the European LeukemiaNet. Hemasphere. 2018;2(6):e150–432. doi: 10.1097/HS9.0000000000000150
- Bennett JM. Chronic myelomonocytic leukemia. Curr Treat Options Oncol. 2002;3(3):221–223. doi: 10.1007/s11864-002-0011-6
- Liapis K, Kotsianidis I. Approaching first-line treatment in patients with advanced CMML: hypomethylating agents or cytotoxic treatment? Front Oncol. 2021;11:11. doi: 10.3389/fonc.2021.801524
- Allahyari H, Heidari S, Ghamgosha M, et al. Immunotoxin: A new tool for cancer therapy. Tumour Biol. 2017;39(2):392. doi: 10.1177/1010428317692226
- Yong SB, Chung JY, Kim SS, et al. CD64-targeted HO-1 RNA interference enhances chemosensitivity in orthotopic model of acute myeloid leukemia and patient-derived bone marrow cells. Biomaterials. 2020;230:119651. doi: 10.1016/j.biomaterials.2019.119651
- Anderson CL. Isolation of the receptor for IgG from a human monocyte cell line (U937) and from human peripheral blood monocytes. J Exp Med. 1982;156(6):1794–1806. doi: 10.1084/jem.156.6.1794
- Liu M, Weng X, Gong S, et al. Flow cytometric analysis of CD64 expression pattern and density in the diagnosis of acute promyelocytic leukemia: a multi-center study in Shanghai, China. Oncotarget. 2017;8(46):80625–80637. doi: 10.18632/oncotarget.20814
- Tur MK, Huhn M, Jost E, et al. In vivo efficacy of the recombinant anti-CD64 immunotoxin H22(scFv)-ETA′ in a human acute myeloid leukemia xenograft tumor model. Int J Cancer. 2011;129(5):1277–1282. doi: 10.1002/ijc.25766
- Izumi Y, Kanayama M, Shen Z, et al. An antibody-drug conjugate that selectively targets human monocyte progenitors for anti-cancer therapy. Front Immunol. 2021;12:618081–618081. doi: 10.3389/fimmu.2021.618081
- Gresch G, Schenke L, Mladenov R, et al. Elimination of different leukaemia subtypes using novel CD89-specific human cytolytic fusion proteins. Br J Haematol. 2018;183(2):313–317. doi: 10.1111/bjh.14971
- Mladenov R, Hristodorov D, Cremer C, et al. The Fc-alpha receptor is a new target antigen for immunotherapy of myeloid leukemia. Int J Cancer. 2015;137(11):2729–2738. doi: 10.1002/ijc.29628
- Kaplon H, Chenoweth A, Crescioli S, et al. Antibodies to watch in 2022. MAbs. 2022;14(1):2014296. doi: 10.1080/19420862.2021.2014296
- Walsh G. Biopharmaceutical benchmarks 2018. Nature Biotechnol. 2018;36(12):1136. doi: 10.1038/nbt.4305
- Knödler M, Buyel JF. Plant-made immunotoxin building blocks: A roadmap for producing therapeutic antibody-toxin fusions. Biotechnol Adv. 2021;47:107683. doi: 10.1016/j.biotechadv.2020.107683
- Salehinia J, Sadeghi HM, Abedi D, et al. Improvement of solubility and refolding of an anti-human epidermal growth factor receptor 2 single-chain antibody fragment inclusion bodies. Res Pharma Sci. 2018;13(6):566–574. doi: 10.4103/1735-5362.245968
- Tran M, Van C, Barrera DJ, et al. Production of unique immunotoxin cancer therapeutics in algal chloroplasts. Proc Natl Acad Sci, USA. 2013;110(1):E15–22. doi: 10.1073/pnas.1214638110
- Francisco JA, Gawlak SL, Miller M, et al. Expression and characterization of bryodin 1 and a bryodin 1-based single-chain immunotoxin from tobacco cell culture. Bioconjugate Chem. 1997;8(5):708–713. doi: 10.1021/bc970107k
- Castilho A, Windwarder M, Gattinger P, et al. Proteolytic and N-glycan processing of human α1-antitrypsin expressed in Nicotiana benthamiana. Plant Physiol. 2014;166(4):1839–1851. doi: 10.1104/pp.114.250720
- Ma JK-C, Drossard J, Lewis D, et al. Regulatory approval and a first-in-human phase I clinical trial of a monoclonal antibody produced in transgenic tobacco plants. Plant Biotechnol J. 2015;13(8):1106–1120. doi: 10.1111/pbi.12416
- Rup B, Alon S, Amit-Cohen B-C, et al. Immunogenicity of glycans on biotherapeutic drugs produced in plant expression systems—The taliglucerase alfa story. Public Libr Sci One. 2017;12(10):e0186211–e0186211. doi: 10.1371/journal.pone.0186211
- Jansing J, Sack M, Augustine SM, et al. Crispr/cas9-mediated knockout of six glycosyltransferase genes in Nicotiana benthamiana for the production of recombinant proteins lacking β-1,2-xylose and core α-1,3-fucose. Plant Biotechnol J. 2019;17(2):350–361. doi: 10.1111/pbi.12981
- Buyel JF. Plants as sources of natural and recombinant anti-cancer agents. Biotechnol Adv. 2018;36(2):506–520. doi: 10.1016/j.biotechadv.2018.02.002
- Shoji Y, Farrance CE, Yusibov V. A plant‐based system for rapid production of influenza vaccine antigens. Influenza Other Resp Viruses. 2012;6(3):204–210. doi: 10.1111/j.1750-2659.2011.00295.x
- Buyel JF, Twyman R, Fischer R. Very-large-scale production of antibodies in plants: The biologization of manufacturing. Biotechnol Adv. 2017;35(4):458–465. doi: 10.1016/j.biotechadv.2017.03.011
- Commandeur U, Twyman RM. Biosafety aspects of molecular farming in plants. Mol Farming. 2004;251–266. doi: 10.1002/3527603638.ch16
- Buyel JF. Plant molecular farming - integration and exploitation of side streams to achieve sustainable biomanufacturing. Front Plant Sci. 2019;9:1893–1893. doi: 10.3389/fpls.2018.01893
- Charland N, Gobeil P, Pillet S, et al. Safety and immunogenicity of an AS03-adjuvanted plant-based SARS-CoV-2 vaccine in adults with and without comorbidities. npj vaccines. NPJ Vaccines. 2022;7(1):142. doi: 10.1038/s41541-022-00561-2
- Gengenbach BB, Opdensteinen P, Buyel JF. Robot cookies – plant cell packs as an automated high-throughput screening platform based on transient expression. Front Bioeng Biotechnol. 2020;8:8(393. doi: 10.3389/fbioe.2020.00393
- Premsukh A, Lavoie JM, Cizeau J, et al. Development of a GMP Phase III purification process for VB4-845, an immunotoxin expressed in E. coli using high cell density fermentation. Protein Expr Purif. 2011;78(1):27–37. doi: 10.1016/j.pep.2011.03.009
- Knödler M. Development and plant-based expression of recombinant immunotoxins for the targeted treatment of myelomonocytic leukemia. Aachen, Germany: RWTH Aachen University: Veröffentlicht auf dem Publikationsserver der RWTH Aachen University; 2023. p. 155.
- Knödler M, Reunious PW, Buyel JF. Risk assessment and bioburden evaluation of Agrobacterium tumefaciens-mediated transient protein expression in plants using the CaMV35S promoter. BMC Biotechnol. 2023;23(1):14. doi: 10.1186/s12896-023-00782-w
- Buyel FJ, Kaever T, Buyel J, et al. Predictive models for the accumulation of a fluorescent marker protein in tobacco leaves according to the promoter/5′UTR combination. Biotechnol Bioeng. 2013;110(2):471–483. doi: 10.1002/bit.24715
- Knödler M, Opdensteinen P, Sankaranarayanan RA, et al. Simple plant-based production and purification of the assembled human ferritin heavy chain as a nanocarrier for tumor-targeted drug delivery and bioimaging in cancer therapy. Biotechnol Bioeng. 2023;120(4):1038–1054. doi: 10.1002/bit.28312
- Knödler M, Rühl C, Emonts J, et al. Seasonal weather changes affect the yield and quality of recombinant proteins produced in transgenic tobacco plants in a greenhouse setting. Front Plant Sci. 2019;10(1245). doi: 10.3389/fpls.2019.01245
- Knödler M, Rühl C, Opdensteinen P, et al. Activated cross-linked agarose for the rapid development of affinity chromatography resins - antibody capture as a case study. J Visualized Exp. 2019;(150):e59933. doi: 10.3791/59933-v
- Leuzinger K, Dent M, Hurtado J, et al. Efficient Agroinfiltration of plants for high-level transient expression of recombinant proteins. J Visualized Exp. 2013;2013(77):e50521. doi: 10.3791/50521-v
- Buyel JF, Gruchow M, Fischer R. Depth filters containing diatomite achieve more efficient particle retention than filters solely containing cellulose fibers. Front Plant Sci. 2015;6(1134). doi: 10.3389/fpls.2015.01134
- Opdensteinen P, Meyer S, Buyel JF. Nicotiana spp. for the expression and purification of functional IgG3 antibodies directed against the Staphylococcus aureus alpha toxin. Front Chem Eng. 2021;3(50). doi: 10.3389/fceng.2021.737010
- Buyel JF, Fischer R. Characterization of complex systems using the design of experiments approach: transient protein expression in tobacco as a case study. J Visualized Exp. 2014;2014(83):51216. doi: 10.3791/51216
- Gengenbach BB, Keil LL, Opdensteinen P, et al. Comparison of microbial and transient expression (tobacco plants and plant-cell packs) for the production and purification of the anticancer mistletoe lectin viscumin. Biotechnol Bioeng. 2019;116(9):2236–2249. doi: 10.1002/bit.27076
- Marshall RS, D’Avila F, Di Cola A, et al. Signal peptide-regulated toxicity of a plant ribosome-inactivating protein during cell stress. Plant J. 2011;65(2):218–229. doi: 10.1111/j.1365-313X.2010.04413.x
- Brunelle JL, Green R. Chapter thirteen - coomassie blue staining. In: Lorsch J, editor. Methods in enzymology. Academic Press; 2014. pp. 161–167. doi: 10.1016/B978-0-12-420119-4.00013-6
- Song J, Tan H, Perry AJ, et al. PROSPER: an integrated feature-based tool for predicting protease substrate cleavage sites. PLoS One. 2012;7(11):e50300. doi: 10.1371/journal.pone.0050300
- Niemer M, Mehofer U, Verdianz M, et al. Nicotiana benthamiana cathepsin B displays distinct enzymatic features which differ from its human relative and aleurain-like protease. Biochimie. 2016;122:119–125. doi: 10.1016/j.biochi.2015.06.017
- Mohammed AF, Abdul-Wahid A, Huang EH-B, et al. The Pseudomonas aeruginosa exotoxin a translocation domain facilitates the routing of CPP–protein cargos to the cytosol of eukaryotic cells. JControlled Release. 2012;164(1):58–64. doi: 10.1016/j.jconrel.2012.10.006
- Opdensteinen P, Dietz SJ, Gengenbach BB, et al. Expression of biofilm-degrading enzymes in plants and automated high-throughput activity screening using experimental Bacillus subtilis biofilms. Front Bioeng Biotechnol. 2021;9(714). doi: 10.3389/fbioe.2021.708150
- Jiemy WF, Hiew LF, Sha HX, et al. Evaluation of Hydra HALT-1 as a toxin moiety for recombinant immunotoxin. Biomed Central Biotechnol. 2020;20(1):31–31. doi: 10.1186/s12896-020-00628-9
- Antignani A, Fitzgerald D. Immunotoxins: the role of the toxin. Toxins (Basel). 2013;5(8):1486–1502. doi: 10.3390/toxins5081486
- Foran JM. Targeted therapy of acute myeloid leukemia in 2012: towards individualized therapy. Hematology. 2012;17 Suppl 1(sup1):S137–40. doi: 10.1179/102453312X13336169156456
- Rademacher T, Sack M, Blessing D, et al. Plant cell packs: a scalable platform for recombinant protein production and metabolic engineering. Plant Biotechnol J. 2019;17:1–7.
- Stirpe F, Barbieri L, Battelli MG, et al. Ribosome–inactivating proteins from plants: Present status and future prospects. Bio/Technology. 1992;10(4):405–412. doi: 10.1038/nbt0492-405
- Glockshuber R, Schmidt T, Plückthun A. The disulfide bonds in antibody variable domains: effects on stability, folding in vitro, and functional expression in Escherichia coli. Biochemistry. 1992;31(5):1270–1279. doi: 10.1021/bi00120a002
- Gąciarz A, Ruddock LW, Riggs PD. Complementarity determining regions and frameworks contribute to the disulfide bond independent folding of intrinsically stable scFv. PLoS One. 2017;12(12):e0189964. doi: 10.1371/journal.pone.0189964
- Wörn A, Plückthun A. An intrinsically stable antibody scFv fragment can tolerate the loss of both disulfide bonds and fold correctly. Fed Eur Biochem Soc Lett. 1998;427(3):357–361. doi: 10.1016/S0014-5793(98)00463-3
- Jackson MA, Nutt KA, Hassall R, et al. Comparative efficiency of subcellular targeting signals for expression of a toxic protein in sugarcane. Funct Plant Biol. 2010;37(8):785–793. doi: 10.1071/FP09243
- De Muynck B, Navarre C, Boutry M. Production of antibodies in plants: status after twenty years. Plant Biotechnol J. 2010;8(5):529–563. doi: 10.1111/j.1467-7652.2009.00494.x
- Vanyushin BF, Bakeeva LE, Zamyatnina VA, et al. Apoptosis in plants: specific features of plant apoptotic cells and effect of various factors and agents. Int Rev Cytol. 2004;233:135–179. doi: 10.1016/S0074-7696(04)33004-4
- Dunphy CH, Tang W. The value of CD64 expression in distinguishing acute myeloid leukemia with monocytic differentiation from other subtypes of acute myeloid leukemia: a flow cytometric analysis of 64 cases. Arch Pathol Lab Med. 2007;131(5):748–754. doi: 10.5858/2007-131-748-TVOCEI
- Buyel JF, Twyman RM, Fischer R. Extraction and downstream processing of plant-derived recombinant proteins. Biotechnol Adv. 2015;33(6):902–913. doi: 10.1016/j.biotechadv.2015.04.010
- Buyel JF. Strategies for efficient and sustainable protein extraction and purification from plant tissues. Methods Mol Biol. 2022;2480:127–145.
- Buyel JF, Fischer R. Scale-down models to optimize a filter train for the downstream purification of recombinant pharmaceutical proteins produced in tobacco leaves. Biotechnol J. 2014;9(3):415–425. doi: 10.1002/biot.201300369
- Rühl C, Knödler M, Opdensteinen P, et al. A linear epitope coupled to DsRed provides an affinity ligand for the capture of monoclonal antibodies. J Chromatogr A. 2018;1571:55–64. doi: 10.1016/j.chroma.2018.08.014
- Khanal O, Singh N, Traylor SJ, et al. Contributions of depth filter components to protein adsorption in bioprocessing. Biotechnol Bioeng. 2018;115(8):1938–1948. doi: 10.1002/bit.26707
- Wang Y, Wang Y, Wang Y. Apoplastic proteases: Powerful weapons against pathogen infection in plants. Plant Commun. 2020;1(4):100085. doi: 10.1016/j.xplc.2020.100085
- Diaz-Mendoza M, Velasco-Arroyo B, Santamaria ME, et al. Plant senescence and proteolysis: two processes with one destiny. Genet Mol Biol. 2016;39(3):329–338. doi: 10.1590/1678-4685-GMB-2016-0015
- Menzel S, Holland T, Boes A, et al. Optimized blanching reduces the host cell protein content and substantially enhances the recovery and stability of two plant-derived malaria vaccine candidates. Front Plant Sci. 2016;7(159):1–7. doi: 10.3389/fpls.2016.00159
- Hehle VK, Paul MJ, Drake PM, et al. Antibody degradation in tobacco plants: a predominantly apoplastic process. BioMed Central Biotechnol. 2011;11(1):128. doi: 10.1186/1472-6750-11-128
- Donini M, DiMicco P, Lonoce C. Antibody proteolysis: a common picture emerging from plants. Bioengineered. 2015;6(5):299–302. doi: 10.1080/21655979.2015.1067740
- Kar M, Mishra D. Protease activity during rice leaf senescence. Biol Plant. 1977;19(5):365–369. doi: 10.1007/BF02922733
- Banik S, Biswas S, Karmakar S. Extraction, purification, and activity of protease from the leaves of Moringa oleifera [version 1; peer review: 2 approved, 1 approved with reservations]. F1000Res. 2018;7(1151). doi: 10.12688/f1000research.15642.1
- Privalov PL. Cold denaturation of protein. Crit Rev Biochem Mol Biol. 1990;25(4):281–306. doi: 10.3109/10409239009090612
- O’Fágáin C. Storage and lyophilisation of pure proteins. Methods Mol Biol. 2011;681:179–202.
- Committee for Medicinal Products for Human Use (CHMP); Assessment report, BLENREP, International non-proprietary name: belantamab mafodotin, Procedure No. EMEA/H/C/004935/0000. European Medicines Agency, 23 July 2020.
- Capen R, Christopher D, Forenzo P, et al. Evaluating current practices in shelf life estimation. J Am Assoc Pharm Sci. 2018;19(2):668–680. doi: 10.1208/s12249-017-0880-4
- Hristodorov D, Mladenov R, Pardo A, et al. Microtubule-associated protein tau facilitates the targeted killing of proliferating cancer cells in vitro and in a xenograft mouse tumour model in vivo. Br J Cancer. 2013;109(6):1570–1578. doi: 10.1038/bjc.2013.457
- Mladenov R, Hristodorov D, Cremer C, et al. CD64-directed microtubule associated protein tau kills leukemic blasts ex vivo. Oncotarget. 2016;7(41):67166–67174. DOI:10.18632/oncotarget.11568
- Chiang Z-C, Chiu Y-K, Lee C-C, et al. Preparation and characterization of antibody-drug conjugates acting on HER2-positive cancer cells. PLoS One. 2020;15(9):e0239813. doi: 10.1371/journal.pone.0239813
- Kim HY, Stojadinovic A, Izadjoo MJ. Affinity maturation of monoclonal antibodies by multi-site-directed mutagenesis. Methods Mol Biol. 2014;1131:407–420.
- Hu D, Hu S, Wan W, et al. Effective optimization of antibody affinity by phage display integrated with high-throughput DNA synthesis and sequencing technologies. PLoS One. 2015;10(6):e0129125–e0129125. doi: 10.1371/journal.pone.0129125
- Chevailler A, Monteiro RC, Kubagawa H, et al. Immunofluorescence analysis of IgA binding by human mononuclear cells in blood and lymphoid tissue. J Immunol. 1989;142(7):2244–2249. DOI:10.4049/jimmunol.142.7.2244
- Chen X, Zaro JL, Shen W-C. Fusion protein linkers: Property, design and functionality. Adv Drug Delivery Rev. 2013;65(10):1357–1369. doi: 10.1016/j.addr.2012.09.039
- Jonker CTH, Deo C, Zager PJ, et al. Accurate measurement of fast endocytic recycling kinetics in real time. J Cell Sci. 2020;133(2.
- Ravel S, Colombatti M, Casellas P. Internalization and intracellular fate of anti-CD5 monoclonal antibody and anti-CD5 ricin A-chain immunotoxin in human leukemic T cells. Blood. 1992;79(6):1511–1517. doi: 10.1182/blood.V79.6.1511.1511
- Akinrinmade OA, Chetty S, Daramola AK, et al. CD64: An attractive immunotherapeutic target for M1-type macrophage mediated chronic inflammatory diseases. Biomedicines. 2017;5(4):56. doi: 10.3390/biomedicines5030056
- Harrison PT, Davis W, Norman JC, et al. Binding of monomeric immunoglobulin G triggers Fc gamma RI-mediated endocytosis. J Biol Chem. 1994;269(39):24396–24402. doi: 10.1016/S0021-9258(19)51097-3
- Borriello M, Laccetti P, Terrazzano G, et al. A novel fully human antitumour immunoRnase targeting ErbB2-positive tumours. Br J Cancer. 2011;104(11):1716–1723. doi: 10.1038/bjc.2011.146
- Pohlmann PR, Mayer IA, Mernaugh R. Resistance to trastuzumab in breast cancer. Clin Cancer Res. 2009;15(24):7479–7491. doi: 10.1158/1078-0432.CCR-09-0636
- Collins DM, Bossenmaier B, Kollmorgen G, et al. Acquired resistance to antibody-drug conjugates. Cancers. 2019;11(3):394. doi: 10.3390/cancers11030394
- Marcucci F, Caserta CA, Romeo E, et al. Antibody-drug conjugates (ADC) against cancer stem-like cells (CSC)—Is there still room for optimism? Front Oncol. 2019;9:9. doi: 10.3389/fonc.2019.00167