
Abstract
Herein we present evidence for the coexistence of a Mn-rich ferromagnetic (FM) state and a Mn-poor reentrant cluster glass state in bulk, polycrystalline, layered (Cr1−x,Mnx)2GeC samples, where x is varied between 0.01 and 0.1. The Mn-poor regions form a reentrant cluster glass state below ∼30 K. The Mn-rich regions become FM at Curie temperatures that increase with increasing Mn content. The interface coupling between these two regions gives rise to exchange anisotropy and a change in sign at 20 K resulting in, rarely observed, inverted hysteresis loops.
Keywords:
The Mn+1AXn (MAX) phases—where M is an early transition metal, A is an A group element—mostly from groups 13 and 14—and X is carbon and/or nitrogen and n=1 to 3—are a large (>60) family of thermodynamically stable nanolaminates, wherein Mn+1Xn layers are interleaved with layers of pure A, with the X atoms occupying the octahedral sites between the M layers.[Citation1] These phases, most of which were discovered by Nowotny et al.[Citation2] in the 1960s, have attracted much interest recently since some of them exhibit a unique combination of properties, such as high thermal stability, excellent thermal and electrical conductivities, together with excellent machinability,[Citation1,Citation3] fully reversible dislocation-based deformation,[Citation4] among other attributes.
Materials with inhomogeneities at the nanoscale are of fundamental interest as well as in applications. Disorder arises when the energy differences between the different ordered states is small.[Citation5] Furthermore, magnetically, the interplay of different coexisting states can give rise to exotic magnetic states. This interplay is particularly important in multilayered structures that, for the most part, are artificially produced.[Citation6]
With the substantial interest generated by magnetic multilayered structures and the importance of interfaces in these structures, the allure, and potential, of magnetic MAX phases, that are intrinsically nanolaminated, is obvious. The quest for magnetic MAX phases, led by Rosén and coworkers, is a few years old.[Citation7–11] Starting with a theoretical paper predicting the existence of a stable magnetic (Cr1−x,Mnx)2AlC compound, wherein nonmagnetic Cr layers, form an inherent structure of atomically thin, magnetic multilayers.[Citation7] In that paper, it was also suggested that the degree of disorder between the Cr and Mn atoms in the compound could be used to tune the sign and magnitude of their coupling. In subsequent papers, it was theoretically shown that the most promising MAX phases are ones in the Cr–Mn–A–C system, were A is Al, Ga or Ge.[Citation8–11] It was only recently, however, that Ingason et al., showed that (Cr1−x,Mnx)2GeC thin films were ferromagnetic (FM) with Curie temperatures, Tc that were higher than room temperature.[Citation10] Based on DC magnetization measurement, it was concluded that the Mn atoms were disordered. Nevertheless, from the first principle calculation, the energy difference between the FM-ordered state and antiferromagnetic (AFM) disordered state was quite small, suggesting that they could co-exist.[Citation7]
Coexistence of states with distinctly different magnetic behavior, especially at the nanoscale, often gives rise to intriguing phenomena due to complex interface exchange coupling. For example, the coexistence of ferrimagnetic (FI) and FM states results in zero field cooling, ZFC, exchange anisotropy,[Citation12] and the interplay of FM and spin glassy states gives rise to large exchange anisotropies.[Citation13] Another example is the coexistence of AFM and spin glass states in relaxor ferroelectrics.[Citation5]
Even more recently, in what has to be considered a notable triumph of ab initio calculations, the same team not only predicted, but also synthesized Mn2GaC and showed it to be FM at all temperatures <230 K.[Citation14] At 50 K, the saturation moment (at 5 T) was 0.29 μB per Mn atom and the remnant moment was 0.15 μB per Mn atom. Not surprisingly, and typical of thin FM films, the magnetic easy axis was shown to lie in the basal plane, where shape anisotropy is the dominant term in the anisotropy energy.[Citation14]
This discovery is noteworthy because, to date, Mn was not a member of the transition metals known to form MAX phases. The addition of this element to the MAX phase family and the fact that it can endow them with magnetic properties is an exciting development. It also represents the second magnetic MAX phase.
In both papers by Ingason et al., the measurements were carried out on epitaxial thin films and no results were shown for temperatures below 50 K. The goal of this work was to try and synthesize, for the first time, a bulk MAX phase, i.e. one that was not in thin film form, and study its response to magnetic fields to temperatures as low as 2 K. Very recently, Nakamura et al. reported on Mn-induced itinerant-electron ferromagnetism in Cr2GeC.[Citation15] The Curie temperature was found to be proportional to the Mn concentration and varied from 43 to 270 K. They also applied spin fluctuation theory to describe it.
Like Nakamura et al., our starting point was the (Cr1−x,Mnx)2GeC phase. To understand the physics behind the complex magnetic response observed herein, we focused on compositions with x≤ 0.1. The anticipated disordered structures are analogous to multilayers grown with different magnetic ordering such that interfaces between the various ordered states are established. Herein we present the evidence that the coexistence of Mn-rich and Mn-poor regions—that exhibit quite different magnetic states due to the aforementioned closeness in energies between the FM and AFM configurations—give rise to quite complex magnetic behavior.
The powders used herein were graphite (99.9%, Cr (99.5%), Ge (99.99%) (Research Institute for Nonferrous Metals) and Mn (99%) Aladdin Industrial Inc.) To obtain the (Cr1−x,Mnx)2GeC polycrystalline samples, with x=0.01, 0.02, 0.05 and 0.1 stoichiometric amounts were mixed in an agate mortar and sealed in evacuated quartz tubes, heated to 1100°C and held at that temperature for 48 h. After furnace cooling, the samples were ground, pelletized, cold isostatically pressed to a pressure of 160 MPa, re-sealed in evacuated quartz tubes and annealed again at 1200°C for another 72 h.
The samples were characterized with X-ray powder diffraction, XRD. DC magnetization measurements were performed with a quantum design superconducting quantum interference device. AC magnetization measurements were carried out on a quantum design physical property measurement system.
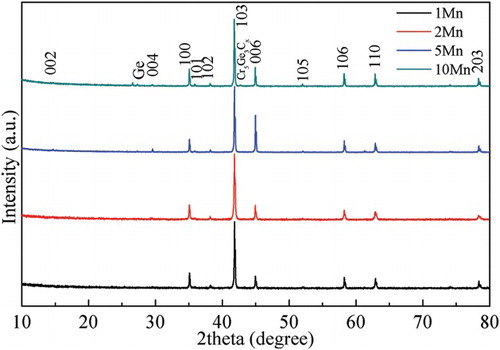
All major peaks in the XRD patterns of the as prepared samples belonged to the MAX phase (). For the x=0.1 sample, a few small peaks belonging to Cr5Ge3Cx were also observed (). The a- and c-lattice parameters are calculated to be 2.953 and 12.086 Å, respectively. These values are quite similar to those of pure Cr2GeC, with a- and c-lattice parameters of 2.954 and 12.08 Å, respectively.[Citation16] In accordance with the result of Ingason et al., the incorporation of Mn into Cr2GeC does not appear to affect the lattice parameters.[Citation10] In Nakamura el al.’s recent work,[Citation15] they found a nonlinear dependence of the lattice parameters on Mn content. For reasons that are unclear, however, their lattice constants in general, and those for pure Cr2GeC ( Å and
Å) in particular are significantly higher than the reported values for Cr2GeC (a∼2.95 Å, c∼12.08 Å),[Citation16] and our results.
Figure 1. XRD patterns of (Cr1−xMnx)2GeC samples with x=0.01, 0.02, 0.05 and 0.1, denoted in this and all other figures as 1 Mn, 2 Mn, 5 Mn and 10 Mn, respectively. For all compositions, all major peaks belong to (Cr1−xMnx)2GeC. For the x=0.1 sample, a few small peaks belonging to Cr5Ge3Cx and possibly graphite were also observed. Interestingly, no distinct peak shifts were observed as a function of composition.
The dependencies of the magnetization, M, on temperature and composition, under ZFC and field cooled (FC) modes in an applied field, of Am−1 are shown in (a). The x=0.01 sample shows a reentrant cluster glass-like transition at 32.7 K; with increasing Mn content, an additional higher temperature transition appears. For the x=0.02 and x=0.05 samples, two transitions are evident: one at low temperature identical to the x=0.01 sample, the others at ∼120 and at 286 K, respectively. For the x=0.1 sample, the higher temperature transition is observed at 320 K, the lower temperature transition is not observed, but the cluster glass transition is still present. It is important to note that the fact that Tc is a function of Mn content rules out the possibility that the signal is coming from a magnetic impurity phase that in principle would possess a Tc that was independent of composition. In this case, the increases in Tc with Mn content most probably reflect a stronger interaction between the Mn atoms as the average distance between them shrinks (compare (b) and 3(c)). In , the Mn moments are assumed to lie in the basal plane because they do so in Mn2GaC.[Citation14] The actual situation is most probably significantly more complicated.[Citation10] It is worth noting that although some theoretical calculation indicate that the undoped Cr2GeC may have an AFM ground state,[Citation17–19] Cr2GeC, like other MAX phases [Citation1] appears to be a typical Pauli paramagnetic solid.[Citation15]
Figure 2. (a) Temperature dependence of zero field, ZFC, and field cooled, FC, DC magnetization curves for (Cr1−x,Mnx)2GeC as a function of x. (b) Temperature dependence of zero field, ZFC, and field cooled, FC, DC magnetization curves for (Cr0.95,Mn0.05)2GeC as a function of cooling rate/quenching. The applied magnetic field was 5/4π 103 Am−1for (a) and (b). Inset in (b) shows the magnetization for (Cr0.95,Mn0.05)2GeC synthesized at 1000°C in an applied field of 5/4π 105 Am−1.
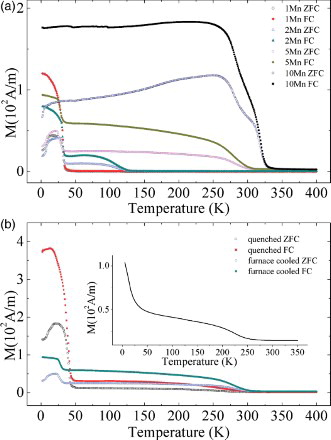
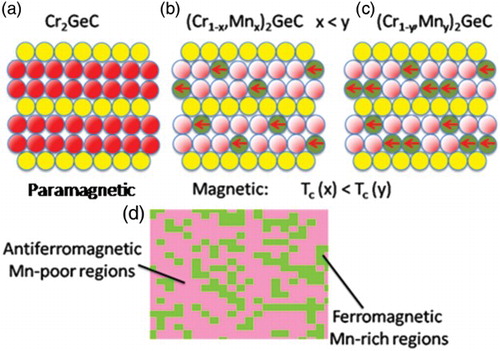
Figure 3. Schematic of magnetic structures inferred from the magnetic measurements and their temperature dependencies. (a) Paramagnetic Cr2GeC, where the Cr atoms are depicted in red, Ge atoms in yellow and the C-atoms are not shown. (b) Substitution of a few Cr atoms with Mn atoms (green). Pink atoms represent a matrix that is Mn-poor and AFM; (c) same as B but at a higher Mn concentration. (d) Top view of basal planes showing Mn clustering (green) within an AFM matrix (pink). In this schematic, which is not to scale, for the sake of clarity, the magnetic moments of the Mn atoms are assumed to lie in the basal planes.
To further check the validity of this conclusion, a sample with x=0.05, was quenched from 1100°C into water and its magnetization was measured. In this case, the high temperature Tc was significantly suppressed ((b)), confirming the importance of having a critical Mn concentration for the high temperature or Mn-rich FM transition. Noteworthy, and consistent with this interpretation, is the large increase in the spin glass signal observed after quenching ((b)).
What this result also strongly implies is a phase separation of the Mn atoms into Mn-rich and Mn-poor regions ((a) and (d)). The Mn-rich regions exhibit the higher ordering temperature that, as noted above, is a function of Mn content. The Mn-poor layer, on the other hand, orders at ≈30 K. Presumably, for the x=0.1 sample, the Mn content is larger than the percolation threshold which in turn results in the formation of a more homogeneous material that exhibits a single transition ((a)). At this time, the Mn segregation mechanism is unclear. First principles calculations indicate that the Mn–C–Mn configuration is energetically more favorable compared to the Mn–C–Cr configuration.[Citation10] Furthermore, given the continuous and gradual changes in lattice parameters of the solid solutions, it is not unreasonable to assume that spinodal decomposition is occurring. This comment notwithstanding, more work is needed to better understand this crucial experimental variable.
The importance of this variable, however, is manifested in the actual Tc values In the Nakamura et al. paper,[Citation15] the Tc values are lower than those presented herein. For example, their Tc at x=0.2 is 270 K; herein, Tc at the lower Mn loading of 0.1 is 320 K. The only apparent difference is the synthesis temperature. We also note that the synthesis temperature is essential for a higher Tc. For example a x=0.05 sample synthesized at 1000°C shows a transition at ∼224 K (inset of (b)). This fact may relate to the formation of Mn-rich regions at elevated temperature. In our own study when x≥ 0.2, a substantial amount of impurity, most probably (Mn1−xCrx)5Ge3, emerged and the diffraction pattern was identical to the impurity phase in of Ref. [Citation15]. The x=0.2 sample in our own work showed a sharp transition at 250 K. It is reasonable to conclude that the Mn containing intermetallic is responsible for the magnetism observed in the x>0.2 sample.
For both the 0.02 and 0.05 compositions, below the 32 K transition, the ZFC magnetization curve shows a broad maximum at ≈22 K. Cooling below 10 K results in a drop in magnetization ((a)), suggesting the existence of a spin cluster glass behavior at the lowest temperatures.[Citation20]
To investigate the nature of this low temperature transition, AC-susceptibility measurements for the x=0.05 sample were performed as a function of temperature from 3 to 350 K in an applied field of Am−1. The prominent frequency independent peak at 22.5 K ((a)) agrees well with the maximum in DC magnetization observed at ∼22 K. The small bulge at ∼60 K might be due to AFM coupling within the Mn-rich layers. This feature is a probably a consequence of the complex competition between FM and AFM ordering mentioned above. The existence of AFM coupling is consistent with the small saturation moment (0.31 μB per Mn atom at 2 K).
Figure 4. (a) Real components of ac magnetization as a function of temperature in an applied field of 5/4π 103 Am−1 as a function of frequencies shown in top right corner; (b) Real (right y-axis) and imaginary components (left y-axis) of AC magnetization as a function of temperature from 3 to 35 K in an applied field of 5/4π 103 Am−1 as a function frequencies shown in top right corner. (c) ln τ vs. ln (T′′f−TRCG)/TRCG. (d) Time dependence of normalized magnetization at 2 K after cooling the sample in a field of 500/4π 103 Am−1, removing the field and measuring the magnetization vs. time when the magnetic field reach zero. All measurements are performed on x=0.05 samples.
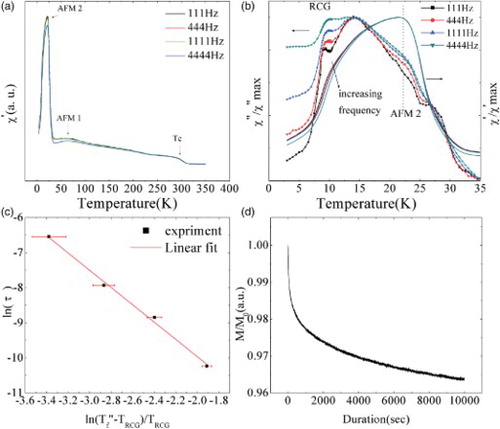
The functional dependencies of the real, χ′, (right y-axis) and imaginary, , (left y-axis) components of the AC susceptibility on frequency, in the 2–35 K temperature range, are shown in (b). Both values are normalized by their maximum values.
The shows a frequency-dependent maximum at around 10 K. Note that at 0.1 K, the temperature step used, when the results obtained between 8.5 and 10.5 K, were taken, was quite small. Said otherwise, the heating rate was particularly low.
(c) plots the relaxation times, τ, where τ equals to 1/2π f, and f the frequency of the applied field, versus Tf, where Tf is the temperature at which is a maximum, assuming, the following relationship:[Citation21]
is operative. First, we determined
K, which gives the best linear fit and then, from the linear fit of the results shown in (c), the dynamical critical exponent, zυ, was found to be 2.46±0.4, and the spin flipping time, τ0 was
s. This relatively large flipping time agrees well with other reentrant cluster glass system suggesting that the glassy nature is due to a cluster and not individual spins.[Citation22] (d) plots a typical relaxation curve at 2 K, of the magnetization, M (normalized by Mo, the magnetization at t=0 when the magnetic field is removed) after FC in a magnetic field of
Am−1. All these features are consistent with a cluster glass state at T<10 K.
Based on these results, it is reasonable to assume that upon cooling, some of the Mn atoms, residing on the Cr sites, form Mn-rich regions in a Mn-poor matrix ((d)). The former undergoes a paramagnetic to FM transition at a Tc that depends on the Mn concentration in that region. The Mn-poor matrix, on the other hand, undergoes a reentrant cluster glass transition at ∼30 K.
For all temperatures studied, and regardless of whether the sample was ZFC or FC, M did not saturate (e.g. (a)), indicating the presence of an AFM interaction, in accordance with our interpretation above.
Figure 5. (a) ZFC and FC hysteresis loops at 2 K. Inset shows enlarged view of the low field part. Exchange anisotropy and coercivity enhancements are evident; (b) Coercive field, HC, and exchange bias field, HEB, obtained from the hysteresis loops. The uncertainty should mainly come from remanence of the superconducting magnet which is smaller than the symbols’ size; (c) Reversed hysteresis loop obtained at 20 K. Arrows indicate the sweep direction. The arrows in the insets schematically indicate the magnetization reversal. (d) Normal hysteresis loop obtained at 10 K. All measurements were performed on x=0.05 samples.
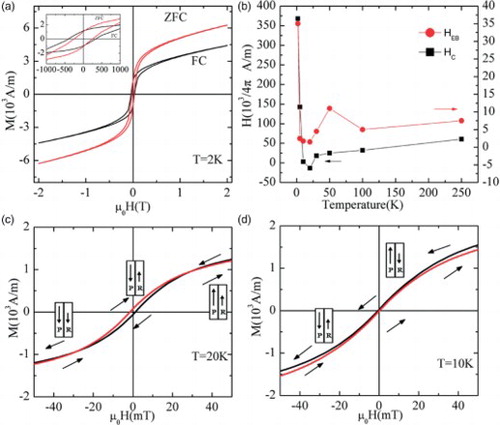
To study the exchange coupling, the DC magnetization was measured at different temperatures after cooling from 350 K in either ZFC or FC mode. The corresponding hysteresis loops at 2 K are shown in (a). The 2 K FC M-H loop exhibits a negative shift, whereas the ZFC M-H loop shows no shift (see inset in (a)). The exchange bias field, HEB and coercive fields, HC obtained from the hysteresis loops, at various temperatures, are shown in (b). Exchange anisotropy usually emerges as a result of coupling between FM–AFM, FM–FI or, as the case here, FM-spin glass states at the interface.[Citation23] According to the above phase transition interpretation, it is reasonable to conclude that coupling between the Mn-rich, FM regions and the reentrant cluster glass Mn-poor matrix gives rise to the exchange anisotropy. As discussed below, from 10 to 30 K, the exchange bias field, HEB, decreases greatly.
At 20 K, HC is negative since the hysteresis loops are inverted ((c)). Inverted hysteresis loops are rare in nature. Not coincidentally, they have been observed in exchange coupled multilayers.[Citation24–26] Such inverted loops are a consequence of the interplay of magnetization reversal and magneto-crystalline anisotropy.[Citation24] In other words, it is reasonable to assume that the interplay between Mn-rich regions and the reentrant cluster matrix is responsible for the inverted loops. The magnetization reversal mechanism is shown schematically in the insets shown in (c); those for the normal hysteresis loop in the insets shown in (d). For the 20 K hysteresis loop, the Mn-poor regions (P regions) reverse their magnetization first at positive fields, followed by the Mn-rich regions (R regions) at negative fields. For the 10 K, normal hysteresis loop, the reversal mechanism is different. It follows that the different magnetization reversal sequences of the Mn-rich regions (R regions) and the Mn-poor regions (P regions) or matrix, give rise to the inverted loops at 20 K and normal hysteresis loops at 10 K.
Since the degree of inhomogeneity is tunable—as shown by our quenching experiment, for example—the exchange anisotropy, in turn, can also be readily tuned. Thus as elucidated herein, (Cr1−xMnx)2GeC can be synthesized to be a homogeneous [Citation10] or an inhomogeneous complex system. Note that since the changes in the lattice parameters due to the incorporation of Mn in Cr2GeC are negligible, the introduction of various interfaces can be carried out with little, to no, lattice mismatches.
To summarize, the plethora of magnetic phenomena observed in (Cr1−xMnx)2GeC can be viewed as a consequence of the competition between intralayer FM and interlayer AFM order.[Citation10] The intricate competition between these two states could in principle be tuned by altering the interlayer distances. Considering the rich chemistry of the MAX phases, there will indubitably be more magnetic phases. If some of them happen to be M3AX2 or M4AX3, then the effect of varying the interlayer distances can be explored since the latter have larger c-lattice parameters than the M2AX phase studied herein. The c-lattice parameters of the M2AX, M3AX2 and M4AX4 are, respectively, of the order of 1.3, 1.8 and 2.3 nm.[Citation1] Accordingly, the aforementioned competition may result in new equilibrium states.
In addition to the discovery of Mn2GaC, two additional new exciting recent developments bode well for our ability to fine tune the FM–AFM competition. The first is the possibility of exfoliating the MAX phases themselves into nanosheets comprising a few MAX layers, which has been demonstrated in the Ti3Si1−xAlxC2 system.[Citation27] The second is the complete etching of the A-layers from in between the MX layers phases to form a totally new class of 2D materials labeled MXenes.[Citation28,Citation29] In the latter, the coupling between layers is quite weak. Based on the analysis outlined herein, it is reasonable to assume that both types of exfoliated layers would yield a multitude of quite interesting magnetic responses and tunabilities.
In conclusion, the introduction of nanoscale inhomogeneities in bulk polycrystalline (Cr1−xMnx)2GeC samples, wherein Mn-rich layers are embedded within a Mn-poor matrix, gives rise to complex magnetic behavior. The Mn-rich layers are FM and the Mn-poor matrix undergoes a reentrant cluster glass transition at low temperatures. Due to the varying magnetic states of the Mn-poor region, the coupling between the two phases results in exchange anisotropy, and inverted hysteresis loops at 20 K. The tunable coupling of the layered magnetic (Cr1−x,Mnx)2GeC and other magnetic MAX phases may be of great potential in spintronic applications.
Acknowledgements
We thank for the support of the ‘Chunlei’ program in Ningbo Institute of Material Technology and Engineering in China, Ningbo Natural Science Foundation (2013A610128) and National Natural Science Foundation of China (U1232136). QZT also thanks H.L. Yang from NIMTE for helpful discussion. MWB was partially funded by National Science Foundation (DMR-1310245). SL was funded by The National Natural Science Foundation of China (51301165).
References
- Barsoum MW. MAX phases: properties of machinable carbides and nitrides. Weinheim: Wiley VCH GmbH & Co.; 2013.
- Jeitschko W, Nowotny H, Benesovsky F. Kohlenstoffhaltige ternäre Verbindungen (V-Ge-C, Nb-Ga-C, Ta-Ga-C, Ta-Ge-C, Cr-Ga-C und Cr-Ge-C). Monatshefte für Chemie und verwandte Teile anderer Wissenschaften. 1963;94(5):844–850.
- Eklund P, Beckers M, Jansson U, Högberg H, Hultman L The Mn+1 AXn phases: materials science and thin-film processing. Thin Solid Films. 2010;518(8):1851–1878. doi: 10.1016/j.tsf.2009.07.184
- Barsoum M, Zhen T, Kalidindi S, Radovic M, Murugaiah A. Fully reversible, dislocation-based compressive deformation of Ti3SiC2 to 1 GPa. Nat Mater. 2003;2(2): 107–111. doi: 10.1038/nmat814
- Kleemann W, Shvartsman VV, Borisov P, Kania A. Coexistence of antiferromagnetic and spin cluster glass order in the magnetoelectric relaxor multiferroic PbFe0.5Nb0.5O3. Phys Rev Lett. 2010;105(25):257202. doi: 10.1103/PhysRevLett.105.257202
- Grunberg P, Schreiber R, Pang Y, Walz U, Brodsky M, Sowers H. Layered magnetic structures: evidence for antiferromagnetic coupling of Fe layers across Cr interlayers. J Appl Phys. 1987;61(8):3750–3752. doi: 10.1063/1.338656
- Dahlqvist M, Alling B, Abrikosov I, Rosén J. Magnetic nanoscale laminates with tunable exchange coupling from first principles. Phys Rev B. 2011;84(22):220403. doi: 10.1103/PhysRevB.84.220403
- Mockute A, Dahlqvist M, Emmerlich J, Hultman L, Schneider JM, Persson POÅ, Rosen J. Synthesis and ab initio calculations of nanolaminated (Cr,Mn)2AlC compounds. Phys Rev B. 2013;87(9):094113. doi: 10.1103/PhysRevB.87.094113
- Liu Z, Waki T, Tabata Y, Yuge K, Nakamura H, Watanabe I. Magnetic ground state of the Mjn+1AXn-phase nitride Cr2GaN. Phys Rev B. 2013;88(13):134401. doi: 10.1103/PhysRevB.88.134401
- Ingason AS, Mockute A, Dahlqvist M, Magnus F, Olafsson S, Arnalds UB, Rosen J. Magnetic self-organized atomic laminate from first principles and thin film synthesis. Phys Rev Lett. 2013;110(19):195502. doi: 10.1103/PhysRevLett.110.195502
- Jaouen M, Chartier P, Cabioc'h T, Mauchamp V, André G, Viret M. Invar like behavior of the Cr2AlC MAX phase at low temperature. J Am Ceram Soc. 2013;96(12): 3872–3876. doi: 10.1111/jace.12635
- Nayak AK, Nicklas M, Chadov S, Shekhar C, Skourski Y, Winterlik J, Felser C. Large zero-field cooled exchange-bias in bulk Mn2PtGa. Phys Rev Lett. 2013;110(12): 127204. doi: 10.1103/PhysRevLett.110.127204
- Ma L, Wang WH, Lu JB, Li JQ, Zhen CM, Hou DL, Wu GH. Coexistence of reentrant-spin-glass and ferromagnetic martensitic phases in the Mn2Ni1.6Sn0.4 Heusler alloy. Appl Phys Lett. 2011;99(18): 182507(3). 10.1063/1.3651767
- Ingason A, Petruhins A, Dahlqvist M, Magnus F, Mockute A, Alling B, Hultman L, Abrikosov IA, Persson POA, Rosen J. A nanolaminated magnetic phase: Mn2GaC. Mater Res Lett. 2014;2(2):89–93. doi: 10.1080/21663831.2013.865105
- Liu Z, Waki T, Tabata Y, Nakamura H. Mn-doping-induced itinerant-electron ferromagnetism in Cr2GeC. Phys Rev B. 2014;89(5):054435. doi: 10.1103/PhysRevB.89.054435
- Amini S, Zhou A, Gupta S, DeVillier A, Finkel P, Barsoum MW. Synthesis and elastic and mechanical properties of Cr2GeC. J Mater Res. 2008;23(8):2157–2165. doi: 10.1557/JMR.2008.0262
- Ramzan M, Lebègue S, Ahuja R. Electronic and mechanical properties of Cr2GeC with hybrid functional and correlation effects. Solid State Comm. 2012;152(13): 1147–1149. doi: 10.1016/j.ssc.2012.03.044
- Zhou W, Liu L, Wu P. First-principles study of structural, thermodynamic, elastic, and magnetic properties of Cr2GeC under pressure and temperature. J Appl Phys. 2009;106(3):033501. doi: 10.1063/1.3187912
- Mattesini M, Magnuson M. Electronic correlation effects in the Cr2GeC Mjn+1AXn phase. J Phys Condens Matter. 2013;25(3):035601. doi: 10.1088/0953-8984/25/3/035601
- Marcano N, Sal JG, Espeso J, Barquín LF, Paulsen C. Cluster-glass percolative scenario in CeNi1−x Cux studied by very low-temperature ac susceptibility and dc magnetization. Phys Rev B. 2007;76(22): 224419. doi: 10.1103/PhysRevB.76.224419
- Hohenberg PC, Halperin BI. Theory of dynamic critical phenomena. Rev Mod Phys. 1977;49(3):435–479. doi: 10.1103/RevModPhys.49.435
- Hanasaki N, Watanabe K, Ohtsuka T, Kézsmárki I, Iguchi S, Miyasaka S, Tokura Y. Nature of the transition between a ferromagnetic metal and a spin-glass insulator in pyrochlore molybdates. Phys Rev Lett. 2007;99(8):086401. doi: 10.1103/PhysRevLett.99.086401
- Ali M, Adie P, Marrows CH, Greig D, Hickey BJ, Stamps RL. Exchange bias using a spin glass. Nat Mater. 2006;6(1):70–75. doi: 10.1038/nmat1809
- Ziese M, Vrejoiu I, Hesse D. Inverted hysteresis and giant exchange bias in La0.7Sr0.3MnO3 SrRuO3 superlattices. Appl Phys Lett. 2010;97(5):052504(3). doi: 10.1063/1.3470101
- Dos Santos MC, Geshev J, Schmidt J, Teixeira S, Pereira L. Origin of the magnetization reversal of an Fe thin film on Si (111). Phys Rev B. 2000;61(2):1311. doi: 10.1103/PhysRevB.61.1311
- Valvidares S, Alvarez-Prado L, Martin J, Alameda J. Inverted hysteresis loops in magnetically coupled bilayers with uniaxial competing anisotropies: theory and experiments. Phys Rev B. 2001;64(13): 134423. doi: 10.1103/PhysRevB.64.134423
- Zhang X, Xu J, Wang H, Zhang J, Yan H, Pan B, Zhou J, Xie Y. Ultrathin nanosheets of MAX phases with enhanced thermal and mechanical properties in polymeric compositions: Ti3Si0.75Al0.25C2. Angew Chem Int Ed. 2013;52(16):4361–4365.
- Naguib M, Kurtoglu M, Presser V, Lu J, Niu J, Heon M, Hultman L, Gogotsi Y, Barsoum MW. Two-dimensional nanocrystals produced by exfoliation of Ti3AlC2. Adv Mater. 2011;23(37):4248–4253. doi: 10.1002/adma.201102306
- Naguib M, Mashtalir O, Carle J, Presser V, Lu J, Hultman L, Gogotsi Y, Barsoum MW. Two-dimensional transition metal carbides. ACS Nano. 2012;6:1322–1331. doi: 10.1021/nn204153h