
Abstract
Gradient structures are characterized with a systematic change in microstructures on a macroscopic scale. Here, we report that gradient structures in engineering materials such as metals produce an intrinsic synergetic strengthening, which is much higher than the sum of separate gradient layers. This is caused by macroscopic stress gradient and the bi-axial stress generated by mechanical incompatibility between different layers. This represents a new mechanism for strengthening that exploits the principles of both mechanics and materials science. It may provide for a novel strategy for designing material structures with superior properties.
A typical gradient structure is characterized with a microstructural gradient at a macroscopic scale.[Citation1] Gradient structures exist ubiquitously in the nature, because they have superior properties over homogenous structures to weather severe natural environments.[Citation1,Citation2,Citation3] One wonders if gradient structures would also benefit engineering materials made by mankind. Recently gradient structure was introduced into metals, producing excellent strength and ductility.[Citation4,Citation5,Citation6,Citation7] This is significant because strength and ductility are two of the most important, but often mutually exclusive, mechanical properties.[Citation8,Citation9,Citation10,Citation11,Citation12,Citation13,Citation14] For example, extensive research for the past three decades has produced ultrastrong nanocrystalline materials,[Citation15,Citation16,Citation17] but they usually have low ductility. Making materials both strong and ductile has been an enduring endeavor for materials scientists.[Citation8,Citation18,Citation19]
Here, we report that gradient structure in metals produces an intrinsic synergetic strengthening effect, with the strength of the gradient-structured (GS) sample much higher than the sum of the strength of separate layers, as calculated using the rule of mixture (ROM). The mechanisms for synergetic strengthening are macroscopic stress gradient and complex stress state caused by the gradient structure under uniaxial applied stress.
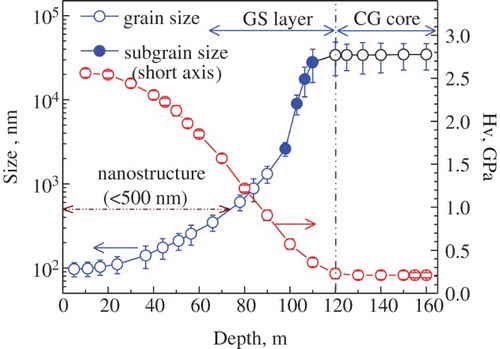
We produced the gradient structure in an interstitial-free (IF) steel using surface mechanical attrition treatment (SMAT).[Citation20,Citation21] The steel sample has a composition (wt%) of 0.003 C, 0.08 Mn, 0.009 Si, 0.008 S, 0.011 P, 0.037 Al, 0.063 Ti, and 38 ppm N. The samples were pre-annealed at 1173 K for 1 h to obtain a coarse-grained (CG) microstructure with a mean grain size around 35 μm. For the purpose of obtaining consistent gradient layers in terms of grain size distribution and layer depth, all samples were processed by SMAT for 5 min on both sides. Steel balls with a diameter of 3 mm were used to process the samples. The four sample thicknesses were selected and varied from 0.5, 1, 1.5 to 2 mm so that the volume fraction of the gradient layer was varied from 0.48, 0.3, and 0.24 to 0.16, respectively. For simplicity, such samples were defined as the integrated samples, which have a CG layer sandwiched between two GS layers. The change of the grain size and Vickers micro-hardness along the depth is shown in . The GS layers on both sides have a gradual grain size increase along the depth, with the sizes of grains, subgrains, and dislocation cells ranging from sub-micrometers to micrometers, which produces two gradient layers of thick each. All tensile samples were dog-bone-shaped with a gauge size of
. The tensile specimens of the gradient layer were prepared by polishing away the SMAT-processed samples from one side only (mechanically thinning to
thick at first using waterproof abrasive paper 600#, followed by electrochemical polishing to final 120 μm thick at
, leaving behind the layer of desired thickness for tensile testing. The tensile tests were at a quasi-static strain rate of
.
Figure 1. Variation of both grain sizes and Vickers microhardness (Hv) along the depth in samples processed by SMAT for 5 min.
(a) shows the engineering stress–strain curves of all integrated samples with varying volume fractions of GS layers. Shown also is the stress–strain curve of the 120-μm thick GS layer (GS-layer curve). As shown, with increasing volume fraction of the GS layer, the yield strength increased dramatically, while ductility (elongation to failure) decreased slowly, producing a good combination of strength and ductility.
Figure 2. (a) Engineering stress-strain curves of integrated samples, the GS layers, and the CG sample. The volume fractions of the GS layers in the integrated samples are indicated on the curves. (b) The flow stress of the integrated sample (red curve) is much higher than that calculated using ROM (green curve) due to synergetic strengthening. (c) The measured yield strength of the integrated samples (red curve), the calculated yield strength using the ROM (blue curve), and the calculated yield strength using the modified ROM (green curve). Inset is the synergetic strengthening, Δσ, as a function of the volume fractions of GS layers.
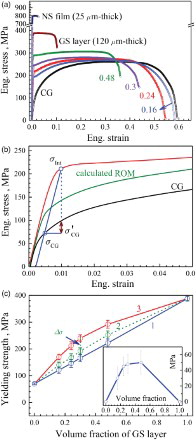
(b) demonstrates the synergetic high flow stress (red curve) of the integrated sample with GS volume fraction of 24%. The blue curve is calculated using the ROM:
However, as shown in (b), the integrated sample yielded at a much larger strain than the CG sample. In other words, the CG sample will have a flow stress of due to strain hardening, where
(c) demonstrates the synergetic strengthening of the gradient structure. The 0% volume fraction of the GS layer represents the pure CG sample, while the 100% GS layer represents the data point from the pure GS layer. The red line represents the yield strength of the integrated samples that consist of two GS layers and one CG central layer. It obviously shows a higher flow stress than the blue and green curves, which are calculated using Equations (2) and (3), respectively. Therefore, even with consideration of , the gradient structure still leads to a synergetic strengthening in the integrated sample.
Assuming one can slice the integrated sample into n thin layers along the thickness direction, and then separately measure their yield strength. The synergetic strengthening by the gradient structure may be calculated as
The synergetic strengthening as a function of the GS volume fraction is shown in the inset of (c). It reveals that an optimum GS volume fraction exists where synergetic strengthening is most significant.
The importance of the gradient structured layer in the synergetic strengthening is demonstrated in . Integrated samples with two 120-μm GS layers sandwiching a 760-μm CG layer were used to measure the synergetic strengthening, , as equal-thickness layers were removed from both surfaces. The engineering stress–strain curves of the integrated samples after removing varying thickness of surface layers are shown in (a). The legend indicates the layer thickness removed from both sides of the integrated samples.
Figure 3. (a) Tensile engineering stress-strain curves with surface layers removed from both sides of the integrated sample with initial 120-μ m-thick GS layers. The legend indicates the thickness reduction from both sides. (b) Synergetic strengthening calculated using Equation (4) as a function of surface layer thickness removed. (c) Variation of Vickers microhardness along the depth after tensile testing to a strain of 1%.
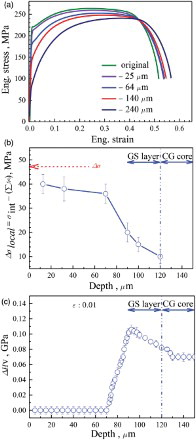
(b) shows that the synergetic strengthening becomes weaker and eventually disappear as the GS layers were gradually removed. This indicates the importance of the GS layers to the synergetic strengthening. To find out where the synergetic strengthening is from, an integrated sample was tested to a tensile strain of 1%, which corresponds to the 0.2% plastic strain and the change in microhardness was measured along the depth. As shown in (c), there is no change in microhardness for the surface layer of 70-μm deep, indicating that no dislocation accumulation occurred during the tensile testing. This suggests that the high strength surface layer was still deforming largely elastically at 1% tensile strain. Interestingly, there is a peak at the 90 μm depth. This is a very significant feature, which will be discussed later. (b) and 3(c) indicates that the fine-grained gradient layers are essential to the activation of synergetic strengthening, but the synergetic strengthening comes mostly from the CG layer.
The ROM has an inexplicit assumption: there is no synergetic or destructive interaction between different layers (components). Such a condition is not strictly met in most cases. However, when the interaction is weak, the ROM can be used to estimate effective yield strength.[Citation4,Citation22,Citation23] When the interaction between layers is strong, the ROM is inadequate in estimating the yield strength of the composite structure. Examples include the laminated structures of two dissimilar metals with very different mechanical properties as reported in [Citation24] and the gradient structured metals studied here. Both the laminated structure and the gradient structure have mechanical incompatibility during plastic deformation, which may produce complex stress state as well as the macroscopic stress and strain gradients as observed in this study. As observed in this study, the complex stress state and the strain and stress gradient will produce synergetic strengthening, i.e. additional strengthening in the gradient structure beyond the prediction of the ROM. The similarities between the laminated structure and the gradient structure make the laminated structure an ideal structure for studying some of the fundamental issues in the gradient structure. The gradient structure can be approximately regarded as consisting of many layers with systematic variation of microstructures and mechanical properties. The migrations of the elastic layer–plastic layer interfaces and the necking layer–stable layer interfaces present a challenge in studying many fundamental issues in the gradient structures. In contrast, these interfaces in the laminated structure are stationary, which makes it much easier to experimentally study some of the same issues presented in both types of structures. On the other hand, laminated structures also have some unique deformation mechanisms that may not be applicable to the gradient structures,[Citation25,Citation26] including the reported length scale effect on strength in metallic multilayers. This need to be clarified in future studies.
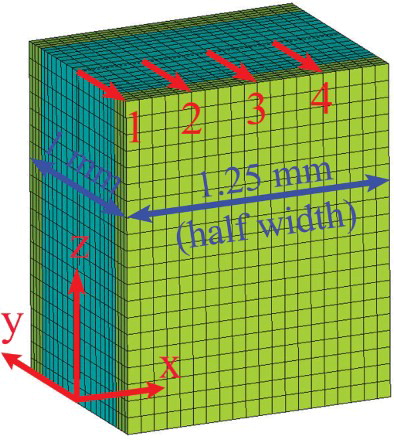
To probe the mechanism by which the gradient structure strengthens the integrated sample, we analyzed stress, strain, and strain gradient distribution across the sample thickness by means of the finite element method (FEM) using the commercial ANSYS 14 package. The variation of Poisson's ratio ν with tensile strain was calculated as [Citation27]
is the schematic FEM model and element grid. The constitutive relationships for both GS-layer and CG-layer were from the stress–strain curves under uniaxial loading in (a). Isotropic hardening based on von Mises criterion was used as the flow criterion under complicated stress states in the simulation. For high accuracy, both 3D structured gradient mesh division and 20 nodes element SOLID186 were adopted. The sample was strained under uniaxial tension to a strain of 0.01, which was divided into 10 loading steps.
Figure 4. Schematic FEM model showing a quarter of the gauge section of tensile sample. The tensile load is applied along the z direction. The origin of the coordinates is located at the sample geometric center. x=0 represents the sample center (path 1) while x=1.25 mm represents the sample edge.
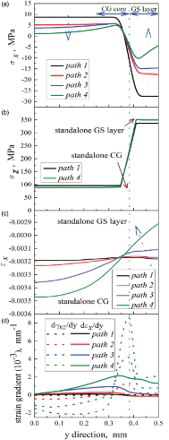
shows the FEM simulation results at the tensile strain of 0.008 in the z direction. As shown in (a), the normal stress in the x direction, σx, is positive in the CG central layer, but negative in the GS layer. σx should be zero in a homogeneous sample because no stress is applied laterally in the x direction. In other words, the applied uniaxial stress is converted to a bi-axial stress state in the integrated sample. (b) shows a large stress gradient near the CG/GS layer interface. The flow stress in the CG layer is slightly higher than in the standalone CG sample, while the flow stress in the GS layer is lower than in the standalone GS sample, which is caused by mechanical incompatibility due to the variation of Poisson's ratio across the two types of layers. (c) shows that the strain in the x direction, , for the CG layer of the integrated sample rises above that of its standalone counterpart, while
for GS layer decreases. This is due to the difference of Poisson's ratio evolution with strain in both the GS layer and CG layer, i.e. the former is still elastic upon yielding in the latter. Strain has to be continuous at the interface. This is the reason behind the stress re-distribution seen in (b). Interestingly, as shown in (d), there exist strain gradient
, and shear gradient
, with their peak values near the interface of the CG/GS layers. In addition, the strain gradients are larger near the sample edge (path 4) than at the center (path 1). The
is much larger than
in all paths.
Figure 5. FEM simulation results. (a) Stress along the x-axis. (b) Stress along the z-axis. (c) Strain along the x-axis. (d) Both normal and shear strain gradients along the x-axis.
It should be noted that the above FEM analysis can only be regarded as qualitative. First, it used the constitutive relationships obtained from standalone GS and CG samples. This effectively ignored the influence of the interlayer interaction on the constitutive relationships. Second, it ignored the structure gradient inside the GS layer. Nevertheless, the FEM results in provide an insight into the origin of the observed extra strengthening in the integrated sample.
The FEM results in can be understood by the development of mechanical incompatibility between the CG and GS layers and their mutual constraint during the uniaxial tensile testing. At the 0.008 tensile strain, the central CG layer deforms plastically, while the GS layers still deform elastically. The plastically deforming central layer has an apparent Poisson's ratio close to to maintain a constant volume, while Poisson's ratio in the GS layer is close to
. In other words, the central CG layer was trying to shrink more than the surface CG layers in the x direction.
However, the plastically deforming central layer is constrained by the two elastic outer layers to the same lateral strain at their two interfaces. This constraint results in two consequences: First, it causes a strain gradient near the interfaces in the x direction, as shown in (d), which will lead to the accumulation of geometrically necessary dislocations.[Citation28,Citation29,Citation30] Second, it leads to tensile normal stress in the plastic central layer and a compressive stress in the outer elastic layer in the x direction as shown in (a). Such a bi-axial stress state will activate more slip systems to enhance dislocation interaction and accumulation. These dislocation accumulations consequently contribute to extraordinary strengthening beyond what is predicted by the ROM.
The extra strengthening can be also partially attributed to the stress gradient shown in (a) and 5(b). It has been reported that stress gradient can significantly increase the yield stress,[Citation31,Citation32,Citation33] as described by
Experimental data in (c) and 3(c) suggest that an optimum thickness of GS layers (volume %) exists where synergetic strengthening is most effective. This can be understood by the bi-axial stress in the integrated samples. It is intuitive to hypothesize that a higher magnitude of strain and stress in the x direction will make it more effective to accumulate dislocations since it more effectively promotes dislocation interactions and increases the strain gradient near the interfaces. Since the stress state direction in the plastic central layer is opposite to that in the elastic GS layers and also because the forces between these two type of layers need to neutralize each other, there should exist an optimum GS layer thickness that exerts the maximum counter force to the plastically deforming central layer. In other words, there should be an optimum gradient layer thickness that produces the largest synergetic strengthening. This is an issue that needs to be further studied to help with designing gradient structure for the maximum synergetic strengthening.
The ΔHv peak in (c) and the strain gradient profile in (d) suggest that the high strain gradient and stress gradient near the interface indeed promoted the accumulation of dislocations. If deformed alone, the CG layer should have higher strain hardening because its large grain sizes make it easier to accumulate dislocation and also because it was subjected to larger plastic deformation.
It should be noted that the concept of gradient structure studied here is very different from the strain gradient plasticity reported in the literature.[Citation34,Citation35,Citation36,Citation37] First, the gradient structure spans a macroscopic length of hundreds of grains, which is much larger than the grain size scale typically considered by the conventional strain gradient plasticity. Second, the gradient structure has grain sizes varying along the depth from the sample surface, which results in a yield strength gradient, but the applied strain in the z direction is uniform across the entire sample thickness. Third, the macroscopic strain gradient is induced in the lateral direction although the applied strain in the z direction has no macroscopic strain gradient. Last, it should be noted that the strain gradient plasticity can also be applied at the microscopic level, e.g. inside individual grains, for the gradient structure studied here.
In summary, the gradient structure in IF steel increased the yield strength beyond what is predicted by the ROM. The synergetic increase in strength is attributed to the mechanical incompatibility caused by the mismatch between the Poisson's ratio in the elastic outer layers and the apparent Poisson's ratio in the central plastic layer. The mechanical incompatibility leads to two-dimensional stress states and lateral strain gradient near the plastic–elastic interfaces, which consequently lead to more dislocation interaction and accumulation to quickly increase the strength of the plastically deforming layer. The gradient structure also produces a macroscopic stress gradient across the thickness, especially near the plastic–elastic interfaces. Such a stress gradient further contributed to synergetic strengthening. These mechanisms do not occur in homogenous materials, and are unique deformation characteristics of materials with gradient structures. Our experimental results also indicate an optimum microstructural gradient for the best mechanical properties. These observations provide guidance in designing high-strength metals and alloys with gradient structures.
Acknowledgements
We are grateful for financial support of 973 programs (grant nos. 2012CB932203, 2012CB937500, and 6138504), National Natural Science Foundation of China (grant nos. 11222224, 11072243, 51301187, and 50571110), the Pangu Foundation, and the US Army Research Office (grant nos. W911NF-09-1-0427 and W911QX-08-C-0083).
References
- Suresh S. Graded materials for resistance to contact deformation and damage. Science. 2001;292(5526): 2447–2451. doi: 10.1126/science.1059716
- Gao, HJ, Ji, BH, Jager, IL, Arzt, E, Fratzl P. Materials become insensitive to flaws at nanoscale: lessons from nature. Proc Natl Acad Sci USA. 2003;100(10):5597–5600. doi: 10.1073/pnas.0631609100
- Ray, AK, Das, SK, Mondal, S, Ramachandrarao P. Microstructural characterization of bamboo. J Mater Sci. 2004;39(3):1055–1060. doi: 10.1023/B:JMSC.0000012943.27090.8f
- Fang, TH, Li, WL, Tao, NR, Lu K. Revealing extraordinary intrinsic tensile plasticity in gradient nano-grained copper. Science. 2011;331(6024):1587–1590. doi: 10.1126/science.1200177
- Chen, AY, Li, DF, Zhang, JB, Song, HW, Lu J. Make nanostructured metal exceptionally tough by introducing non-localized fracture behaviors. Scr Mater. 2008;59(6): 579–582. doi: 10.1016/j.scriptamat.2008.04.048
- Hughes, DA, Hansen N. Graded nano-structures produced by sliding and exhibiting universal behavior. Phys Rev Lett. 2001;87(13):135503.
- Wu, XL, Jiang, P, Chen, L, Yuan, FP, Zhu YT. Extraordinary strain hardening by gradient structure. Proc Natl Acad Sci USA. 2014;111(20):7197–7201. doi: 10.1073/pnas.1324069111
- Zhu, YT, Liao XZ. Nanostructured metals—retaining ductility. Nature Mater. 2004;3(6):351–352. doi: 10.1038/nmat1141
- Wang, YM, Chen, MW, Zhou, FH, Ma E. High tensile ductility in a nanostructured metal. Nature. 2002;419(6910):912–915. doi: 10.1038/nature01133
- Huang, XX, Hansen, N, Tsuji N. Hardening by annealing and softening by deformation in nanostructured metals. Science. 2006;312(5771):249–251. doi: 10.1126/science.1124268
- Zhao, YH, Liao, XZ, Cheng, S, Ma, E, Zhu YT. Simultaneously increasing the ductility and strength of nanostructured alloys. Adv Mater. 2006;18(17):2280–2283. doi: 10.1002/adma.200600310
- Youssef, KM, Scattergood, RO, Murty, KL, Horton, JA, Koch CC. Ultrahigh strength and high ductility of bulk nanocrystalline copper. Appl Phys Lett. 2005;87(9):091904.
- Liddicoat, PV, Liao, XZ, Zhao, YH, Zhu, YT, Murashkin, MY, Lavernia, EJ, Valiev, RZ, Ringer SP. Nanostructural hierarchy increases the strength of aluminum alloys. Nature Commun. 2010;1:63. doi: 10.1038/ncomms1062
- Lu, K, Lu, L, Suresh S. Strengthening materials by engineering coherent internal boundaries at the nanoscale. Science. 2009;324(5925):349–352. doi: 10.1126/science.1159610
- Gleiter H. Nanocrystalline materials. Prog Mater Sci. 1989;33(4):223–315. doi: 10.1016/0079-6425(89)90001-7
- Meyers, MA, Mishra, A, Benson DJ. Mechanical properties of nanocrystalline materials. Prog Mater Sci. 2006;51(4):427–556. doi: 10.1016/j.pmatsci.2005.08.003
- Weertman, JR, Farkas, D, Hemker, K, Kung, H, Mayo, M, Mitra, R, Van Swygenhoven, H. Structure and mechanical behavior of bulk nanocrystalline materials. MRS Bull. 1999;24(2):44–50.
- Valiev, RZ, Alexandrov, IV, Zhu, YT, Lowe TC. Paradox of strength and ductility in metals processed by severe plastic deformation. J Mater Res. 2002;17(1):5–8. doi: 10.1557/JMR.2002.0002
- Jian, WW, Cheng, GM, Xu, WZ, Yuan, H, Tsai, MH, Wang, QD, Koch, CC, Zhu, YT, Mathaudhu SN. Ultrastrong Mg alloy via nano-spaced stacking faults. Mater Res Lett. 2013;1(2):61–66. doi: 10.1080/21663831.2013.765927
- Lu, K, Lu J. Surface nanocrystallization (SNC) of metallic materials-presentation of the concept behind a new approach. J Mater Sci Technol. 1999;15(3):193–197.
- Lu, K, Lu J. Nanostructured surface layer on metallic materials induced by surface mechanical attrition treatment. Mater Sci Eng A. 2004;375–377, 38–45. doi: 10.1016/j.msea.2003.10.261
- Pande, CS, Cooper KP. Nanomechanics of Hall–Petch relationship in nanocrystalline materials. Prog Mater Sci. 2009;54(6):689–706. doi: 10.1016/j.pmatsci.2009.03.008
- Sevillano, JG, Aldazabal J. Ductilization of nanocrystalline materials for structural applications. Scr Mater. 2004;51(8):795–800. doi: 10.1016/j.scriptamat.2004.05.015
- Embury, JD, Hirth JP. On dislocation storage and the mechanical response of fine scale microstructures. Acta Metall Mater. 1994;42:2051–2056. doi: 10.1016/0956-7151(94)90030-2
- Misra, A, Hirth, JP, Hoagland RG. Length-scale-dependent deformation mechanisms in incoherent metallic multilayered composites. Acta Mater. 2005;53:4817–4824. doi: 10.1016/j.actamat.2005.06.025
- Wang, J, Misra A. An overview of interface-dominated deformation mechanisms in metallic multilayers. Curr Opin Solid State Mater Sci. 2011;15:20–28. doi: 10.1016/j.cossms.2010.09.002
- Beat, CW, Mills, EJ, Hyler WS. Effect of variation in poisson's ratio on plastic tensile instability. J Fluids Eng. 1967;89(1):35–39.
- Ashby MF. The deformation of plastically non-homo- geneous materials. Phil Mag. 1970;21(170):300–424. doi: 10.1080/14786437008238426
- Gao, HJ, Huang, YG, Nix, WD, Hutchinson JW. Mechanism-based strain gradient plasticity—I. Theory. J Mech Phys Solids. 1999;47(6):1239–1263. doi: 10.1016/S0022-5096(98)00103-3
- Gao, HJ, Huang YG. Geometrically necessary dislocation and size-dependent plasticity. Scr Mater. 2003;48(2): 113–118. doi: 10.1016/S1359-6462(02)00329-9
- Chaudhar, P, Scatterg RO. On pile-up model for yielding. Acta Metall. 1966;14(5):685–687. doi: 10.1016/0001-6160(66)90077-0
- Hirth JP. Dislocation pileups in the presence of stress gradients. Philos Mag. 2006;86(25–26):3959–3963. doi: 10.1080/14786430500415690
- Chakravarthy, SS, Curtin WA. Stress-gradient plasticity. Proc Natl Acad Sci USA. 2011;108(38): 15716–15720. doi: 10.1073/pnas.1107035108
- Abu Al-Rub, RK. Interfacial gradient plasticity governs scale-dependent yield strength and strain hardening rates in micro/nano structured metals. Int J Plast. 2008;24(8):1277–1306. doi: 10.1016/j.ijplas.2007.09.005
- Lapovok, R, Dalla Torre, FH, Sandlin, J, Davies, CHJ, Pereloma, EV, Thomson, PF, Estrin Y. Gradient plasticity constitutive model reflecting the ultrafine micro-structure scale: the case of severely deformed copper. J Mech Phys Solids. 2005;53(4):729–747. doi: 10.1016/j.jmps.2004.11.006
- Evans, AG, Hutchinson JW. A critical assessment of theories of strain gradient plasticity. Acta Mater. 2009;57(5):1675–1688. doi: 10.1016/j.actamat.2008.12.012
- Mughrabi H. On the current understanding of strain gradient plasticity. Mater Sci Eng A. 2004;387–389: 209–213. doi: 10.1016/j.msea.2004.01.086