
ABSTRACT
The efficiency of large second phase particles to stimulate nucleation of recrystallization in commercially cold rolled (25%) AA5182 aluminium sheet is investigated by laboratory multimodal X-ray tomography. The spatial distributions of 11434 particles and 742 nuclei are determined non-destructively in 3D in the same sample volume. Our work confirms that particle stimulated nucleation is the dominant nucleation mechanism, but it is also found that PSN nuclei stimulated from small particles and non-PSN nuclei can grow to large sizes. These results and the observed orientation distributions of the PSN and other nuclei are discussed in relation to existing theories.
IMPACT STATEMENT
The efficiency of the nucleation mechanism called particle stimulated nucleation is quantified in 3D by a non-destructive experimental approach.
GRAPHICAL ABSTRACT
Introduction
A key open question in recrystallization is where and with what crystallographic orientation nuclei form [Citation1]. We can now address this question quantitatively and in 3D using a non-destructive experimental methodology.
Optical and electron microscopy are most often used to study recrystallization. A challenge is of course that microscopy only visualizes a sample surface or a very thin slice. In spite of this limitation, a number of nucleation mechanisms have been suggested. Among them, particle stimulated nucleation, PSN, is probably the one studied most extensively. The importance of PSN is documented by the fact that industries with reasonable success can estimate the recrystallized grain size for example for selected aluminium alloys based on PSN. The mechanism behind PSN is that, during plastic deformation, large constituent particles give rise to local lattice rotations in so-called ‘deformation zones’ around the particles and that nuclei can easily form in such deformation zones [Citation2–5]. For aluminium, the amount of iron in the alloy and casting conditions largely determine the size and volume fraction of particles capable of PSN [Citation6].
Studies of PSN by electron microscopy suffer from serious limitations: both particles below the surface and in the layer polished away during sample preparation may lead to PSN but these particles are not recorded; likewise, PSN nuclei beneath the surface are ‘invisible’. There is thus a burning need to revisit PSN in 3D. With this purpose, 3D serial sectioning has been used [Citation7,Citation8], but the method introduces uncertainty due to the lack of knowledge about the layers sectioned away.
The aim of our work is, by a non-destructive 3D experimental approach, new to PSN studies, to reveal the spatial distribution of both large second phase particles and recrystallization nuclei in AA5182 aluminium. It is known that PSN will play some role in this alloy, but its efficiency is largely unknown [Citation9].
The method we use, is laboratory-based X-ray tomography combining two imaging modes: conventional absorption contrast tomography (ACT) and laboratory diffraction contrast tomography (LabDCT) [Citation10]. Integration of the two contrast modes enables correlative analysis between the grains structures and other microstructural features such as second phases, cracks, pores or precipitates [Citation11–14]. With this approach, it is possible to avoid missing particles or nuclei in the characterized volume, and thus document what fraction of nuclei originate from particles and in general analyse PSN in much more detail than hitherto possible.
Materials and methods
The material used was commercial AA5182 alloy sheet with the chemical composition as given in Table S1 in the Supplementary Material. The AA5182 sheet was supplied by Novelis Inc. where it was first hot rolled to 4 mm, and subsequently cold rolled to 1.33 mm on industrial rolling mills followed by intermediate annealing to completely recrystallize the sheet. Finally, the material was cold rolled to the thickness of 1 mm, i.e. a reduction of 25%. This low strain was chosen to ensure only few nuclei develop and they can grow to a fairly large size.
A sample was annealed at 305°C in an air furnace for 15 min to achieve an early stage of recrystallization. By electron back scattering diffraction (EBSD), the sample was found to be ∼6% recrystallized by manual intercept measurements and automatic analysis using HKL software. The nuclei have sizes ranging from 3 to 26 µm with an average of 10 µm (Figure S1 in the Supplementary Material). It is clear that, when a nucleus has grown to the size of 26 µm, it can hardly be called a nucleus anymore, it is a grain. However, for simplicity we have here chosen to refer to all the recrystallized areas as ‘nuclei’.
For 3D characterization, the partially recrystallized sample (∼6%) was cut to 1 mm (ND) ×10 mm (RD) ×1 mm (TD) by wire cutting and subsequently electropolished in STRUERS A2 electrolyte at 0°C for 180 s at 20 V. A Zeiss Xradia 520 Versa X-ray microscope was used for both ACT and LabDCT scans. The ACT scan was performed with a source voltage of 90 keV and tube current of 89 µA, with source-sample-detector distances of 12–60 mm. In total 3000 projections were collected with 2.5 s exposure time for each projection. With a 4x objective and camera binning of 2, the reconstructed ACT volume has a voxel size of about 1.1 µm. The LabDCT scan was done with a source voltage of 110 keV and current of 91 µA, at a Laue focusing working distance of 12 mm. 180 diffraction projections were taken, each with exposure time of 400 s. Reconstruction of the 3D grain map was done in the GrainMapper3D software (Xnovo Technology ApS), using a minimum completeness of 50%, which is higher than the default value of 45%, to ensure high-fidelity reconstruction. The indexed grains were validated by the built-in forward simulation feature in the software [Citation15]. The output 3D grain map has voxel size of 2 µm. The gauge volume mapped by both ACT and LabDCT was 680×630×930 µm3. The sizes of particles and nuclei reported in the following are represented by equivalent sphere diameters.
Results and discussion
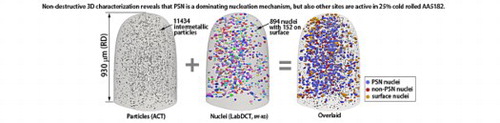
The 3D spatial distribution of particles larger than 1.4 µm is shown in Figure (a). In total, we identify 11434 particles, most of which are distributed rather homogenously in the gauge volume. Some ‘strings’ of small particles are seen aligned along the rolling direction. The particles have an average diameter of 4.7 µm with sizes ranging up to 23.5 µm. That we cannot map particles smaller than 1.4 µm due to the ACT resolution is not important for the present investigation as such small particles do not form deformation zones sufficiently intense to be effective for PSN [Citation2]. The spatial resolution of 1.4 µm also means that if the microstructure contains clusters of particles with internal distances below the resolution limit, the individual particles within the cluster cannot be resolved; the cluster will be imaged as one particle. However, the effect of such a dense cluster on the local deformation pattern and thus on PSN is expected to be similar to that of a single particle with the same size as the cluster.
Figure 1. 3D distribution of particles and recrystallized nuclei; (a) particles (from ACT); (b) nuclei (from LabDCT) (IPF-RD coloring); (c) nuclei overlaid with particles; (d) classification of nuclei – blue: PSN, red: non-PSN, yellow: surface nuclei. RD is parallel to the cylindrical axis here.
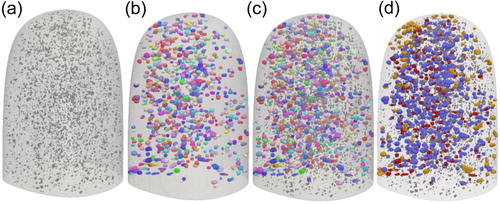
Figure (b) shows the spatial distribution of the nuclei. 894 nuclei were found in the gauge volume, out of which 742 are in the bulk, i.e. do not touch the sample surface. Only these 742 nuclei are included in the following analysis. Nuclei smaller than 10 µm are largely missing from the reconstruction, as their diffraction signals are generally too low to be separated from the background noise. By comparing with EBSD data for the present sample, it is found that volume-wise the LabDCT dataset only contains about 50% of the nuclei. As the ones recorded by LabDCT are the largest nuclei, this explains why the average size of the nuclei observed by LabDCT (23 µm), is larger than that found by EBSD (10 µm). This limitation gives some bias in the nucleation analysis, but it has to be noted that the limitation applies to all nuclei irrespective of whether they are forming at particles or elsewhere. Furthermore, the largest grains in general have a large growth potential whereas many small grains cease growth as they become surrounded by faster growing grains, and it is the large grains which dominate the texture development. However, as the PSN nuclei on average are slightly larger than the non-PSN ones (see Figure 3 in the following), the limitation may lead to a slight overestimation of the PSN fraction.
By combining the two data sets, as shown in the Figure (c), we can directly identify which nuclei are next to particles and may thus originate from PSN. In this quantification, we define nuclei touching or surrounding particles as PSN nuclei, i.e. the distance between the centroid of a nucleus and any particle centroid is smaller than the sum of both radii. The rest are classified as non-PSN nuclei. By this method, we may overestimate PSN since some nuclei will be classified as PSN even if they formed elsewhere and have simply grown to be near a particle. But all true PSN nuclei will indeed be classified as such. Based on this classification, 525 nuclei out of the total of 742 are found to be PSN nuclei, i.e. a maximum of 2/3 of the nuclei are formed by PSN. The result documents that PSN is a dominant nucleation mechanism for this alloy and strain condition but other nucleation sites are also active. The spatial distribution of the PSN and non-PSN nuclei is visualized in Figure (d) showing a rather homogeneous distribution of both PSN and non-PSN nuclei.
A common argument explaining why at least 1/3 of the nuclei do not originate from PSN is that recrystallization is always a competition among nuclei of different types [Citation16]. Additionally, in the case of the 5182 alloy, sub-micron Al-Mn dispersoids may block the growth of nuclei and thus prevent them from reaching a critical size. Adjacent nuclei with sufficient curvature advantage may consume the impeded nuclei, reducing the PSN efficiency. This has been often observed in 3xxx alloys where the density of dispersoids is considerably higher, but dispersoids will still have an effect in alloy 5182.
With the current data, we can now address 3 key PSN questions:
Which particles stimulate PSN?
What is the size of PSN nuclei compared to non-PSN ones?
What crystallographic orientations do the PSN nuclei have?
Starting with question 1, according to Humphreys’ model [Citation2], for Al–Si alloy samples deformed 25%, particles larger than 8 µm are expected to stimulate nucleation. The present results show that particles ranging from 1.4 to 16.7 µm stimulate nucleation (Figure ). The difference in the critical particle size (i.e. the minimum particle size needed for PSN) between our work and that of Humphreys is explained by the condition in the deformation zones. With 4.5% Mg in the 5182, compared to 0% for Humphreys’ Al–Si alloy, the work hardening rate is markedly increased [Citation17,Citation18] and the dislocation density in the deformation zones is considerably higher; at the present strain about 2–4 times higher. Consequently, alloy 5182 would have a smaller critical PSN particle size than the model Al–Si alloy.
Figure 2. Size distribution of particles which lead to PSN and not to PSN. There are 503 PSN and 10931 non-PSN particles in the distributions.
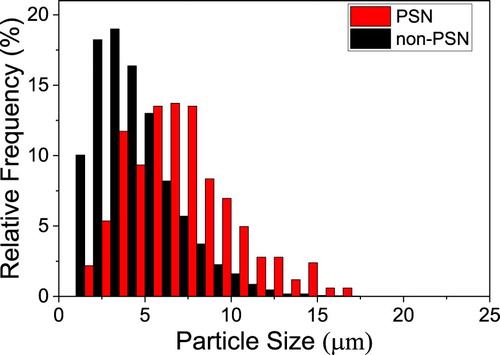
The present investigation shows that only about 7.5% of the PSN nuclei originate from particles less than 3 µm. It therefore appears that for the present sample, 4–5 µm is a reasonable estimate of the critical PSN particle size. For simplicity, we have chosen 5 µm in the following analysis. Our main conclusions would however be largely the same, have we chosen 4 µm instead.
Indeed, many particles larger than 5 µm stimulate nucleation, but there are 3974 large particles (> 5 µm) which do not. This means that 92% of the large particles do not stimulate nucleation of nuclei, which have grown to a size that can be recorded with the present method.
PSN nuclei are also observed next to small particles (Figure ); these may actually originate from other nucleation sites and just have grown to meet these small particles, and, as such, are false PSN nuclei. In that case, one would expect the size of nuclei next to small particles to be larger than those next to large particles. However, no such relation is observed for the present sample (see Figure S2). Another reason, which is more likely, is that clusters of small particles or small particles at original grain boundaries, seen as strings of particles may be equally potent nucleation sites as isolated large particles, as suggested in [Citation19].
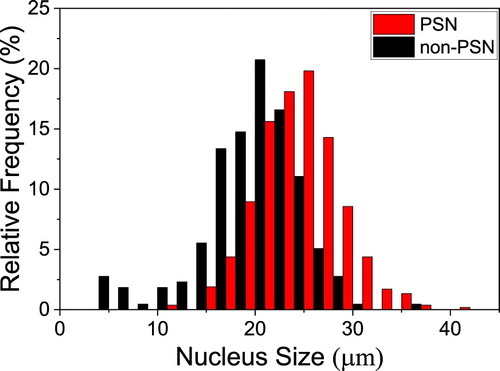
Concerning size ratios between PSN and non-PSN nuclei (question 2 above), it is expected that nuclei stimulated by particles may form first and thus have a growth advantage compared to non-PSN nuclei. Our results show the size of PSN nuclei is slightly larger than the non-PSN ones (Figure ). On average, PSN nuclei are 24.1 µm while non-PSN ones are 20.1 µm. It is, however, interesting to note that some large nuclei are non-PSN. This suggests that these may form as early as the PSN ones and/or have a growth advantage over PSN nuclei.
Figure 3. Size distribution of nuclei classified as PSN and non-PSN nuclei. There are 525 PSN and 217 non-PSN nuclei in the distributions.
Concerning the orientations of the nuclei (question 3 above), we can with the present data directly validate the general assumption that these nuclei have random or spread rolling orientations [Citation2,Citation19]. The results are reported in Table . That the difference between PSN and non-PSN nuclei isn’t larger may be related to the relative low strain investigated here: at such low strain the lattice rotations (and stain hardening) within the deformation zones are not very pronounced and thus quite similar to the matrix, and all together the rolling texture in the deformed matrix is not well developed yet. The rather ‘mixed’ textures observed in this sheet seem congruent with the non-directional properties desired in highly formable automotive sheet alloys.
Table 1. Overview of sizes and fractions of nuclei with different crystallographic orientations. All orientations within 15° from the Brass, Copper and S components are included in ‘Rolling’, ‘Cube’ as those up to 15° away from this component and ‘Random’ as anything else.
Conclusions
The efficiency of PSN has been evaluated in 25% cold rolled AA5182 aluminium annealed to ∼6% recrystallization. Using multimodal laboratory X-ray tomography, that combines LabDCT and conventional ACT, the full 3D distribution of both second phase particles and nuclei are mapped non-destructively within the same sample volume. Experimental limitations mean that only particles larger than the 1.4 µm are mapped and nuclei smaller than 10 µm can be missing. The 1.4 µm particle size cut-off limitation is not critical for the present analysis as it is large particles which are stimulating PSN. The nuclei size cut-off limitation means that volume-wise the LabDCT dataset contains only about 50% of the nuclei observed by EBSD, and the ones recorded by LabDCT are the larger ones. The following conclusions are thus valid for nuclei which have grown to be in the upper half of the size distribution.
Although PSN is the dominant nucleation mechanism, at least 1/3 of the large nuclei originate from other sites than second phase particles. Reasons for the relative low efficiency of PSN are related to the low strain investigated here, and the efficiency of competing nucleation sites.
The critical particle size for PSN is found to be 4–5 µm. While this size is significantly smaller than that predicted from earlier PSN work on binary Al–Si alloys, enhanced work hardening due to the high Mg content of the AA5182 alloy can explain the difference.
Only a relatively small portion of large particles above the critical size are observed to stimulate nucleation of nuclei which have grown to a relatively large size. For the present sample 92% of particles larger than 5 µm do not lead to nuclei with sizes above 10 µm. The presence of dispersoids hindering the nuclei growth is of importance here.
Large nuclei are also observed next to particles smaller than the critical size of 4–5 µm for PSN. It is suggested that small particles in clusters or at original grain boundaries are powerful nucleation sites too.
The average size of the PSN nuclei is slightly larger than that of non-PSN nuclei, and the orientations of the former are slightly more random. However, none of these effects are very pronounced which is also expected to be a low strain effect.
The experimental technique and analysis procedure presented here are representing a way forward in quantitative validations of the PSN theory for many more alloys with different particle content (including size, shape and spatial distributions) deformed to different strains. In particular, it will be interesting to investigate samples deformed to higher strains, where the PSN efficiency is likely to be much higher, with a better spatial accuracy to reduce the nuclei detection limit.
Acknowledgments
This research is funded by the National Natural Science Foundation of China (grant No.51421001, No.51571046), and the Project No. 2020CDJDCL001 supported by the Fundamental Research Funds for the Central Universities. Furthermore, we appreciate the support from the 111 Project (B16007) by the Ministry of Education and the State Administration of Foreign Experts Affairs of China. D J J and Y B Z further acknowledge support from the European Research Council (ERC) under the European Union's Horizon 2020 research and innovation programme (M4D – grant agreement No. 788567).
Disclosure statement
No potential conflict of interest was reported by the author(s).
Additional information
Funding
References
- Humphreys J, Rohrer GS, Rollett A. Recrystallization and related annealing phenomena. 3rd ed Amsterdam: Elsevier; 2017.
- Humphreys FJ. The nucleation of recrystallization at second phase particles in deformed aluminium. Acta Metall. 1977;25:1323–1344. doi: 10.1016/0001-6160(77)90109-2
- Humphreys FJ. Local lattice rotations at second phase particles in deformed metals. Acta Metall. 1979;27:1801–1814. doi: 10.1016/0001-6160(79)90071-3
- Tangen S, Sjølstad K, Furu T, et al. Effect of concurrent precipitation on recrystallization and evolution of the P-texture component in a commercial Al-Mn alloy. Metall Mater Trans A Phys Metall Mater Sci. 2010;41:2970–2983. doi: 10.1007/s11661-010-0265-8
- Da Fonseca JQ, Ko L. The kinematics of deformation and the development of substructure in the particle deformation zone. IOP Conf Ser Mater Sci Eng. 2015;89:012012. doi: 10.1088/1757-899X/89/1/012012
- Marshall GJ. Microstructural control during processing of aluminium canning alloys. Mater Sci Forum. 1996;217–222:19–30. doi: 10.4028/www.scientific.net/MSF.217-222.19
- Zhang Y, Juul Jensen D, Zhang Y, et al. Three-dimensional investigation of recrystallization nucleation in a particle-containing Al alloy. Scr Mater. 2012;67:320–323. doi: 10.1016/j.scriptamat.2012.05.006
- Weiland H, Rouns TN, Liu J. The role of particle stimulated nucleation during recrystallization of an aluminum-manganese alloy. Z Met. 1994;85:592–597.
- Guo Q, Lei X, Sanders RE, et al. Effect of annealing conditions on recrystallization of AA5182 sheet. Mater Sci Forum. 2017;877:264–271. doi: 10.4028/www.scientific.net/MSF.877.264
- Bachmann F, Bale H, Gueninchault N, et al. 3D grain reconstruction from laboratory diffraction contrast tomography. J Appl Crystallogr. 2019;52:643–651. doi: 10.1107/S1600576719005442
- Sun J, Zhang Y, Lyckegaard A, et al. Grain boundary wetting correlated to the grain boundary properties: a laboratory-based multimodal X-ray tomography investigation. Scr Mater. 2019;163:77–81. doi: 10.1016/j.scriptamat.2019.01.007
- Lu N, Kang J, Senabulya N, et al. Dynamics of particle-assisted abnormal grain growth revealed through integrated three-dimensional microanalysis. Acta Mater. 2020;195:1–12. doi: 10.1016/j.actamat.2020.04.049
- Keinan R, Bale H, Gueninchault N, et al. Integrated imaging in three dimensions: providing a new lens on grain boundaries, particles, and their correlations in polycrystalline silicon. Acta Mater. 2018;148:225–234. doi: 10.1016/j.actamat.2018.01.045
- McDonald SA, Holzner C, Lauridsen EM, et al. Microstructural evolution during sintering of copper particles studied by laboratory diffraction contrast tomography (LabDCT). Sci Rep. 2017;7:1–11. doi: 10.1038/s41598-017-04742-1
- Niverty S, Sun J, Williams J, et al. A forward modeling approach to high-reliability grain mapping by laboratory diffraction contrast tomography (LabDCT). JOM. 2019;71:2695–2704. doi: 10.1007/s11837-019-03538-0
- Hansen N, Juul Jensen D. Deformation and recrystallization textures in commercially pure aluminum. Metall Trans A. 1986;17:253–259. doi: 10.1007/BF02643901
- Yan S, Zhou H, Qin QH. Microstructure versus size: nano/microscale deformation of solute-strengthening Al alloys via pillar compression tests. Mater Res Lett. 2019;7:53–59. doi: 10.1080/21663831.2018.1553802
- Sanders RE, Baumann SF, Stumpf HC. Wrought non–heat-treatable aluminum alloys. In: Vasudevan AK, Doherty RD, editor. Aluminum alloys research applied. San Diego: Academic Press; 1989. p. 65–105.
- Humphreys FJ, Juul Jensen D. Structure and texture evolution during the recrystallisation of particle containing materials. Proc 7th Risø Int Symp. 1986:93–106.