
 ?Mathematical formulae have been encoded as MathML and are displayed in this HTML version using MathJax in order to improve their display. Uncheck the box to turn MathJax off. This feature requires Javascript. Click on a formula to zoom.
Abstract
This study developed a design methodology against liquid-state cracking by combining the Scheil–Gulliver solidification simulations and Machine Learning analysis to design alloys for Fusion Additive Manufacturing. Applying this design approach resulted in a Fe–20Cr–7Al–4Mo–3Ni. The alloy was successfully printed with relative densities of over 99%. Microstructure of printed material was extensively characterised through scanning and transmission electron microscopy, energy dispersive spectroscopy and x-ray diffraction, confirming a single-phase material with low texture and negligible chemical segregation. Neither solidification nor liquation cracks were detected, supporting the validity of the methodology, however, the alloy suffered from solid-state cracking, hindering the ductility.
GRAPHICAL ABSTRACT
IMPACT STATEMENT
A design methodology against solidification and liquation cracking and chemical segregation to assist the alloy design for Additive Manufacturing.
Additive manufacturing (AM) technologies hold great promise for manufacturing advanced materials with unprecedented degrees of freedom in structural optimisation to significantly improve mechanical performance and functionalities. However, there remain challenges such as cracks, porosity and unwanted phases that can severely affect the performance of AM components [Citation1–3]. Cracks formation is inherently related to the microstructure evolution in the solidification and solid-state phase transformations. The microstructure development in solidification is affected by the thermal field, which, in turn, is governed by the processing conditions [Citation4–6]. There is an overwhelming number of studies investigating the effect of the process parameters on the porosity formation during AM [Citation7–11]. However, the effects of solidification conditions such as freezing range and solidification gradient on cracks are often overlooked. Fundamental studies in welding metallurgy highlight the roles of such solidification conditions in the microstructure development [Citation6] (including the grain misorientation [Citation12]), and most importantly, in the cracking susceptibility of alloys [Citation13–18]. It is increasingly vital to translate such in-depth understanding to study the effects of solidification characteristics on the susceptibility to cracking in AM. This investigation aims to integrate knowledge in liquid-state cracking obtained in cast and fusion welding [Citation12] to develop a set of criteria that assesses crack susceptibility. Such an assessment is subsequently used to assist the selection and design of printable alloys with low susceptibility to solidification and liquation cracking in fusion AM.
S. Kou developed a generalised methodology to assess the solidification cracking susceptibility for fusion welding, highlighting the influential role of solidification behaviour in the cracking of Al alloys [Citation14,Citation16]. Solidification cracks typically form at the terminal stage of the solidification when the liquid feed in the intercellular region becomes constrained. Kou has demonstrated that a steeper gradient between temperature and fraction of solid (i.e. solidification gradient) results in higher susceptibility to the solidification cracking of the material. Therefore, a material with a lower solidification gradient should have good resistance to the solidification cracking. Despite significant similarities between fusion welding and fusion additive manufacturing, such as laser powder bed fusion (LPBF), this theory has not been yet used to assess the cracking susceptibility in fusion AM process. Besides, the cooling rate during LPBF is usually higher than that in arc and laser/electron beam welding, reaching 106–107 K/s [Citation19–21]. It is still yet to be determined whether Kou’ criteria applies to processes with higher cooling rates. Therefore, it is important to check the applicability of this theory to design an alloy immune to solidification cracking in LPBF.
Liquation cracking occurs in regions of low melting temperatures (eutectic compounds or solute-enriched regions) in the heat-affected zone (HAZ). The solubility of alloying elements tends to decrease with reducing temperature, causing the chemical segregation towards the end of the solidification. This segregation extends the solidus temperature of the material and can result in solute element enriched regions (and eutectic compounds) with lower melting temperatures. Because of the repeated deposition, each location inside the build experiences multiple cycles of melting and solidification, and subsequently being the HAZ when its adjacent locations are being deposited. Low melting temperature regions can be locally melted and pulled apart by thermal stresses imposed by the surrounding solid [Citation22,Citation23]. Designing an alloy with a stable single-phase and minimal chemical segregation will vastly reduce the susceptibility to liquation cracking. The chemical segregation is related to the freezing range (i.e. the difference between liquidus and solidus temperature). Wider the range, more segregated the alloying elements. Designing an alloy with a narrow freezing range can minimise chemical segregation.
Consequently, this study integrates welding approaches into the assessment of susceptibility to solidification and liquation cracking. The assessment criteria were used to generate a thermodynamics database of solidification behaviour to assist the search for alloys with good resistance to cracking. The search was validated by examining the consolidation, microstructure and properties of a selected alloy.
Among high-performance materials, Fe-based alloys are considered as most versatile and used alloys with high recyclability and potential to increase sustainability in structural applications [Citation24]. FeCrAl alloys were of particular interest as they have been widely reported as a good candidate for nuclear applications, specifically the fuel cladding, heating elements and catalytic converters [Citation25–27]. A high amount of Cr and Al provide exceptional oxidation resistance, forming a coherent protective multilayer film of Al2O3–Cr2O3 up to the melting point of ∼1500°C [Citation28]. Furthermore, FeCrAl alloys have not previously been used in AM. Therefore, this alloy family was chosen as a candidate for validating the assessment criteria.
Solidification gradient was calculated by the Scheil–Gulliver solidification model using ThermoCalc (TC), commercial software for calculating thermodynamics phase diagrams (CALPHAD). The solidification gradient was calculated at a terminal region of solidification in a range of 0.87<<0.94, where
is the fraction of solid component, according to Kou’ study [Citation14]. Composition optimisation was performed to minimise the solidification range and gradient within the Fe–Cr–Al–Ni–Mo system by coupling TC with a Matlab script. Machine Learning was used to analyse the effect of alloying elements on solidification gradient and range, Figures S2, S3. A detailed description of the methods is given in Section A of the Supplementary Materials. The optimisation process suggested a material (Fe–20Cr–7Al–4Mo–3Ni) that has a very narrow freezing range 1512–1483°C (29°C) and a very shallow solidification gradient
at the terminal range (Figure (a)). This gradient is much lower as compared to H13 tool steel (−2364 K), which was found to form solidification cracks during LBPF processing [Citation29], and even lower than that of highly printable 316L [Citation6] (−506 K). While the low solidification gradient results in less susceptibility to solidification cracking, the narrow freezing range reduces the chemical segregation, reducing the risk of liquation cracking. Moreover, Fe, Cr and Al have very similar vapour pressures and low volatility, reducing preferential evaporation and keyholing.
Figure 1. (a) SEM image of FeCrAl powder; (b) powder size distribution measured through SEM imaging; (c) effect of energy density on relative density during deposition; (d) XRD patterns of powder, as-print, and wrought samples.
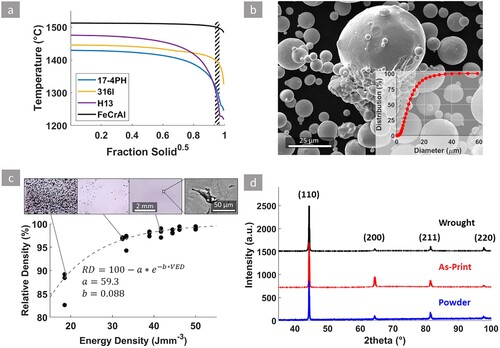
The pre-alloyed gas atomised powder (provided by HC Starck STC GmbH) was characterised using SEM analysis (Figure (b)). Alloy composition was confirmed by energy-dispersive X-ray spectroscopy (EDX) analysis in both the powder and as-printed material, conducted using a Zeiss Auriga scanning electron microscope (SEM) at 20 kV. Printed samples were manufactured using Renishaw AM400. Process parameters of the builds are presented in Table S1. The volumetric energy density, a common metric used to optimise the consolidation, was calculated using the following equation:
(1)
(1) where
and
denote laser power, scan speed, hatch spacing and layer thickness, respectively. Cubes 10 × 10 × 10mm3 were firstly printed to identify an optimal process window (batch 1, 2 in Table S1). Subsequently, blocks of 50 × 20 × 20mm3 were built using identified optimal parameters to evaluate the mechanical properties (batch 3, 4 in Table S1). Consolidation of the samples was measured using the Archimedes density principle, while the theoretical density of the sample was estimated using the method described elsewhere [Citation30]. To investigate the impact of the LPBF on material properties, some of the atomised powder was molten in a ceramic crucible at 1600°C for 2 h using a vacuum furnace. The solidified block was forged with 40% height reduction, hot rolled with 80% thickness reduction and annealed for 1 h, with all procedures performed sequentially at 1000°C. Powder, printed and wrought samples were analysed by X-ray diffraction (XRD) using a Bruker D2 Phaser to identify the phases and measure the lattice parameter. Mechanical properties were evaluated by tensile testing performed using a Gatan 5000W micro-tensile at a strain rate of 10−3s−1 (sample dimensions are presented in Figure S4). Electron backscattered diffraction (EBSD) was performed using Zeiss Sigma300 at the voltage of 20 kV. Transmission electron microscopy (TEM) was done using JEOL 2100F, equipped with an Oxford instrument EDS detector at the voltage of 100 kV to characterise the dislocation condition and chemical segregation. Samples for TEM were prepared using electrochemical polishing with the standard A2 electrolyte at 25 V.
Powder size ranged between 5 and 45 µm, while morphology was mostly spherical, with a few satellites present, Figure (b). Highly dense samples (with the consolidation was above 98%) were obtained with energy density above 47 J mm−3 (Figure (c)). High-resolution optical sections of the samples are presented in Supplementary Figure S5. The remaining porosity of dense samples mainly consisted of keyholes near the free surface of samples (Figure S5C) due to changes in local thermal conduction and significant changes in the melt-pool dynamics near the end of the deposition line, resulting in excessive energy density and unstable melt-pool [Citation19]. Lack-of-fusion pores (Figure (c) top right insert) were relatively infrequent.
Powders, as-printed and wrought samples exhibited a single-phase body centred cubic (BBC) structure, Figure (d). There were no peak shifts observed on the XRD, suggesting no change in the lattice parameter before and after L-PBF. Through Rietveld refinement, the lattice parameter was identified to be 2.894 Å in all samples. Interestingly, the peak intensities do not substantially differ, indicating that the crystallographic texture in the as-print and wrought samples is minimal (XRD was carried out on the top surface of the as-print samples).
EBSD of the as-print material shows typical microstructure for scan strategy with 90° rotation between layers [Citation30]. Wide, long columnar grains were observed along the build direction growing across in-layer neighbouring melt-pools, extending up to seven layers, Figure (a). These grains appear rectangular or circular on the cross-section view (Figure (b)) and are alternatively arranged with thin, highly columnar and slender grains with their [001] parallel to the build direction growing along the middle of the melt-pools, Figure (a). Solidifying regions inherit the grain orientation of the substrate thanks to the epitaxial growth. However, if the fast growth orientation (<100> in cubic crystals) is misaligned with the local thermal gradient, neighbouring grains with better alignment will outgrow them—competitive growth. Vertical thermal gradient along the centre of a melt-pool allowed the central grains to outgrow grains from the sides of the melt-pool. Such central grains grew across multiple layers with a preferred orientation of <001>||BD but only confined to along the centreline, making them highly textured and columnar. The interplay between epitaxial and competitive growth mechanisms resulted in the observed alternating microstructure similarly seen in FCC alloys [Citation6,Citation30,Citation31]. Separating the crystallographic orientation from grains with a low aspect ratio against ones with a high aspect ratio reveals interesting insights into the texture of the as-printed condition. Figure (c1) shows the pole figure (PF) from grains with aspect ratio <4. This PF showed very little texture, with maximum multiple uniform distribution (MUD) index of about 2.8. On the contrary, high aspect ratio grains (>4) were highly textured: the three <001> crystallographic orientations were aligned along the principal directions and has a maximum MUD index of about 7 (Figure (c2)). Such grains were found to be the slender ones locating at the centre of deposited beads.
Figure 2. EBSD scan of the as-print specimen parallel (a) and perpendicular (b) to the build direction. Pole figure of EBSD in (a) from grains with (c1) aspect ratio <4, (c2) >4 and (c3) from the combined orientation data of (a) and (b).
Note: Note the legend for the (a) and (b) showing the build direction and scanning directions. (a) and (b) are coloured with inverse pole figure along the build direction and the same scale shown at the bottom left of (a).
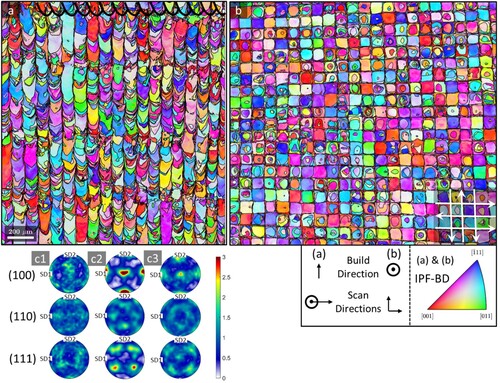
The PF in Figure (c3) shows combined orientation data from Figure (a,b). By comparing Figure (c2,c3), it can be concluded that the texture is primarily made up of high aspect ratio grains. EBSD, Figure (c3), confirmed the weak texture detected by XRD. Nevertheless, thanks to a higher resolution than XRD, EBSD was able to show the group of slender grains that had relatively strong <001> texture. The average grain sizes in as-print and wrought conditions were estimated to be 60+/−32 µm and 220+/−50 µm (the value of the error is the standard deviation), respectively.
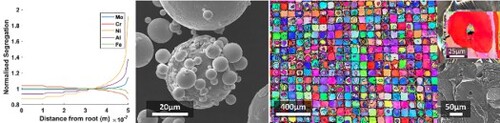
The as-printed microstructure is presented in Figure (a,b). While chemical etching effectively revealed the grain boundaries, it could not highlight the melt-pool boundaries and solidification cell boundaries. Figure (b) was one of the few locations in the sample in which solidification cells were revealed by etching. Figure (c) shows dislocation tangles rather uniformly distributed throughout the material. Unlike the typical cellular microstructure with high dislocation density at the boundaries, found in alloys fabricated by LPBF [Citation7,Citation30,Citation32,Citation33]. Some regions even resembled annealed condition, characterised by dislocation pile-ups near the grain boundaries, Figure (d). TEM investigation rarely showed oxides in the alloy (the red circle, bottom right of Figure (d)) in contrast to other alloys where fine oxides were commonly observed after LPBF [Citation30]. The chemical distribution at the observed length scale was rather uniform (Figure (f)), indicating minimal chemical segregation. OM and SEM investigations did not show the presence of solidification and liquation cracks across all the samples, indicating that the alloy has a high resistance to the liquid-state cracking, confirming the validity of the design.
Figure 3. SEM image of (a) five final layers of as-print sample (b) cross-section perpendicular to the build direction; (c), (d) bright-field TEM images of as-print sample; (e) solid-state crack with an EBSD of the region; (f) STEM-EDS line scan across the grain boundary.
However, despite the good resistance to solidification and liquation cracking as designed, the alloy was prone to solid-state cracking (SSC), Figure (e). EBSD of the cracked region reveals a transgranular cleavage crack, suggesting it was not due to solidification or liquation. These defect types were not accounted for in the alloy design, which was focused on solidification cracking. The SSC mainly associates with a reduction in material ductility, solid-state phase transformation, precipitation and weakened regions resulting from enriched (or depleted) chemical elements (chemical segregation). CALPHAD predicted that the designed alloy did not experience a solid-state transformation, partly confirmed by STEM and XRD. Figure (f,b) indicates that the chemical elements were distributed rather uniformly (probably explaining why there were no liquation cracks observed). Therefore, the observed solid-state cracking in the alloy was unlikely related to phase transformation, precipitation or chemical segregation. The ductile-brittle transition above the room temperature can cause the loss of ductility during cooling, increasing the risk of forming cracks in a solid-state. The FeCrAl alloy family is known to experience the ductile-brittle transition (DBT) at a temperature range between 100°C and 350°C [Citation26]. Sun et al. also showed that the DBT temperature (DBTT) in the FeCrAl alloy family strongly depends on the residual strain, composition and microstructure [Citation26]. Forged Fe–21Cr–5Al–3Mo with bimodal microstructure and relatively large grains (190 µm) remained brittle through the testing temperature range, up to 600°C, whereas the hot-rolled version with smaller uniform recrystallised grains (40 µm) showed a DBTT at a lower temperature, 400°C [Citation26]. FeCrAl investigated in this study has a bimodal microstructure with a grain size of 30–90 µm and high thermal stress during rapid cooling rates, making the alloy prone to SSC induced by the DBT.
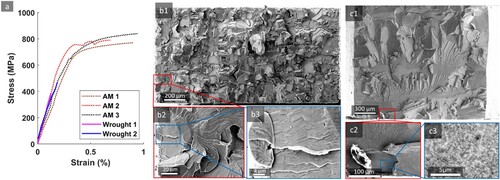
Tensile tests of the samples revealed very brittle behaviour, Figure . The ductility of as-printed samples was very limited (ca 0.7 ± 0.1%), while wrought samples hardly deform plastically, indicating the wrought condition was even more brittle. The 0.2% offset yield stress and ultimate tensile strength of as-printed samples were 750 ± 15 and 800 ± 15 MPa, respectively. Failure stress of the wrought samples was recorded at 450 ± 10 MPa. Fractographic investigations of samples AM1 and Wrought 1 revealed quasi-cleavage fracture surfaces, Figure (b1,c1) with failure initiating from process defects in both samples, Figure (b2–c2). Failure in as-printed sample started from a pre-existing transgranular crack, Figure (b2–3), whereas fracture of the wrought sample originated from a small pore with an oxidised surface, Figure (c2,c3). It can be noted that, even though the material did not show outstanding mechanical properties, the AM samples showed higher strength and ductility than the wrought condition—this is probably due to larger grains in the wrought.
Figure 4. Stress-strain behaviour of FeCrAl alloy in as-print (AM) and Wrought conditions (a) with respective fractographic investigations of sample AM1 and Wrought 1 (b), (c).
Although the material did not have exceptional ductility, no evidence of solidification and liquation cracking was observed in the alloy strongly supports the alloy design approach (against such cracking) and its aid in automated search for printable alloys for additive manufacturing. Scheil–Gulliver solidification simulation is shown to be extremely helpful to assess the effect of composition on the solidification range and solidification gradient, providing crucial assistance to reduce and eliminate the liquid state cracks. This study suggests that the developed alloy design criteria against the liquid state cracking are valid and effective. However, these results also signify the extreme importance of considering of the solid-state cracking in the alloy design and solid-state microstructure. In the case of the FeCrAl, the inherent brittleness of the BCC alloy below the DBTT and bimodal microstructure increased the risk of solid-state cracking and limited the ductility.
Supplemental Material
Download MS Word (6.6 MB)Acknowledgements
Authors would like to thank Mr Alessandro Piglione for performing the TEM imaging of the samples.
Disclosure statement
No potential conflict of interest was reported by the author(s).
Data availability statement
The raw/processed data required to reproduce these findings is available from the corresponding author upon a reasonable request.
Additional information
Funding
References
- Wang H, Chen L, Dovgyy B, et al. Micro-cracking, microstructure and mechanical properties of Hastelloy-X alloy printed by laser powder bed fusion: as-built, annealed and hot-isostatic pressed. Addit Manuf. 2021;39:101853.
- Williams RJ, Al-Lami J, Hooper PA, et al. Creep deformation and failure properties of 316 L stainless steel manufactured by laser powder bed fusion under multiaxial loading conditions. Addit Manuf. 2021;37:101706.
- Oliveira JP, LaLonde AD, Ma J. Processing parameters in laser powder bed fusion metal additive manufacturing. Mater Des. 2020;193:108762.
- Kurz W, Bezençon C, Gäumann M. Columnar to equiaxed transition in solidification processing. Sci Technol Adv Mater. 2001;2:185–191.
- Rappaz M, David SA, Vitek JM, et al. Analysis of solidification microstructures in Fe-Ni-Cr single-crystal welds. Metall Trans A. 1990;21:1767–1782.
- Pham M-S, Dovgyy B, Hooper PA, et al. The role of side-branching in microstructure development in laser powder-bed fusion. Nat Commun. 2020;11:749.
- Foster SJ, Carver K, Dinwiddie RB, et al. Process-defect-structure-property correlations during laser powder bed fusion of alloy 718: role of in situ and ex situ characterizations. Metall Mater Trans A Phys Metall Mater Sci. 2018;49:5775–5798.
- Ni X, Kong D, Zhang L, et al. Effect of process parameters on the mechanical properties of Hastelloy X alloy fabricated by selective laser melting. J Mater Eng Perform. 2019;28:5533–5540.
- Qian B, Saeidi K, Kvetková L, et al. Defects-tolerant Co-Cr-Mo dental alloys prepared by selective laser melting. Dent Mater. 2015;31:1435–1444.
- Letenneur M, Kreitcberg A, Brailovski V. Optimization of laser powder Bed fusion processing using a combination of melt pool modeling and design of experiment approaches: density control. J Manuf Mater Process. 2019;3:21.
- Akita M, Uematsu Y, Kakiuchi T, et al. Defect-dominated fatigue behavior in type 630 stainless steel fabricated by selective laser melting. Mater Sci Eng A. 2016;666:19–26.
- Polonsky AT, Lenthe WC, Echlin MP, et al. Solidification-driven orientation gradients in additively manufactured stainless steel. Acta Mater. 2020;183:249–260.
- Coniglio N, Cross CE. Initiation and growth mechanisms for weld solidification cracking. Int Mater Rev. 2013;58:375–397.
- Kou S. A simple index for predicting the susceptibility to solidification cracking. Weld J. 2015;94:374s–388s.
- Feurer U. Influence of alloy composition and solidification conditions on dendrite arm spacing, feeding and hot tearing properties of aluminium alloys. Proc Int Symp Delft; 1977. p. 131–145.
- Kou S. A criterion for cracking during solidification. Acta Mater. 2015;88:366–374.
- Rappaz M, Drezet J-M, Gremaud M. A new hot-tearing criterion. Metall Mater Trans A. 1999;30:449–455.
- Clyne TW, Wolf M, Kurz W. The effect of melt composition on solidification cracking of steel, with particular reference to continuous casting. Metall Trans B. 1982;13:259–266.
- Hooper PA. Melt pool temperature and cooling rates in laser powder bed fusion. Addit Manuf. 2018;22:548–559.
- De A, Walsh CA, Maiti SK, et al. Prediction of cooling rate and microstructure in laser spot welds. Sci Technol Weld Join. 2003;8:391–399.
- Das D, Pratihar DK, Roy GG. Cooling rate predictions and its correlation with grain characteristics during electron beam welding of stainless steel. Int J Adv Manuf Technol. 2018;97:2241–2254.
- Chen Y, Zhang K, Huang J, et al. Characterization of heat affected zone liquation cracking in laser additive manufacturing of Inconel 718. Mater Des. 2016;90:586–594.
- Katayama S. Defect formation mechanisms and preventive procedures in laser welding. In: Katayama S., editor. Handb laser weld technol. Cambridge: Elsevier; 2013. p. 332–373.
- Raabe D, Tasan CC, Olivetti EA. Strategies for improving the sustainability of structural metals. Nature. 2019;575:64–74.
- Field KG, Snead MA, Yamamoto Y, et al. Handbook on the material properties of FeCrAl alloys for nuclear power production applications; 2017.
- Sun Z, Yamamoto Y, Chen X. Impact toughness of commercial and model FeCrAl alloys. Mater Sci Eng A. 2018;734:93–101.
- Yamamoto Y, Pint BA, Terrani KA, et al. Development and property evaluation of nuclear grade wrought FeCrAl fuel cladding for light water reactors. J Nucl Mater. 2015;467:703–716.
- Rebak RB. Versatile oxide films protect FeCrAl alloys under normal operation and accident conditions in light water power reactors. JOM. 2018;70:176–185.
- He Y, Zhong M, Beuth J, et al. A study of microstructure and cracking behavior of H13 tool steel produced by laser powder bed fusion using single-tracks, multi-track pads, and 3D cubes. J Mater Process Technol. 2020;286:116802.
- Dovgyy B, Piglione A, Hooper PA, et al. Comprehensive assessment of the printability of CoNiCrFeMn in laser powder bed fusion. Mater Des. 2020;194:108845.
- Piglione A, Dovgyy B, Liu C, et al. Printability and microstructure of the CoCrFeMnNi high-entropy alloy fabricated by laser powder bed fusion. Mater Lett. 2018;224:22–25.
- Wang YM, Voisin T, McKeown JT, et al. Additively manufactured hierarchical stainless steels with high strength and ductility. Nat Mater. 2017;17:63–70.
- Wang X, Carter LN, Pang B, et al. Microstructure and yield strength of SLM-fabricated CM247LC Ni-superalloy. Acta Mater. 2017;128:87–95.